Chemicals
The microbiological media such as Actinomycetes isolation agar (AIA), Kuster’s agar, Ken knights agar (KKA), starch casein nitrate agar (SCNA) and starch casein agar were purchased from HiMedia Laboratories, India. The p-nitrophenyl-a-D-glucopyranoside (PNPG), yeast aglucosidase (EC 3.2.1.20), sodium phosphate salts, sodium carbonate, and other solvents were purchased from Sisco Research Laboratories Pvt. Ltd. (SRL) - India. Streptozotocin and rat-intestinal acetone powder was obtained from Sigma-Aldrich, (USA).
Isolation of actinobacteria
The soil samples were collected from salterns, a coastal area in Kothapatnam, Ongole, Andhra Pradesh (15°30′ 0″ N, 80°3′ 0″ E), India. The soil samples were collected at the depth of 10-25 cm from the top layer of the salt pan and transferred into sterile polyethylene bags and transported to the Molecular and Microbiology Research Laboratory, Environmental Biotechnology Division, School of Bio Sciences and Technology, VIT University and were stored at 4 °C for further studies. Isolation and enumeration of actinobacteria were performed on selective media such as Actinomycetes isolation agar (AIA), Kuster’s agar, Ken knights agar (KKA), starch casein nitrate agar (SCNA), and starch casein agar. The soil samples were serially diluted using sea water up to 10
-7 dilution and one millilitre of the serially diluted samples were inoculated into different plates. All these media were supplemented with nalidixic acid and cyclohexamide (100 µg/mL) to avoid bacterial and fungal contamination. The plates were incubated at 28 °C and monitored periodically for 3 months for actinobacteria growth. Morphologically, distinct colonies were separated, purified, and maintained on actinomycetes isolation agar plates (
26).
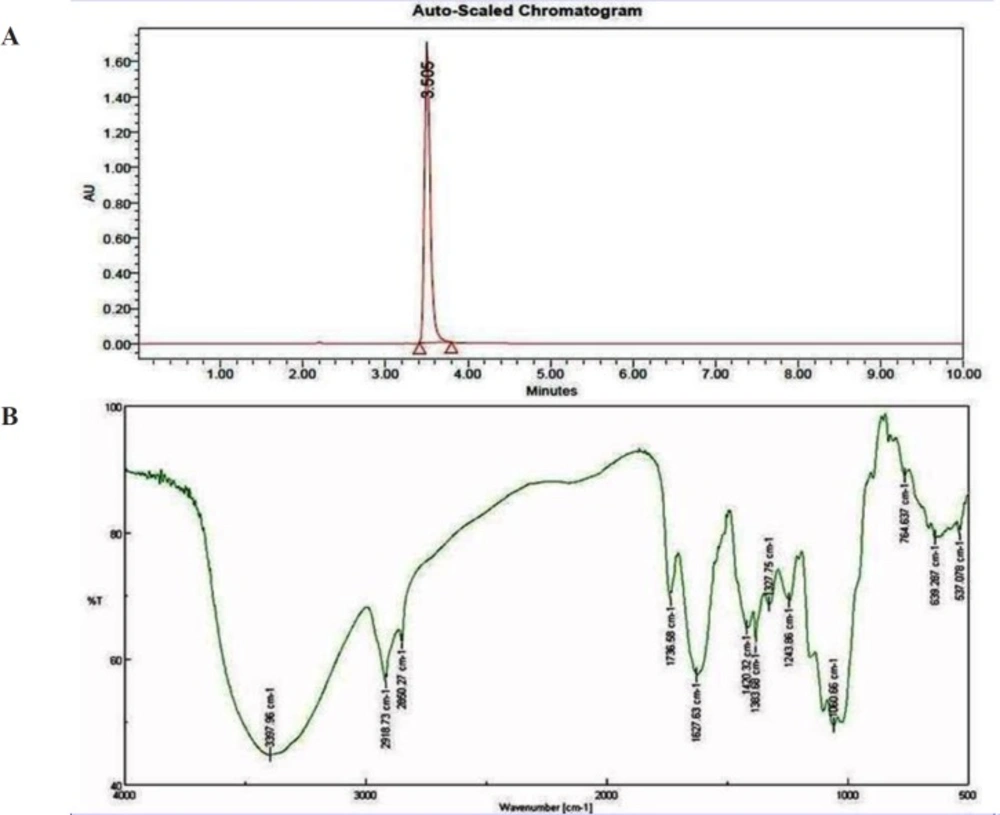
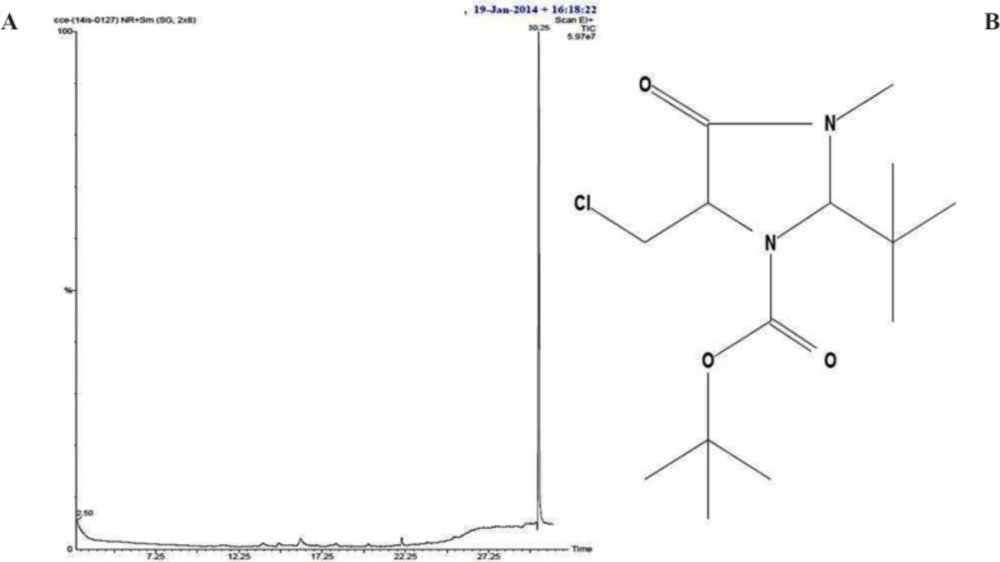
| Wave No. | Correspondence Peaks |
|---|
| 2918.73, 2850.27 | CH group |
| 1736.58 | C=O |
| 1627.63 | O-H (asymmetrical) |
| 1420.32 – 1060.66 | Pyrrole ring |
| 764.637 | C-Cl |
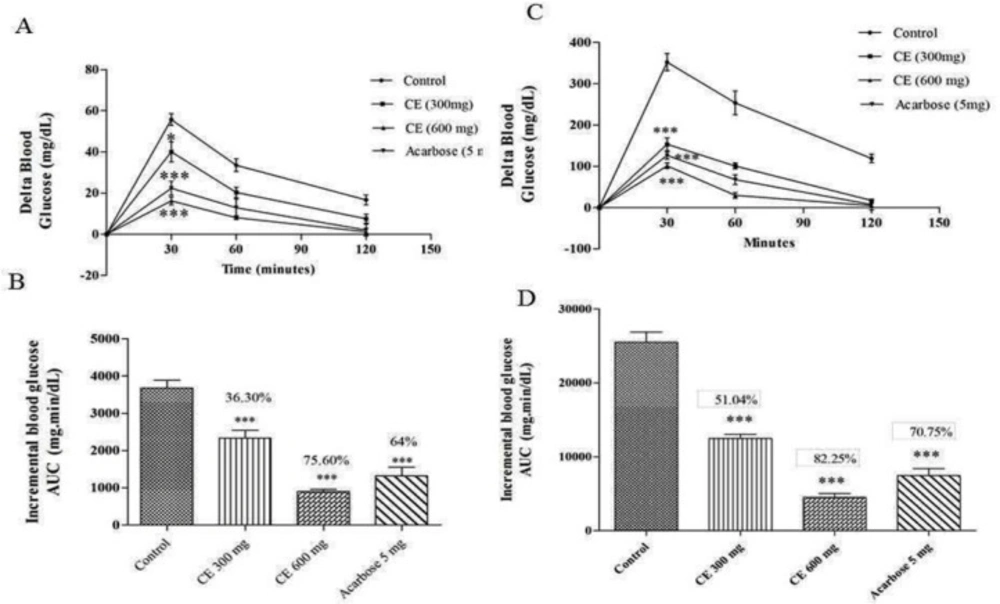
(A) and (C) curves showing the glycemic response in normal and diabetic rats after maltose loading along with CE. (B) and (D): incremental AUC0-120 min in diabetic and normal rats after maltose administration. Data are expressed as the mean ± SE (n = 6). *denotes P < 0.05 compared with control and ***-denotes P < 0.001 compared with control
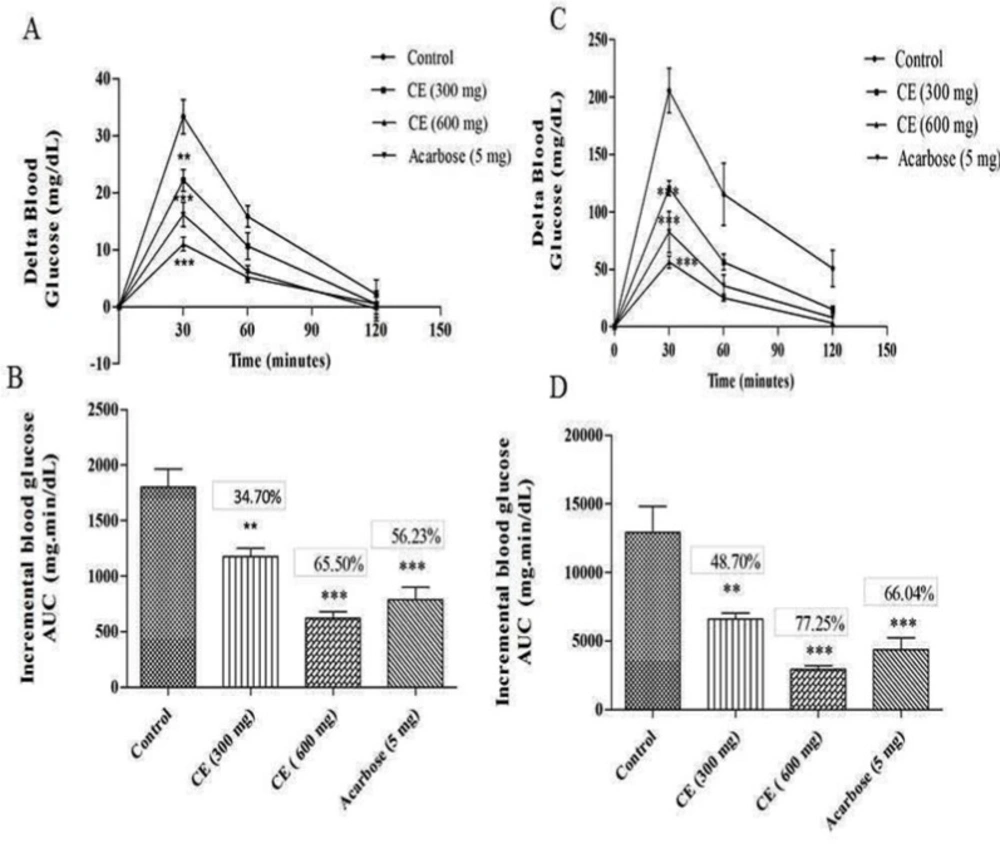
A) and (C) curves showing the glycemic response in normal and diabetic rats after sucrose loading along with CE. (B) and (D): incremental AUC0-120 min in diabetic and normal rats after sucrose administration. Data are expressed as the mean ± SE (n = 6). **denotes P < 0.01 compared with control and ***-denotes P < 0.001 compared with control
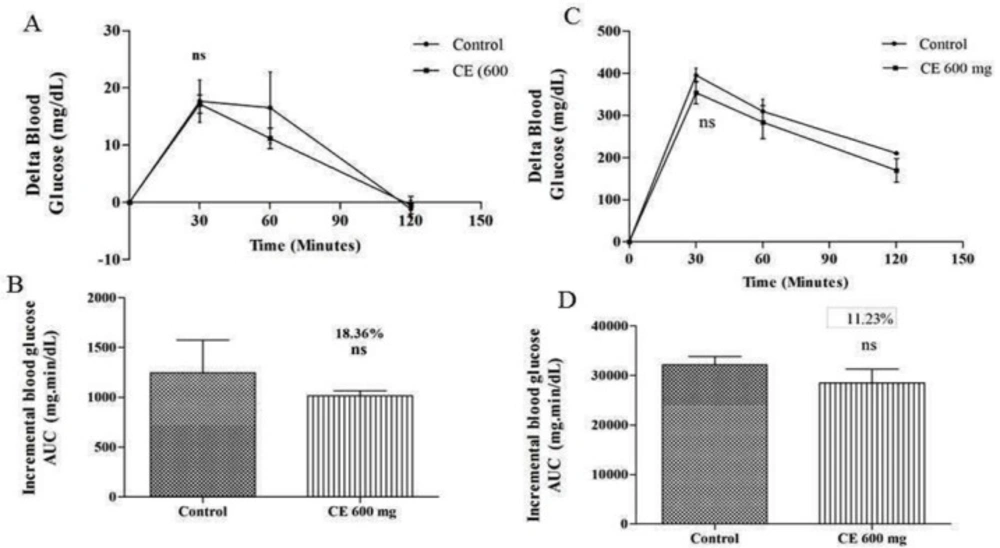
A) and (C) curves showing the glycemic response in normal and diabetic rats after glucose loading along with CE. (B) and (D): incremental AUC0-120 min in diabetic and normal rats after glucose administration. Data are expressed as the mean ± SE (n = 6). ns: not significant
(A) HPLC chromatogram of isolated bioactive compound from S. Coelicoflavus SRBVIT13. (B) FTIR spectrum of bioactive compound isolated from S. coelicoflavus SRBVIT13.
A), gas chromatographic spectrum of isolated bioactive compound from S. coelicoflavus SRBVIT13. (B), structure of proposed compound from S. coelicoflavus SRBVIT13
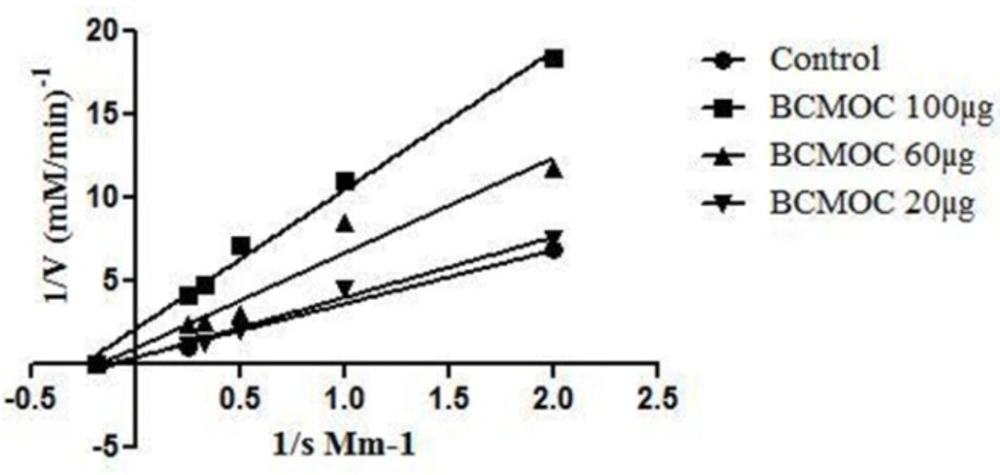
Enzyme Kinetics of α–glucosidase enzyme inhibitor by S. coelicoflavus SRBVIT13
Fermentation process
The purified actinobacterial isolates were inoculated into 50 mL of production medium (SS medium) in 100 mL Erlenmeyer flasks. The production medium was prepared with 50% marine water and 50% distilled water (pH 8.5) and incubated at 28 °C for 7 days on a rotary shaker at 10,000 rpm. After fermentation, the medium was harvested and centrifuged to remove cell debris. Then, collected supernatant was lyophilized and stored at 4 °C for further studies.
Primary screening of actinobacteria for α-glucosidase inhibitor activity
The actinaobacteria were primarily screened for their α-glucosidase inhibitory activity using slightly modified protocols of Brand-Williams
et al., (1995) and Jo
et al., (2009) for yeast and mammalian α-glucosidase enzyme inhibitory activity, respectively (
27,
28). Briefly, 10 μL yeast α-glucosidase and rat α-glucosidase (1 U/mL in 0.1 M potassium phosphate buffer) were added separately to 50 μL of phosphate buffer (50 mM; pH 6.8) and mixed with 20 μL of varying concentrations of actinobacterial crude extract (20, 40, 60, 80 and 100 μg/mL) separately in a 96-well microtiter plate. The test sample mixture was pre-incubated for 5 min at 37 °C and 20 μL of 1 mM p-nitrophenyl α-D-glucopyranoside (PNPG) was added to the mixture as substrate. After incubation (37° C for 30 min), 50 µL of 0.1M sodium carbonate solution was added to terminate the reaction. Acarbose was used as positive control and distilled water as a negative control. The enzyme inhibition activity was estimated by recording the absorbance at 405 nm in a microtiter plate reader (Bio-TEK, USA). The percentage of inhibition was calculated as % Inhibition = [(AC - AS)/AC] × 100, where AC and AS are the absorbance of the control and test, correspondingly.
Secondary screening of potent actinobacteria for Mammalian α-glucosidase inhibitor activity
Three potent actinobacterial isolates were inoculated into 50 mL of production media (SS broth) in 100 mL Erlenmeyer flasks separately and incubated at 28 °C for 7 days on a rotary shaker (REMI) at 100 rpm. After incubation, the production media was harvested and centrifuged at 10,000 rpm for 10 min in a cooling centrifuge (REMI). The supernatant was collected and treated with different solvents like petroleum ether, ethyl acetate, n-butanol, chloroform, and hexane in the ratio of 1:1 in a separating funnel. The solvent layer was separated from the supernatant solution, the collected solvent samples were evaporated using a rotary vacuum evaporator (IKA, Germany). For mammalian α-glucosidase inhibitor assay, rat-intestinal acetone powder (200 mg) was dissolved in 4 mL of 50 mM ice cold phosphate buffer and sonicated for 15 min at 4 °C. After vigorous vortexing for 20 min, the suspension was centrifuged (10,000×g, 4 °C, 30 min) and the resulting supernatant was used for the assay. The condensed solvent crude extracts were further screened for mammalian α-glucosidase inhibitor activity.
Evaluation of in-vivo postprandial hyperglycemic activity
Experimental animals
Adult male albino Wistar rats were selected for the in-vivo study and they were kept in the animal house at Center for Biomedical Research, VIT University, Vellore, India. Animals weighing 160-210 g were kept in polycarbonate cage and maintained in a room under 12-h light/12-h dark cycle at 25 ± 2 °C and fed with standard rodent diet and water. All the experimental handling protocols were approved by the ethical committee in accordance with the Institutional Animal Ethics Committee, 1333/C/10/CPCSEA.
Induction of diabetes
The adult male albino Wistar rats were fasted for a period of 16 h. After fasting, the animals were induced for diabetes using streptozotocin (STZ). STZ was prepared in the fresh citrate buffer (0.1 M, pH 4.5) and administered intraperitoneally at the concentration of 45 mg/kg body weight. After three days of induction, the fasting blood glucose level of more than 250 mg/dL was considered as diabetic.
Antihyperglycemic activity of S. coelicoflavus SRBVIT13 extract in maltose, sucrose loaded normal and diabetic rats
A total of 24 normal rats were divided into four groups for assessing the antihyperglycemic activity of
S. coelicoflavus SRBVIT13 in maltose loaded normal rats. Group I received maltose (2 g/kg body weight) alone and considered as control. Group II was treated with maltose (2 g/kg) and acarbose (5 mg/kg). Group III was co-administrated with maltose (2 g/kg) and chloroform extract of
S. coelicoflavus SRBVIT13 (300 mg/kg) and group IV was treated with maltose (2 g/kg) and double the concentration of chloroform extract of
S. coelicoflavus SRBVIT13 (600 mg/kg). After maltose administration in animals, the blood glucose level was monitored on 0
th, 30
th, 60
th and the 120
th min. of the experiment using the glucometer (Model: One touch Horizon™). The variation in blood glucose level after the oral maltose administration was measured and denoted as delta blood glucose. The same experimental animal model was followed for sucrose loaded diabetic rats (
29).
Antihyperglycemic activity of S. coelicoflavus SRBVIT13 in glucose loaded normal and diabetic rats
To assess the antihyperglycemic activity of
S. coelicoflavus SRBVIT13 by the inhibition α-glucosidase enzyme, a total of 12 normal rats were used and divided into two groups. The first group was considered as controls and received glucose (2 g/kg body weight), while the second group received glucose (2 g/kg) and chloroform extract of
S. coelicoflavus SRBVIT13 (600 mg/kg). After treatment, the blood glucose level was measured on 0
th, 30
th, 60
th, and the 120
th min of the treatment. The change in blood glucose level at the initial stage after glucose treatment was analysed and denoted as delta blood glucose (
29).
Isolation, purification and characterisation of bioactive compound from the chloroform extract of S. coelicoflavus SRBVIT13
Isolation of Bioactive compound
The chloroform extract of S. coelicoflavus SRBVIT13 was further screened for purification of bioactive compound using preparative high performance liquid chromatography. In this experiment, Acetonitrile:Water (70:30) was used as a mobile phase for the separation of bioactive compound from chloroform crude extract. Different fractions were collected using preparative HPLC and the collected fractions were further tested for their mammalian α-glucosidase inhibitor activity. The fractions which were showing potent inhibition against mammalian α-glucosidase enzyme were further tested to identify the potent compound.
Structural Elucidation of the lead compound
FT-IR spectra were recorded on a FTIR spectrophotometer (Thermo Nicolet – Avatar-330, USA) in order to characterize the presence of functional groups in isolated bioactive compound. Two mg of the isolated pure compound was added to 200 mg of potassium bromide (KBr- FT-IR grade) and prepared as disc pellet. All the measurements were carried out in the range of 400-4000 cm-1 at a resolution of 4.0 cm-1. The isolated bioactive was further characterized using GCMS (GC: Clarus 680 and MS: Clarus 600 - EI) with Elite – 5MS column and the Helium gas (99.99%) was employed as a carrier gas under constant current rate of 1 cc/min. In this experiment, 1 µL of the sample was injected in the ratio of 10:1 and mass scan was processed under 50 to 600 Da. During the process, the oven temperature was designed from 60 to 300 °C. The NMR characterization of the bioactive compound was processed with the help of NMR spectroscopy (AscendTM400, Bruker, Germany). The isolated bioactive compound was dissolved in deuterated chloroform and scanned for 1H-NMR, and 13C-NMR at 400 MHz in an NMR spectroscopy.
Statistical analysis
Statistical analysis was performed using one-way analysis of variance (ANOVA) followed by Dunnett’s Multiple Comparison Test using GraphPad Prism software. P-values of less than 0.05 were considered statistically significant. The delta blood glucose levels were expressed as mean ± SE for six animals in each group.