Exposure Assessment for Some Pesticides through Rice Consumption in Iran Using a Multiresidue Analysis by GC-MS

authors:

avatar Maryam Amirahmadi a , b , avatar Hassan Yazdanpanah c , d , * , avatar Farzad Kobarfard e , f , avatar Shahram Shoeibi a , b , avatar Morteza Pirali-Hamedani g , avatar Hossein Rastegar a , b

Food
.
.
Department
Department
.
Department

how to cite: Amirahmadi M, Yazdanpanah H, Kobarfard F, Shoeibi S, Pirali-Hamedani M, et al. Exposure Assessment for Some Pesticides through Rice Consumption in Iran Using a Multiresidue Analysis by GC-MS. Iran J Pharm Res. 2018;17(1):e124769. https://doi.org/10.22037/ijpr.2018.2187.

Abstract

In communities which consume rice as main food, importance of risk assessment for contaminants is always taken into consideration by health authorities. The present study is an attempt for monitoring of 56 pesticides from different chemical groups in rice samples collected from local markets in Tehran and estimation of daily intake of interested pesticides through this monitoring. A valid method based on spiked calibration curves and QuEChERS sample preparation was developed for determination of pesticides residue in rice by GC/MS. The analytical results of the proposed method were in good agreement with the proficiency test (FAPAS 0969). One-hundred-thirty-five rice samples were analyzed and 11 pesticide residues were found in 10.4% of the samples. Of which 5.2% were contaminated with unregulated pesticides. None of the samples, which were contaminated with regulated pesticides, had contamination higher than maximum residue limit. The mean estimated dose (ED) was calculated with respect of mean of contamination and mean daily consumption of rice. ED of the found pesticides is much lower than the related ADIs.

Introduction

Cereal crops constitute more than 60% of the total worldwide agricultural production (1). More than 90% of the world’s rice is cultured and consumed in Asia (2). Rice is a major food crop for more than 60% of the world’s population. The consumption of rice in Iran is 110 g per capita/day (3).

Rice is a pesticide-intensive crop; pesticides are applied either directly to the soil prior to planting and flooding of rice fields, or a few weeks after flooding to control noxious weeds and pests (4).

Exposure assessment is necessary to reach correct Maximum Residue Levels (MRLs) for consumer health assurance. Intake of pesticides residue in food is obtained by multiplying the residue level in the food by the amount of that food consumed. The total dietary intake of the pesticide residue is then calculated by summing the intakes of all foods containing the residue. The estimated dietary intake resulting from application of a pesticide and other sources should be less than its established Acceptable daily intake (ADI) (5). Risk assessment for pesticides residue in traditional way is based on applying of individual pesticides. However, human beings are exposed daily to multiple pesticides and the risk of their exposure which acts in a similar way can be characterized by cumulative risk assessment (6).

The increasing public concern about pesticide contamination of food and the environment in recent years has increased the demand for broader and stricter pesticide monitoring. Therefore, it is necessary to develop rapid, reliable, and effective analytical methods for the simultaneous determination of the residues of pesticides in order to obtain accurate information about the types and quantity of the pesticides used (7). Importance of pesticides residue monitoring in rice could be proved by focusing of a few recently published articles (8-12).

In this study we investigate the levels of 56 pesticides residue in rice with a rapid multi-residue method of analysis based on a QuEChERS extraction procedure using spiked calibration. The selected pesticides included GC-amenable pesticides, those for which MRL is issued by Iranian National Standards Organization (INSO) (13) and Codex alimentarius commission and the most frequently reported pesticides in rice by FDA during 1996-2006 survey (14).

The developed method was used for simultaneous determination of the selected pesticides in 135 domestic and imported rice samples collected from Tehran retail market. Three major components of the process of dietary pesticide risk assessment are estimation of pesticide residue levels, estimation of food consumption patterns, and characterization of risk based on a comparison of exposure estimates with toxicological criteria. Dietary pesticide risk assessment and estimation of pesticides daily intake have been the focus of a few recently published articles (15-20).

Estimated daily intake (EDI) is a parameter of calculating the amount of contact with pesticides in each day. There are four main approaches for collecting food consumption data which are Household-based methods, Population-based methods, Individual-based methods, and combined methods. This Estimated Dose (ED) of detected pesticides in adults was determined using residue concentration data obtained from survey, combined with the consumption of rice for adult (60 kg body weight) in Iran (21). To evaluate the health risk of estimated dietary pesticide exposure, it was compared with ADIs set by JMPR (22). Exceeding the ADI may indicate potential harm and require further evaluation.

Experimental

Chemicals

All pesticides standards were purchased from Dr. Ehrenstorfer Co. (Augsburg, Germany). All organic solvents, intended for extraction, were at least LC grade and purchased from Merck (Darmstadt, Germany). Bulk quantities of NaCl were obtained from Merck (Darmstadt, Germany). Anhydrous MgSO4 was obtained from SIGMA-Aldrich CO. (Japan). The MgSO4 was baked for 5 h at 500 ºC in a furnace to remove phthalates and residual water. Primary secondary amine (PSA) was purchased from Supelco (Bellefonte, USA).

GC–SQ/MS

An Agilent Technologies 6890N Network GC System chromatograph (Wilmington, USA) with a SQ detector and equipped with an Agilent 7683B autosampler (Agilent technologies, USA) was used. A HP-5 capillary column (30 m × 0.25 mm I.D., 1 μm film thickness) was used for separation.

Calibration standards

Individual stock standard solutions (1 mg/mL) were prepared in ethyl acetate and stored in the dark at −20 °C. They were kept for 1 h at ambient temperature prior to their use. A mixed stock standard solution of pesticides was prepared in ethyl acetate at 15 μg/mL with respect to each pesticide. Spiked calibration curves at 7 levels of 10, 25, 50, 100, 250, 500 and/or 1000 ng/g triplicate were prepared by addition of 10 μL, 25 μL, 50 μL, 100 μL, 250 μL, 500 μL, and/or 1000 μL of mixed standard stock solution, respectively, to 15 g portions of blank rice samples in each case.

A stock solution of triphenylmethane (TPM) in ethyl acetate at concentration of 1 mg/mL was used as internal standard and an aliquot of 10 μL of TPM solution in ethyl acetate was added to the spiked rice sample. The samples so obtained were treated as described in sample preparation section.

Sample preparation

A domestic sample purchased from under controlled filed and analyzed 5 times for ensuring blank samples. An aliquot of 10 μL of internal standard solution (1000 mg/L) was added to 15 g of milled (Romer mill, USA) blank rice sample in a 50 mL falcon tube and after being left for 1 h at ambient temperature in dark, 15 mL acetonitrile was added. The mixture was mixed at high speed with vortex mixer for 1 min. One gram of NaCl and 2 grams of activated anhydrous MgSO4 was added to the mixture, and mixing was continued for an additional 60 sec. The mixture was centrifuged for 5 min at 4000 rpm at -5 °C. The supernatant was transferred to a 15 mL falcon tube containing 1 g MgSO4 and 300 mg PSA. After shaking for 1 min and centrifugation for 5 min at 4000 rpm at -5 °C, 4 mL of supernatant was transferred to a 5 mL vial and evaporated to ca. 0.3 mL under a gentle stream of nitrogen gas. The residue was reconstituted by toluene to obtain 1 mL solution, and after shaking for 3 min, 2 μL of the solution was injected into gas chromatograph.

Recovery studies

For recovery determination, spiked blank rice samples at concentration levels of 10, 25, 50, 100, 250, 500, and 1000 ng/g were prepared in triplicates and they were kept for 1 h at ambient temperature prior to their use and then treated according to the procedure described in sample preparation section. The recoveries were calculated using the calibration curves constructed using spiked samples.

GC-SQ–MS analysis

The GC-SQ-MS was employed with helium as the carrier gas at a constant flow of 1 mL/min. The oven temperature started at 75 °C and remained at this temperature for 3 min increasing to 120 °C at 25 °C/min ramp rate and then increased to 300 °C at 5 °C/min ramp, holding at 300 °C for 11 min. Injection port was adjusted at 250 °C and splitless mode was used.

After acquisition of the total ion chromatogram for the mixed stock standard solutions in scan mode, peaks were identified by their retention time and mass spectra. The identification was confirmed by comparing the relative abundances for three-four ions (one quantifier and two-three qualifiers) of the experimental standards to known relative abundances of the Pest Library reference spectra. The most abundant ion that showed no evidence of chromatographic interference and had the highest signal-to-noise ratio was selected for quantification purposes.

Quantitation

The concentrations of pesticides were determined by interpolation of the relative peak areas for each pesticide to internal standard peak area in the sample on the spiked calibration curve.

Validation with a proficiency test (FAPAS) of a rice sample

We participated in the proficiency test organized by the Food Analysis Performance Assessment Scheme of the Central Science Laboratory York (UK) in March 2011. (FAPAS 0969) (23). Each participant received a rice test material to be analyzed for pesticide. The result reported by our laboratory for pesticides in dispatched test material with Z-score (-0.1 and zero for Malathion and pirimiphos- methyl respectively) successfully met requirements of the organization. The result supported accuracy of the improved method for quantification of pesticides.

Application to real samples

One-hundred-thirty-five rice samples were collected from local markets in Tehran.

Sample size was 1 kg and during one year in each month 11-13 samples were collected from retail markets and stored in -27 °C until analysis. In order to avoid any possible thermal decomposition of pesticide residues, 200 g rice sample was mixed with 100 g dry ice and milled with Romer mill (Stylemaster Drive, USA). A 15 g portion of the sample was subjected to the process of sample preparation described in sample preparation section.

Estimated Dose (ED)

The Estimated Daily Intake (EDI) as an effective item in risk assessment studies represents the total exposure from all known or suspected exposure pathways for an average person. For pesticides, Estimated Dose (ED) is related to exposure for each type food depends on the pesticide content in food and the amount of food consumed. In this study estimated dose (EDs) of the detected pesticides in adults was determined using the mean of residue concentration, combined with the amount of daily consumption of rice in Iran. ED is calculated according to the following formula (24);

ED=C × CR BW

Where,

ED = Estimated Dose is generally the number of milligrams of the contaminant that enter the body for each kilogram of body weight (mg/kg/day).

C = Mean Concentration of the interested pesticide.

CR = Contact Rate, typical units for food eaten are grams per day (g/day).

BW = Body Weight: The average body weight of an individual in kilograms (kg).

Results

Gas chromatographic determination

Analysis was performed in the SIM mode based on the use of one target and two-three qualifier ions. Pesticides were identified according to their retention times and target and qualifier ions. The quantitation was based on the peak area ratio of the targets to that of internal standard. Table 1 summarizes studied pesticides with their target and qualifier ions used in SIM mode in this study.

Calibration curves were constructed for each compound using blank rice sample spiked at six or seven different concentration levels in triplicate. For identification of pesticides, the retention time, and three-four ions (one for quantitation and two-three for identification) were used. A GC–SQ–MS chromatogram of 56 pesticides and internal standard (TPM) analyzed in spiked rice is shown in Figure 1.

Method validation

Linearity of the calibration curves

The fifty-six pesticides showed linearity in SIM mode. Linear spiked calibration curves for all the interest pesticides in two range, 10-500 ng/g and 10-1000 ng/g were obtained with correlation factors >0.997. The Calibration data (Equation and regression coefficient) of 56 pesticides in spiked rice calibration curves is showed in Table 2.

Limits of detection and limits of quantification

Limits of detection (LODs) and limits of quantification (LOQs) of the proposed method were measured in spiked samples and calculated by considering a value 3 and 10 times that of background noise, respectively. The LODs and LOQs for all the pesticides were ≤10 ng/g and ≤25 ng/g, respectively, except for deltamethrin (LOD = 30 ng/g and LOQ = 90 ng/g). Table 3 shows limit of quantification (ng/g) for studied pesticides.

Recovery

Table 4 presents the recovery and repeatability for seven concentration levels of pesticides. The recovery of pesticides at 7 concentration levels triplicates was in the range of 96.5-104.6%. In terms of repeatability, majority of the pesticides gave RSD < 20% with n = 21 at each spiking level. The recoveries and repeatabilities are in accordance with the criteria set by SANCO Guideline (25).

Matrix effect

The matrix can affect the chromatographic response to the analyte. The effects depend on the nature of both matrices and the analyte. The effect is measured as an area ratio of signal in the matrix-matched standard to that in standard solution. The matrix effects were determined for the 56 pesticides at 200 ng/g concentration level. As presented in Table 5, the mean value of the matrix effect was 89.72 ± 17.7% and ranged from 51.65% to 141.5%. In this study, spike calibration curves were established for overcoming the matrix effects.

Pesticide residues in real samples

One-hundred-thirty-five samples were milled and analyzed according to the method described above. Fourteen (10.4%) of the 135 samples showed contamination with carbaryl, diazinon, deltamethrin, pirimiphos-methyl, piperonyl botuxide, permethrin and/or malathion (Table 6). The concentrations of diazinon, chlorpryfos, permethrin, malathion, and pirimiphos-methyl were below and for deltamethrin was above the MRLs of these pesticides in rice in Iran. No MRL is issued for the other detected pesticides in rice in Iran.

Figure 2 shows (a) the overlaid chromatogram of a spiked rice sample at 100 ppb levels and (b) a contaminated rice sample in SIM mode.

Estimated Dose (ED)

The estimated dose (ED) of the detected pesticides in adults was determined using the mean of residue concentration, combined with the amount of daily consumption of rice in Iran. Table 7 compares the mean estimated dose of detecting pesticides with the acceptable daily intake (ADIs) established by JMPR (2006). As it appears in this table the intakes of eleven detected pesticides found in this study are much lower than the ADIs for them. Seven rice samples (5.2%) were contaminated with unregulated pesticides.

Discussion

The use of mass spectrometry, with its information-rich content and explicit confirmation, is recommended for monitoring pesticide residues in the entire world (8-11, 26-28). Matrix-induced response enhancement was first described by Erney et al. in GC analysis methods (29). Since an effective elimination of the sources of the matrix induced response enhancement is not likely in practice, the analysts often try to compensate for the effect using alternative calibration methods such as matrix match calibration and standard addition methods. In the present study, we used spiked calibration curves approach to overcome the problems caused by the matrix. In this approach, calibration curves are prepared by the addition of standard solution to blank rice samples and these samples subjected to the same sample preparation procedure which is intended to be used for unknown samples. This way, the standard sample matrices will have the same composition as the unknown samples and therefore the effect of matrix is reflected in both standards and unknown samples. The calibration curve is constructed using these spiked calibration standards and it is easily used to calculate the concentration of analyte (s) in unknown sample without being concerned about the matrix effects. The recoveries and repeatabilities were in accordance with the criteria set by SANCO Guideline (25).

Table 1

The retention time, diagnostic ions and selected quantification ion for the target pesticides and internal standard

No. CompoundDiagnostic ionsQuantification ionRetention time (min)
1Propoxure 1152.1, 110.1, 209110.110.907
2Dichlorvous220, 109, 185,145109.012.468
3Captan151,79.1, 267,149, 107151.018.097
4Carbaryl144, 115.1, 125.9, 116.1144.018.834
5Propoxure 2152.1, 110.1, 209110.121.128
6Diphenyl amine169, 168.1, 167.1169.021.512
7Alpha HCH218.9, 182.9, 216.9, 180.9180.923.511
8Dimethoate143, 125, 93125.023.911
9Gamma HCH218.8, 182.9, 109218.824.609
10Beta HCH218.9, 182.9, 109218.924.898
11Diazinon304, 276, 179304.025.245
12Etrimfos292.1, 277, 181.1292.125.910
13Chlortalonil266, 264, 228.9, 267.9266.026.055
14Pirimicarb238.2, 166.1, 138166.126.373
15Chlorpyrifos methyl286, 125, 323, 168, 288286.027.398
16Metalaxyl206.2, 160.1, 132.1206.227.773
17Heptachlor336.9, 271.8, 236.9, 100336.927.898
18Alderin263, 262.9, 264.9262.927.961
19Fentirothion277, 260, 214,276.1277.028.461
20Pirimiphos methyl305, 290, 276,180305.028.461
21Malathion285, 173, 158173.028.711
22Fenthion278, 262.9,169,153278.029.212
23Chlorpyrifos314, 257.8, 197,199314.029.337
24Triphenyl methan244, 16524429.775
25Bioalthrin123.1, 107.1, 91.1123.130.766
26Fipronil420, 367, 351, 255367.030.858
27Heptachlor-exo-epoxide352.8, 262.9, 236.8, 238.8352.830.950
28Tridimenol 1168.1, 128, 112168.131.072
29Heptachlor-endo-epoxide252.9, 236.9,238.9, 234.8252.931.103
30Tridimenol 2168.1, 128, 112168.131.348
31Fenamiphos303.2, 288, 260.1, 154303.232.372
32Alpha-Endosulfan236.9, 264.9, 338.9236.932.420
33Hexaconazol257.9, 233, 214, 175214.032.693
34Oxadiazon344.1, 302, 258, 174.9258.032.994
354,4 DDE317.9, 246,176246.033.049
36Dieldrin279, 262.9, 236.9262.933.410
37Iprodione244.1, 187, 246.1, 189187.034.467
38Beta-Endosulfan339.1, 264.9, 236.9236.934.627
39Ethion384.1, 231, 175231.034.737
402,4 DDT235, 199, 165.1235.034.865
41Propiconazole 1259, 190.9, 172.9,175259.035.840
42Edifenphos200.9, 310, 173310.035.908
43Propiconazole 2259, 190.9, 172.9,175259.036.094
444,4 DDT235, 199.1, 176.1, 237235.036.099
45Propargite350.2, 335.2, 201.1350.236.560
46Teboconazole249.9, 125, 296.8, 252.2249.936.589
47Piperonyl botuxide193, 176.1, 149.1,177.1176.136.624
48Bromopropylate340.9, 184.9, 342.9, 182.9340.937.926
49Fenpropathrin265.1, 208, 181.1, 206.1181.138.045
50Tetradifon355.9, 228.9, 159, 226.9355.938.997
51Phosalone367, 182, 154, 183.9182.039.301
52Lambda cyhalothrin208, 181.1, 227.2, 199.3197.039.302
53Permethrin 1183.1, 127,163.1,153183.141.329
54Permethrin 2183.1, 127,163.1,153183.141.585
55Fenvalerate 1419.2, 225.1, 167225.146.261
56Fenvalerate 2419.2, 225.1, 167225.146.919
57Deltamethrin281, 252.9,255, 522252.949.397
Table 2

Calibration data (equation and regression coefficient) for two range of 56 pesticides in spiked rice calibration curves

CompoundEquationRegression Coefficient
Propoxur 1,2*y = 0.9785x + 0.00210.998
**y = 0.9743x + 0.00490.998
Dichlorvosy = 0.5155x - 0.00170.999
y= 0.5548x - 0.00450.999
Captany = 0.0418x - 000050.999
y = 0.0421x - 000090.999
Carbaryly = 0.1617x - 000030.999
y = 0.1674x - 0.00070.999
Diphenyl aminey = 0.4282x + 0.00160.998
y = 0.4404x + 0.00010.999
Beta HCHy =0.1216x + 0.00070.999
y = 0.1297x - 0.00020.999
Dimethoatey = 0.2244x - 0.00120.999
y = 0.2017x + 0.00150.997
Gamma HCHy = 0.1206x + 0.00140.999
y = 0.133x - 000080.998
Alpha HCHy = 0.1356x + 0.00060.999
y = 0.1485x - 0.0010.998
Diazinony = 0.0995x + 0.00020.999
y = 0.1032x - 0.00030.999
Etrimfosy = 0.1502x + 0.00020.999
y = 0.1598x - 0.0010.999
Chlortalonily = 0.2652x - 0.0020.998
y = 0.2754x - 0.00320.999
Pirimicarby = 0.6021x + 0.00060.999
y = 0.6404x - 0.0040.999
Chlorpyrifos-methyly = 0.3077x - 0.00040.999
y = 0.3172x - 0.00150.999
Metalaxyly = 0.2734x + 0.00220.999
y = 0.2892x + 0.00030.999
Heptachlory = 0.1403x - 0.00010.999
Alderiny = 0.0142x + 0.00190.998
y = 0.0174x + 0.00160.998
Fenitrothiony = 0.2311x - 0.00070.999
Pirimiphos-methyly = 0.155x + 0.000040.999
y= 0.1656x - 0.00120.999
Malathiony = 0.1895x + 0.00090.999
y = 0.186x + 0.00090.999
Fenthiony = 0.3424x - 0.0010.999
y = 0.3451x - 0.00130.999
Chlorpyrifosy = 0.1192x + 0.00040.999
y=0.1298x - 0.00090.999
Bioalthriny = 1.16x - 0.00230.999
y=1.2203x - 0.00690.999
Fipronily = 0.2816x + 0.00040.999
Heptachlor-exo-epoxidey = 0.1422x + 0.00020.999
y= 0.1493x - 0.00070.999
Triadimenol 1,2y = 0.2432x + 0.00090.997
Heptachlor-endo-epoxidey = 0.288x - 0.00080.999
y= 0.3009x - 0.00240.999
Fenamiphosy = 0.2161x - 0.00060.999
y= 0.237x - 0.00280.999
Alpha-Endosulfany = 0.0664x - 000080.999
Hexaconazoly = 0.1717x - 0.00040.999
Oxadiazony = 0.3511x - 0.00190.999
y = 0.3579x - 0.00270.999
4,4 DDEy = 0.7672x - 0.00150.999
y = 0.7992x - 0.00540.999
Dieldriny = 0.0907x - 0.00040.999
y = 0.0912x - 0.00050.999
Iprodioney = 0.0744x - 0.00050.999
y = 0.1895x + 0.00090.999
Beta-Endosulfany = 0.1735x - 0.00020.999
2,4 DDTy = 0.4826x - 0.00110.999
y = 0.5003x - 0.00320.999
Ethiony = 0.3493x - 0.00190.999
y = 0.3625x - 0.00350.999
4,4 DDTy = 0.3561x - 0.00150.999
y = 0.4205x - 0.0090.997
Edifenphosy = 0.1307x - 0.00030.999
y = 0.1357x - 0.00090.999
Propiconazole1, 2y = 0.2099x + 0.00030.999
Propargitey = 0.0658x - 0.00040.999
Teboconazoley = 0.2269x - 0.00180.999
y = 0.2264x - 0.00170.999
Piperonyl botuxidey = 0.7256x + 0.00240.999
Bromopropylatey = 0.2108x - 0.00070.999
Fenpropathriny = 0.2108x - 0.00070.999
Tetradifony = 0.211x - 000040.998
Phosaloney = 0.342x + 0.00090.999
Lambda cyhalothriny = 0.4504x - 0.00030.999
Permethrin 1,2y = 0.7962x + 0.01440.999
Fenvalerate 1,2y = 0.0873x + 0.000050.999
Deltamethriny = 0.0118x + 0.00390.999
Table 3

Limits of quantification (ng/g) for studied pesticides

CompoundLOQCompoundLOQ
Propoxure 110Tridimenol 220
Dichlorvous5Alpha-Endosulfan10
Captan10Hexaconazol5
Carbaryl10Oxadiazon25
Propoxure 254,4 DDE5
Diphenyl amine5Dieldrin10
Beta HCH5Iprodione25
Dimethoate8Beta-Endosulfan5
Gamma HCH5Ethion20
Alpha HCH52,4 DDT5
Diazinon10Propiconazole 110
Etrimfos10Edifenphos10
Chlortalonil10Propiconazole 210
Pirimicarb54,4 DDT5
Metalaxyl5Teboconazole15
Heptachlor10Piperonyl botuxide5
Alderin25Bromopropylate10
Fentirothion20Fenpropathrin8
Pirimiphos methyl8Tetradifon20
Malathion12Phosalone10
Fenthion10Lambda cyhalothrin115
Chlorpyrifos10Lambda cyhalothrin210
Bioalthrin10Permethrin 110
Fipronil3Permethrin 210
Heptachlor-exo-epoxide5Fenvalerate 110
Tridimenol 110Fenvalerate 215
Heptachlor-endo-epoxide5Deltamethrin90
Fenamiphos10
Table 4

Average recoveries (%) and range of relative standard deviations (%) of pesticides obtained by GC-MS analysis of rice samples at 7 spiking levels (n = 3).

CompoundAverage recovery (%) (n=3)
Total recovery (%) (n = 21)Range of RSD%
10 (ng/g)25 (ng/g)50 (ng/g)100 (ng/g)250 (ng/g)500 (ng/g)1000 (ng/g)
Propoxure 1, 2115.594102.791.7106.898.6102.199.33.2-19.7
Dichlorvous126.999.4102.891.9101.1102.810199.95.3-11.7
Captan118102.593.395.4102.299.7100.198.93.1-15.0
Carbaryl 108.795.297.996.2103.399.4103.798.72.9-18.7
Diphenyl amine 100.3111.810610492.9101.5100.5102.84.6-23.4
Alpha HCH86.583.493.7103.3104.498.8101.897.60.1-20.3
Dimethoate113.6112.192.697.495.8101.297.699.40.5-21.7
Gamma HCH102.476.195.9101.110598.7101.9996.51.9-13.7
Beta HCH94.283.894.7104102.899.2101.297.6 4.5-20.2
Diazinon101.490.690.2107.5100.499.7100.798.72.1-15.4
Etrimfos99.289.496.5103.610199.6101.398.63.6-12.4
Chlortalonil119.6105.7115.597.592.4101.8100.8102.33.7-26.3
Pirimicarb100.691.697.9101.8101.199.7106.999.82.4-18.4
Chlorpyrifos methyl114.8104.8109.8101.292.6101.6100.6101.82.8-25.9
Metalaxyl72.490.9102.498.696.7100.8101.298.53.8-15.7
Heptachlor108.888.483.1101.8104.799.799.896.3 1.9-25.2
Alderin74.9117.3102.893.299.2105.698.7102.84.9-22.2
Fentirothion121.593.2101.296.794.4104.999.2101.61.1-16.0
Pirimiphos methyl103.990.591.2102103.399.2101.498.82.4-15.8
Malathion7080.4105.6108.498.794.898.798.74.2-27.5
Fenthion120.4102.2105.9101.494.9101.1100.2100.91.1-19.6
Chlorpyrifos101.183.890.196.999.7100.3109.797.40.6-16.2
Bioalthrin117.297.810495.3100.6100.3100.1102.21.6-16.9
Fipronil104.294.9107.8103.498.398.8100.4101.11.5-12.8
Heptachlor-exo-epoxide97.592.698.598.1103.499.3101.198.60.8-11.4
Tridimenol 119.8112.9104.397.4384.13109.9398.5398.5 4.5-12.4
Heptachlor-endo-epoxide11598.4103.196.898.5100.4100.9101.91.3-15.0
Fenamiphos119.891.198.3101.399.9103.1110.31010.8-11.8
Alpha-Endosulfan117.975.4102.696.8101.5100.799.799.2 5.4-26.4
Hexaconazol115.3106.4102.595.599.5100.2102.2103.1 2.1-22.8
Oxadiazon122.7112.1100.197.297.7100.6100.4104.43.5-15.0
4,4 DDE118.294.8100.8100.198.8100.3100.8101.91.0-7.8
Dieldrin123.5110.2102.997.397.8100.1100.1104.6 0.4-12.4
Iprodione119.9109.999.197.498.5100.498.5103.41.8-9.3
Beta-Endosulfan107.5102.988108.291.3104.599.4100.37.6-19.2
Ethion122.7106.5103.297.797.3100.7100.6104.11.2-11.3
2,4 DDT116.897.499.897.5100.3100100.75101.84.6-16.3
Propiconazole 1, 2112.5102.893.595.297.2103.699.3100.6 0.8-11.3
Edifenphos120.7101.8103.296.998.8100.4100.8103.2 2.1-11.9
4,4 DDT110.985.999.699.610089.210398.3 1.8-13.5
Propargite118.9115.798.889.597.7103.499.4103.40.8-8.8
Teboconazole120.4116.1105.191.598.9100.599.7104.61.5-19.1
Piperonyl botuxide78.497.2104.3100.9107.494.5100.897.62.0-22.8
Bromopropylate115.3110.5103.799.893.7101.7106.2104.42.0-14.7
Fenpropathrin115.893.3108.691.799.699.9102101.69.8- 20.1
Tetradifon118.692.293.691.194.7108.899.299.68.8-29.6
Phosalone95.9107.7101.897.595.8103.299.5100.26.3-15.4
Lambda cyhalothrin10296.192.594.51100.7103.199.298.33.0- 12.4
Permethrin 1, 2102.7115.294.593.494.3106.498.8188.89.2-18.7
Fenvalerate1, 2 105.3107.993.295.492.3105.399.299.87.0-25.2
Deltamethrina .....................96.8102.498.4100.399.43.4-15.1
Table 5

The average and standard deviation of matrix effect on 56 pesticides in rice.

No.CompoundAverage matrix effect (%)STDEVa (%)
1Propoxure 177.769.8
2Dichlorvous86.342.6
3Captan82.290.2 
4Carbaryl97.669.9
5Propoxure 280.057.1
6Diphenyl amine83.817.3
7Alpha HCH71.670.6
8Dimethoate94.424.2
9Gamma HCH63.340.3
10Beta HCH63.21.3
11Diazinon50.651.7
12Etrimfos68.052.3
13Chlortalonil76.215.1
14Pirimicarb79.645.4
15Chlorpyrifos methyl75.056.7
16Metalaxyl77.5214.6
17Heptachlor106.031.4
18Alderin78.091.7
19Fentirothion80.582.1
20Pirimiphos methyl74.882.8
21Malathion93.051.7
22Fenthion87.621.8
23Chlorpyrifos83.6913.9
24Bioalthrin87.6510.7
25Fipronil 84.4711.6
26Heptachlor-exo-epoxide75.1912
27Tridimenol 176.6412.9
28Heptachlor-endo-epoxide74.1713.3
29Tridimenol 282.2610.6
30Fenamiphos136.181.5
31Alpha-Endosulfan92.514.7
32Oxadiazon83.310.4
334,4 DDE65.856.6
34Dieldrin80.871.1
35Iprodione141.570.4
36Beta-Endosulfan92.121.6
37Ethion85.625.8
382,4 DDT80.684.7
39Propiconazole 1100.080.7
40Edifenphos95.989.1
41Propiconazole 2102.565.3
424,4 DDT96.645
43Propargite96.051.2
44Teboconazole95.018.8
45Piperonyl botuxide104.170.7
46Bromopropylate105.8510.4
47Fenpropathrin112.92.3
48Tetradifon100.915
49Phosalone107.82.6
50Lambda cyhalothrin109.939.3
51Permethrin 1103.073.1
52Permethrin 298.840.7
53Fenvalerate 199.340.6
54Fenvalerate 2136.893.3
55Deltamethrin 79.190.5
56Hexaconazole108.189
Table 6.

Pesticide residues and their concentrations in domestic and imported rice samples in Tehran, Iran.

SampleSourcePesticideCon. (µg/g)MRL (µg/g)
1DomesticDeltamethrin1.9± 0.190.05
2DomesticDeltamethrin0.19± 0.050.05
3DomesticPiperonyl botuxide0.1± 0.04-----
Permethrin0.02± 0.0062
4ImportedCarbaryl0.03± 0.0061
5ImportedDiazinon0.06± 0.010.1
Pirimiphos-methyl0.03± 0.0061
6ImportedMalathion0.02± 0.0088
7ImportedCarbaryl<LOQa-----
8ImportedPiperonyl botuxide0.01± 0.0040.05
9ImportedGamma HCH0.01± 0.0020.05
Alpha HCH0.02± 0.0030.05
10DomesticChlorpryfos0.02± 0.0030.1
11ImportedChlorpryfos0.11± 0.020.1
12DomesticDiazinon0.01± 0.0030.1
13DomesticPiperonyl botuxide0.02± 0.005-----
14DomesticBioalthrin0.02± 0.004----
Table 7.

ADI (μg/kgbw/day) and Estimated Dose (ED) (μg/kgbw/day) for pesticides found in domestic and imported rice samples marketed in Tehran

PesticideADIED a, b, c, dADI (%e)
Carbaryl80.00950.095
Diazinon50.00990.199
Pirimiphos-methyl300.00770.026
Deltamethrin0.01091.09
Permethrin100.00930.093
Malathion3000.0110.004
Gamma and Alpha HCH10.0090.9
Chlorpryfos100.0110.11
Bioallethrin------0.0093-----
Piperonyl botuxide2000.00620.003
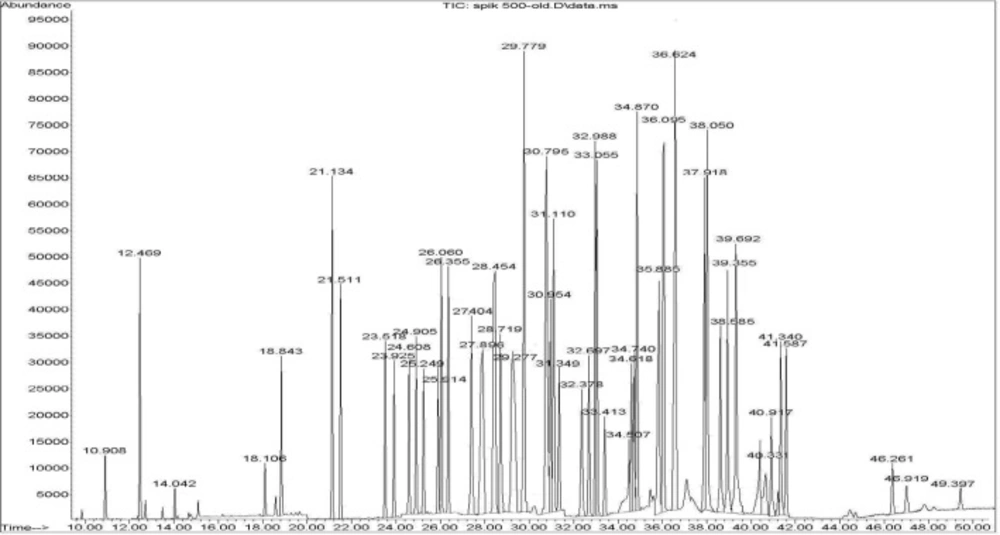
A representative chromatogram obtained for the 56 pesticides in a rice sample spiked at 500 ng/g and internal standard (Triphenyl methane, Rt = 29.77 min
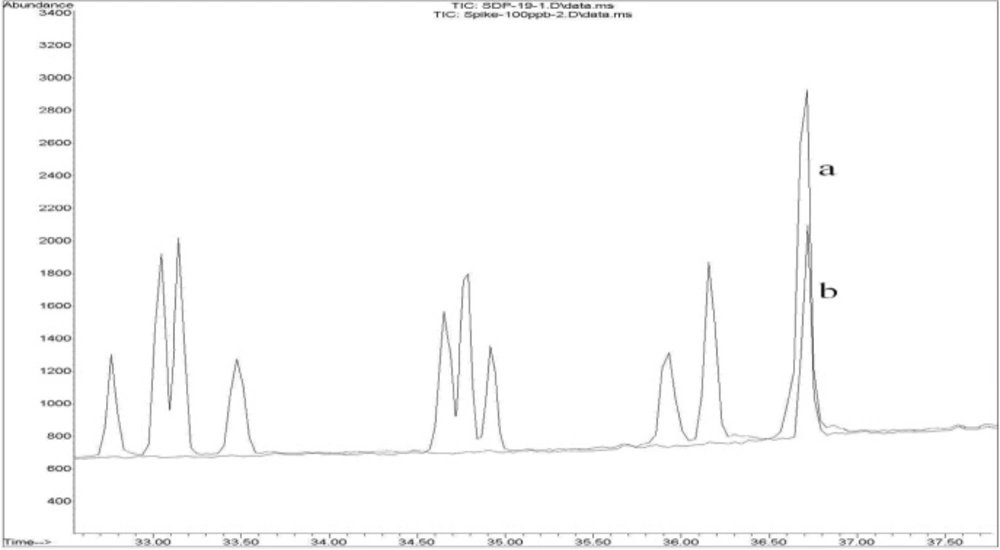
(a) An overlaid GC-MS-SIM chromatogram of a rice sample spiked at 100 ng/g of piperonyl butoxide and (b) a contaminated rice sample with piperonyl butoxide in SIM mode

The developed method was successfully applied to the analysis of 135 samples of rice collected from Tehran market. A diverse group of pesticide residues such as organophosphorus (diazinon, pirimiphos-methyl, malathion), pyrethroids (deltamethrin, permethrin), carbamate (carbaryl) and benzodioxole (piperonyl botuxide) pesticides were detected in this study. The concentrations of malathion, chlorpryfos, permethrin, diazinon and pirimiphos-methyl were blow the MRLs of these pesticides in Iran. Two rice samples were contaminated with deltamethrin above the MRL. For the other pesticides, no MRL is issued for rice in Iran. In a similar study by Neugen et al. in South Korea 6% of the rice samples were contaminated with pesticides (2). They found 88 different pesticides in the samples, and twelve samples were contaminated with more than two pesticides (2).

In a survey conducted by FDA during 1996-2006, ca. 8% of rice samples were found contaminated with pesticides. The most frequently found pesticides included malathion and carbaryl (13). In the present study, fourteen (10.4%) of the 135 samples showed contamination with one of the following pesticides: carbaryl, diazinon, deltamethrin, pirimiphos-methyl, piperonil botuxide, permethrin, bioalthrin, chlorpyrifos and malathion; two samples contained deltamethrin at 0.19 and 1.90 mg/kg; two samples contained carbaryl at <LOQ and 0.03 mg/kg; three samples contained piperonyl botuxide at 0.01, 0.1 and 0.02 mg/kg; one sample contained permethrin at 0.02 mg/kg; two sample contained diazinon at 0.06 and 0.01 mg/kg, one sample contained bioalthrin at 0.02 mg/kg, two samples contained chlorpyrifos at 0.11 and 0.02 mg/kg and one sample contained pirimiphos-methyl at 0.03 mg/kg. Estimated Daily Intake (EDI) of a chemical can be calculated by adding up all the exposures from various pathways. For one contaminant the EDI can be calculated according to the following Equation:

EDI = EDa + EDw + EDs + EDf + EDws + EDss

The amount of the contaminant as each ED (Estimated Dose) is taken in through a different combination of exposure pathway and the exposure route. In this Equation EDa, EDw, EDs, EDf, EDws, and EDss are the amount inhaled through the air, taken by drinking water, by eating soil, with food, absorbed through skin contact with water and absorbed through skin contact with the soil, respectively (24). In the current study we just calculated the estimated dose of interested pesticides through eating rice and the results demonstrate this pathway has a small portion of ADI.

Conclusion

A simple and rapid method was developed to determine 56 pesticide residues in rice; a main food in Iranian food basket. The method which consists of a QuEChERS simple sample preparation and GC-SQ-MS-SIM analysis showed a high sensitivity and confirmatory power necessary for the determination of pesticide residues at the levels of maximum residue limits (MRLs) issued in Iran for rice. The excellent method validation data and proficiency test results (Z-score: −0.1 and zero) of the official Food Analysis Performance Assessment Scheme (FAPAS) suggested that the present quantitative method could be applied for rapid determination of pesticides in rice. The developed method has the advantage of using spiked calibration curves that minimizes the matrix interferences leading to higher accuracy for pesticides analyses. Contamination of 5.2% of the analyzed rice samples with unregulated pesticides, (according to Iran’s pesticides regulations) calls for the routine monitoring programs for analysis of pesticide residues in rice. The results show the intakes of eleven detected pesticides found in this study are much lower than the ADIs for them.

Acknowledgements

References

  • 1.

    Harlan JR. The Living Fields: Our agricultural heritage. New York: Cambridge University Press; 1995. 30 p.

  • 2.

    Nguyen TD, Han EM, Seo MS, Kim SR, Yun MY, Lee DM, Lee GH. A multi-residue method for the determination of 203 pesticides in rice paddies using gas chromatography/mass spectrometry. Anal. Chim. Acta. 2008;619:67-74. [PubMed ID: 18539176].

  • 3.

    National nutritional science and food Technology Research Institute. National report of comprehensive study food consumption pattern and nutrition status in Iran during 2000-2002. 2004. 24 p.

  • 4.

    Orlando JL, Kuivila KM. US geological survey scientific investigations report. 2004;5097:28-34.

  • 5.

    Global Environment Monitoring System. Food Contamination Monitoring and Assessment Programme (GEMS/Food) in collaboration with the Codex Committee on Pesticide Residues. 1997. 3 p.

  • 6.

    Mileson BE, Chambers JE, Chen WL, Dettban W, Enrich M, Elderfrawi AT, Gaylor DW, Hamernik K, Hodgson E, Karczmar AG. Common mechanism of toxicity: A case study of organophosphorus pesticides. Toxicol. Sci. 1998;41:8-20. [PubMed ID: 9520337].

  • 7.

    Cho SK, Abd El-Aty AM, Park YS, Choi JH, Khay S, Kang CA, Park BJ, Kim SJ, Shim JH. A multiresidue method for the analysis of pesticide residues in polished rice (Oryza sativa L) using accelerated solvent extraction and gas chromatography and confirmation by mass. Biomed. Chromatogr. 2007;21:602-9. [PubMed ID: 17385804].

  • 8.

    Liu P, Liu Q, Ma Y, Liu J and Jia X. Analysis of pesticide multiresidues in rice by gas chromatography-mass spectrometry coupled with solid phase extraction. Chin. J. Chromatogr. 2006;24:228-34.

  • 9.

    Libin L, Hashi Y, Yaping Q, Haixia Z, Jinming L. Rapid analysis of multiresidual pesticides in agricultural products by gas chromatography-mass spectrometry. J. Anal. Chem. 2006;34:783-6.

  • 10.

    Nguyen TD, Lee BS, Lee BR, Lee DM, Lee GH. Multiresidue method for the determination of 109 pesticides in rice using the quick easy cheap effective rugged and safe (QuEChERS) sample preparation method and gas chromatography/mass spectrometry with temperature control and vacuum concentration. Rapid Commun. Mass Spectrom. 2007;21:3115-22. [PubMed ID: 17705253].

  • 11.

    Liu LB, Hashi Y, Qin YP. Mass spectrometry for measuring multiresidual pesticides in agricultural products. J. Chromatogr. B. 2007;845:61-8.

  • 12.

    Toteja GS, Mukherjee A, Diwakar S, Singh P, Saxena BN. Residues of DDT and HCH pesticides in rice samples from different geographical regions of India: A multicenter study. Food Addit. Contam. 2010;20:933-9.

  • 13.

    Iranian National Standards Organization; No. 13120, 1394. Maximum pesticide residue limit in cereals. National standard; 2016.

  • 14.

  • 15.

    Doong RA, Lee CY, Sun YC. Dietary intake and residues of organochlorine pesticides in foods from Hsinchu, Taiwan. J. AOAC Int. 1999;82:677-82. [PubMed ID: 10367388].

  • 16.

    Jensen AF, Petersen A, Granby K. Cumulative risk assessment of the intake of organophosphorus and carbamate pesticides in the Danish diet. Food Addit. Contam. 1999;20:776-8.

  • 17.

    Chun OK, Kang HG. Estimation of risks of pesticide exposure, by food intake, to Koreans. Food Chem. Toxicol. 2003;41:1063-76. [PubMed ID: 12842175].

  • 18.

    Kawahara J, Yoshinaga J, Yanagisawa Y. Dietary exposure to organophosphorus pesticides for young children in Tokyo and neighboring area. Sci. Total Environ. 2007;378:263-8. [PubMed ID: 17412399].

  • 19.

    Chen C, Li Y, Chen M, Chen Z, Qian Y. Organophosphorus pesticide residues in milled rice (Oryza sativa) on the Chinese market and dietary risk assessment. Food Addit. Contam. Part A. 2009;26:340-7.

  • 20.

    Mawussi G, Sanda K, Merlina G, Pinelli E. Assessment of average exposure to organochlorine pesticides in southern Togo from water, maize (Zea mays) and cowpea (Vigna unguiculata). Food Addit. Contam. Part A. 2009;26:348-54.

  • 21.

    Yazdanpanah H, Shafaati A, Foroutan SM. Occurrence of deoxynivalenol in foods for human consumption from Tehran, Iran. Iran. J. Pharm. Res. 2014;13:87-92.

  • 22.

    JMPR. Pesticides residues in Food: Report of the Joint FAO/WHO Meeting of Experts. Geneva: World Health Organization; 1999.

  • 23.

  • 24.

    Authority of the Minister of National Health. Minister of Supply and Services Canada. Investigating Human Exposure to Contaminants in the Environment, ISBN-0-662-23543-6. 1995. 9 p.

  • 25.

    SANCO. Quality control procedures for pesticide residues analysis. Guidelines for residues monitoring in the European Union. Document No. SANCO/10476/2003 Central Science Laboratory. York, UK;

  • 26.

    Hajslova J, Zrostlikova J. Matrix effects in (ultra) trace analysis of pesticide residues in food and biotic matrices. J. Chromatogr. A. 2003;1000:181-97. [PubMed ID: 12877171].

  • 27.

    Anastassiades M, Lehotay SJ, Stajnbaher D, Schenck FJ. A fast and easy multiresidue method employing acetonitrile extraction/partitioning and “dispersive solid-phase extraction" for the determination of pesticide residues in produce. J. AOAC Int. 2003;86:412-31. [PubMed ID: 12723926].

  • 28.

    Mastovska K, Hajslova J, Lehotay SJ. Ruggedness and other performance characteristics of low-pressure gas chromatography–mass spectrometry for the fast analysis of multiple pesticide residues in food crops. J. Chromatogr. A. 2004;1054:335-49. [PubMed ID: 15553161].

  • 29.

    Erney DR, Gillespie AM, Gilvydis DM. Explanation of the matrix-induced chromatographic response enhancement of organophosphorus pesticides during open tubular column gas chromatography with splitless or hot on-column injection and flame photometric detection. J. Chromatogr. A. 1993;638:57-63.