
Introduction
Rice as a cereal crop, is the most important and principal staple food for a large group of the human population in the world. Rice is the major source of energy in 17 countries in Asia and the Pacific, nine countries in North and South America and eight countries in Africa. More than 3.5 billion people depend on rice for survival and it supplies 20% of the calories consumed worldwide. Although rice alone cannot supply all of the nutrients necessary for adequate nutrition, but it is a good source of thiamine, riboflavin, niacin, glutamic and aspartic acid. Unmilled rice contains a significant amount of dietary fiber (1). Botanically, rice is an annual plant and belongs to the genus Oryza that includes about 22 species. Only two species of rice are considered important as food species for humans and cultivated in the world: Oryza sativa is grown worldwide and Oryza glaberrima grown in parts of West Africa (2). In the recent decades, rice production has increased and according to FAO data, global production of rice has risen steadily from about 215 million tons of paddy rice in 1961 to over 738 million tons in 2012 (3).
The use of pesticides, like pre and post-emergence herbicides, insecticides, and fungicides during various stages of cultivation is one of the most important factors associated with growing in rice production. However, the use of these pesticides affects the whole system of rice: the soil, water, and rice grain. In addition to commonly used pesticides, presence of banned pesticides in rice is another important challenge (4). Nowadays, appearance of pesticide residues in human foods including rice is a great challenge in food safety. Pesticides cause public concern due to their potential adverse effects on human health, which is most obvious in the developing fetus and young child (5). The most common route of exposure to pesticides is ingestion of treated food commodities containing residues. To ensure the safety of food for consumers, numerous legislations such as the EU directives (6) or the Iranian regulation (7), have established maximum residue limits (MRL) for pesticides in foodstuffs. Therefore, control and management of pesticide residues in foods, according to regulations require powerful analytical methods. For these reasons there is a clear need to develop fast methods for the multi-residue analysis of the most commonly used and banned pesticides in rice crops.
Although various techniques based on GC and LC methods coupled to the different detectors such as electron capture detector (ECD), nitrogen-phosphorus detector (NPD) and mass spectrometry detector (MS) have been developed for determination of pesticides residues in rice (8, 9), most of the are suitable for analysis of raw rice samples. Rice is cooked in different methods by boiling, steaming, or in a microwave oven around the world (10). Therefore, food safety investigators are interested to study the effects of cooking processes in pesticide residue levels in rice.
Previous studies in different commodities showed that cooking processes reduced pesticide levels in home and industrial food preparation. In 2002, Lalah and Wandiga studied the effect of boiling on the removal of persistent malathion residues from cooked beans and maize. The results showed that malathion and its polar metabolites, malathion-α and malathionβ-monocarboxylic acids were completely removed by boiling, but malaoxon was not eliminated and still detected in high levels in the solvent extracts of cooked beans and maize (11). Effects of cooking in a microwave oven on elimination of trifluralin, chlorpyrifos, decamethrin, cypermethrin and dichlorvos in rice and beans were studied. The spiked rice and beans samples, at levels of 1.0 mg/kg, were cooked at powers of 500 W and 800 W for 15- 45 min, respectively. After cooking, the levels of spiked pesticides were decreased from 92% to 99% in both rice and beans samples (12). Shoeibi et al. investigated the effect of cooking on removal of three carbamates including carbaryl, propoxur and pirimicarb on spiked rice samples. The levels of pesticides reduced 78%, 55%, and 35% for carbaryl, propoxur, and pirimicarb, respectively, after cooking (13). Another study showed that combination of heat and water in house and industrial processing, dramatically reduced the levels of four fungicides includings, boscalid, mancozeb, iprodione, and propamocarb and insecticide deltamethrin in spinach (14). Angel Yang et al. monitored 44 multi-class pesticides in 31 different food materials using QuEChERS extraction and LC-MS/MS method. In nine samples including colored rice, glutinous rice (white rice), glutinous rice (unpolished rice), green chili, ginger, butterbur, chinamul, spinach, and perilla leaf, 8 pesticides including acetamiprid, azoxystrobin, fenobucarb, fosthiazate, iprobenfos, lufenuron, propiconazole, and trifloxystrobin were detected. After cooking and washing the positive samples, residue levels of mentioned compounds were considerably decreased (15).
The above mentioned studies confirmed that various cooking methods and in house preparation of foods can decrease the residue levels of some pesticides. Therefore, it is necessary to determine the reduction of other pesticide residues in different commodities that are processed in various methods all over the world. In the present study, we investigated the effects of the Iranian traditional in house method for rice cooking (Kateh) on reduction of 41 multi-class pesticide residues using QuEChERS extraction-based LC-ESI-MS/MS technique
Experimental
Chemicals
Pesticides reference standards (purity > 96.0%), triphenylphosphate (TTP) as internal standard, and anhydrous magnesium sulfate (MgSO4) were purchased from Sigma–Aldrich/Fluka/Riedel-de-Haën (Germany). Ammonium formate, methanol (MeOH) and HPLC-grade acetonitrile (MeCN) were purchased from Acros (Belgium). Ethyl acetate (EtAc), glacial acetic acid (HOAc), and sodium acetate were supplied from Merck (Darmstadt, Germany). Bondesil-primary secondary amine (PSA, 40 μm) was provided from Interchim (France). HPLC grade water was obtained by purifying demineralized water on a Milli-Q Plus ultra-pure water system (Millipore, Molsheim, France).
Individual stock solutions of pesticides at a concentration of 1000 μg/mL were prepared in ethyl acetate (and methanol for Cartap and Fuberidazole) according to their solubility at 20 °C. A mixed intermediate standard solution at a concentration of 5 μg/mL was prepared via appropriate dilution of the stock solutions in MeOH containing 0.1% HOAc in order to avoid the degradation of the pesticides (8). This solution was used as a spiking solution for validation experiments. Matrix-matched multi-level calibration standards solutions were prepared using sample extracts obtained from organic rice. Aliquots of blank samples (5 mL of final MeCN layer), which were extracted via QuEChERS method were evaporated and reconstituted in 5 mL of mixture of appropriate working standard solutions and 0.02% HOAc in MeOH to generate final concentrations of 0.02, 0.04, 0.10, 0.20, 0.50, and 1.0 mg/kg for the matrix-matched calibration standards. A stock solution of triphenylphosphate (TTP) in ethyl acetate at concentration of 20 μg/mL was used as internal standard and an aliquot of 50 μL of TTP solution in ethyl acetate (20 μg/mL) was added to the spiked rice sample.
Pesticide selection
The 18 selected LC-amenable pesticides (carbaryl, cartap, chlorpyrifos, cinosulfuron, diazinon, edifenphos, malathion, oxadiazon, oxydemeton-methyl, primiphos-methyl, propiconazole, Spinosyn A and D, thiobencarb, thiophanate-methyl, triadimenol, tricyclazole, triflumizole) are used for rice production in Iran and MRLs have been established for them by Iranian National Standard Organization (INSO), NO.13120 (7). According to the regulation, some pesticides are banned to be used in Iran. Existence of banned pesticides in any kind of food including rice can produce health problems and it is necessary to investigate the presence of them in foods. Therefore, 23 banned LC-amenable pesticides according to INSOʼs list (5), including azinphos-ethyl, bromacil, carbofuran, chlorbromuron, chlorfenvinphos, coumaphos, dialifos, dicrotophos, etrimfos, fluometuron, fuberidazole, iprobenfos, methabenzthiazuron, methidathion, monocrotophos, omethoate, phosphamidon, phoxim, propoxur, pyrazophos, TCMTB, tri-allate, and triazophos were selected.
The comprehensive list covers 41 pesticides with different modes of action such as herbicides, fungicides, insecticides and plant growth regulators with different chemical natures such as organophosphates, carbamates, Spinosyn A and D, strobilurins, and quaternary ammoniums (Table 1).
Sample preparation for processing
Before cooking process, 5 mL of mixed pesticides (1000 μg/mL) standard stock solution were dissolved in 2.5 L tap water (final concentration 2 μg/mL). Two-hundred and fifty grams of rice sample was submerged in the mentioned solutions containing the 41 pesticides followed by air-drying at room temperature in a hood for 24 h. A 50 g portion of the samples was ground with 50 g dry ice and analyzed as control sample and the rest was used for evaluation of different processing factors. For each process (including washing and cooking) 50 g rice was used.
| No. | Pesticides | Molar mass | Precursor ion | CV (V) | 1st Transition (quantitation) | CE (eV) | 2nd Transition (confirmation) | CE (eV) | Rt (min) | Ion ratio |
|---|---|---|---|---|---|---|---|---|---|---|
| 1 | Azinphos-ethyl | 345 | (M+H)+ | 15 | 346⟶77 | 36 | 346⟶132 | 30 | 18.99 | 1.43 |
| 2 | Bromacil | 261 | (M+H)+ | 20 | 261⟶205 | 12 | 261⟶188 | 35 | 13.75 | 7.03 |
| 3 | Carbaryl | 201 | (M+H)+ | 15 | 202⟶145 | 20 | 202⟶117 | 10 | 14.61 | 3.85 |
| 4 | Carbofuran | 221 | (M+H)+ | 15 | 222⟶165 | 16 | 222⟶123 | 16 | 15 | 1.4 |
| 5 | Cartap | 237 | (M+H)+ | 27 | 238⟶73 | 16 | 238⟶150 | 16 | 2.57 | 1.75 |
| 6 | Chlorbromuron | 292 | (M+H)+ | 28 | 293⟶204 | 16 | 293⟶182 | 16 | 18.47 | 1.3 |
| 7 | Chlorfenvinphos | 358 | (M+H)+ | 28 | 359⟶99 | 28 | 359⟶155 | 17 | 21.05 | 2.11 |
| 8 | Chlorpyrifos | 350 | (M+H)+ | 30 | 350⟶97 | 25 | 350⟶198 | 22 | 25.24 | 2.08 |
| 9 | Cinosulfuron | 413 | (M+H)+ | 16 | 414⟶183 | 15 | 414⟶157 | 15 | 7.06 | 17.9 |
| 10 | Coumaphos | 362 | (M+H)+ | 35 | 363⟶307 | 17 | 363⟶289 | 25 | 20.95 | 3.23 |
| 11 | Dialifos | 393 | (M+H)+ | 20 | 394⟶187 | 10 | 394⟶208 | 15 | 22.77 | 1.12 |
| 12 | Diazinon | 304 | (M+H)+ | 29 | 305⟶97 | 35 | 305⟶169 | 20 | 21.92 | 1.88 |
| 13 | Dicrotophos | 237 | (M+H)+ | 26 | 238⟶112 | 10 | 238⟶193 | 10 | 4.32 | 3.34 |
| 14 | Edifenphos | 310 | (M+H)+ | 30 | 311⟶109 | 32 | 311⟶111 | 26 | 20.5 | 4.85 |
| 15 | Etrimfos | 292 | (M+H)+ | 35 | 293⟶125 | 25 | 293⟶265 | 18 | 21.67 | 2.66 |
| 16 | Fluometuron | 232 | (M+H)+ | 30 | 233⟶72 | 18 | 233⟶46 | 20 | 15.33 | 4.87 |
| 17 | Fuberidazole | 184 | (M+H)+ | 42 | 185⟶157 | 25 | 185⟶156 | 32 | 12.21 | 2.24 |
| 18 | Iprobenfos | 288 | (M+H)+ | 20 | 289⟶91 | 18 | 289⟶205 | 14 | 20.19 | 6.68 |
| 19 | Malathion | 330 | (M+H)+ | 18 | 331⟶127 | 12 | 331⟶99 | 20 | 18.43 | 1.44 |
| 20 | Methabenzthiazuron | 221 | (M+H)+ | 28 | 222⟶165 | 20 | 222⟶150 | 30 | 15.53 | 2.16 |
| 21 | Methidathion | 302 | (M+H)+ | 18 | 303⟶145 | 20 | 303⟶85 | 10 | 16.93 | 1.23 |
| 22 | Monocrotophos | 223 | (M+H)+ | 26 | 224⟶127 | 18 | 224⟶98 | 14 | 3.73 | 2.25 |
| 23 | Omethoate | 213 | (M+H)+ | 20 | 214⟶125 | 18 | 214⟶183 | 15 | 3.1 | 4.35 |
| 24 | Oxadiazon | 344 | (M+H)+ | 30 | 345⟶220 | 13 | 345⟶177 | 40 | 24.27 | 1.49 |
| 25 | Oxydemeton-methyl | 246 | (M+H)+ | 20 | 247 ⟶109 | 25 | 247 ⟶169 | 14 | 3.26 | 1.28 |
| 26 | Phosphamidon | 299 | (M+H)+ | 26 | 300⟶127 | 20 | 300⟶174 | 10 | 12.47 | 2.71 |
| 27 | Phoxim | 298 | (M+H)+ | 16 | 299⟶129 | 13 | 299⟶153 | 11 | 21.46 | 5.91 |
| 28 | Primiphos-methyl | 305 | (M+H)+ | 30 | 306⟶108 | 28 | 306⟶164 | 17 | 22.44 | 4.76 |
| 29 | Propiconazole | 341 | (M+H)+ | 40 | 342⟶159 | 30 | 342⟶69 | 16 | 21.26 | 1.04 |
| 30 | Propoxur | 209 | (M+H)+ | 20 | 210⟶111 | 14 | 210⟶168 | 8 | 13.93 | 3.23 |
| 31 | Pyrazophos | 373 | (M+H)+ | 36 | 374⟶222 | 30 | 374⟶194 | 21 | 22.13 | 1.3 |
| 32 | Spinosyn A | 732 | (M+H)+ | 53 | 733⟶142 | 30 | 733⟶98 | 56 | 26.65 | 3.72 |
| 33 | Spinosyn D | 746 | (M+H)+ | 50 | 747⟶142 | 31 | 747⟶98 | 51 | 27.44 | 4.36 |
| 34 | TCMTB | 238 | (M+H)+ | 21 | 239⟶180 | 10 | 239⟶136 | 40 | 18.1 | 3.6 |
| 35 | Thiobencarb | 257 | (M+H)+ | 18 | 258⟶125 | 20 | 258⟶100 | 13 | 22.57 | 7.66 |
| 36 | Thiophanate-methyl | 342 | (M+H)+ | 24 | 343⟶151 | 22 | 343⟶311 | 12 | 13.51 | 6.06 |
| 37 | Triadimenol | 295 | (M+H)+ | 20 | 296⟶70 | 8 | 296⟶99 | 15 | 19.66 | 7.43 |
| 38 | Tri-allate | 303 | (M+H)+ | 32 | 304⟶86 | 20 | 304⟶143 | 24 | 25.34 | 1.08 |
| 39 | Triazophos | 313 | (M+H)+ | 31 | 314⟶162 | 18 | 314⟶119 | 32 | 18.85 | 1.8 |
| 40 | Tricyclazole | 189 | (M+H)+ | 38 | 190⟶136 | 27 | 190⟶163 | 22 | 10.4 | 1.41 |
| 41 | Triflumizole | 345 | (M+H)+ | 10 | 346⟶278 | 8 | 346⟶73 | 25 | 23.17 | 2.36 |
| 42 | Triphenylphosphate* | 326 | (M+H)+ | 20 | 327⟶77 | 45 | 327⟶152 | 45 | 20.81 | 1.94 |
Names, molar masses, MRM parameters, ion ratios and retention times of the studied pesticides for LC-MS/MS analysis
| NO. | Compound | 0.025 mg/kg | 0.250 mg/kg | 1.000 mg/kg | LOQ | LOD | |||
|---|---|---|---|---|---|---|---|---|---|
| Mean | RSDr | Mean | RSDr | Mean | RSDr | ||||
| 1 | Azinphos-ethyl | 90 | 4 | 85 | 8 | 81 | 2 | 0.015 | 0.005 |
| 2 | Bromacil | 104 | 5 | 79 | 5 | 81 | 8 | 0.016 | 0.005 |
| 3 | Carbaryl | 96 | 5 | 84 | 8 | 81 | 3 | 0.009 | 0.003 |
| 4 | Carbofuran | 81 | 8 | 82 | 7 | 84 | 9 | 0.012 | 0.004 |
| 5 | Cartap | 92 | 18 | 101 | 16 | 99 | 9 | 0.015 | 0.005 |
| 6 | Chlorbromuron | 88 | 15 | 84 | 7 | 95 | 6 | 0.016 | 0.005 |
| 7 | Chlorfenvinphos | 83 | 2 | 96 | 11 | 94 | 9 | 0.018 | 0.006 |
| 8 | Chlorpyrifos | 111 | 2 | 81 | 7 | 82 | 10 | 0.019 | 0.006 |
| 9 | Cinosulfuron | 86 | 7 | 91 | 18 | 91 | 7 | 0.013 | 0.004 |
| 10 | Coumaphos | 98 | 10 | 105 | 11 | 87 | 5 | 0.019 | 0.006 |
| 11 | Dialifos | 116 | 3 | 103 | 9 | 87 | 9 | 0.014 | 0.005 |
| 12 | Diazinon | 109 | 1 | 98 | 4 | 101 | 11 | 0.016 | 0.005 |
| 13 | Dicrotophos | 94 | 13 | 92 | 11 | 98 | 8 | 0.013 | 0.004 |
| 14 | Edifenphos | 72 | 3 | 95 | 10 | 89 | 8 | 0.014 | 0.005 |
| 15 | Etrimfos | 103 | 3 | 92 | 8 | 96 | 7 | 0.016 | 0.005 |
| 16 | Fluometuron | 77 | 3 | 94 | 10 | 97 | 6 | 0.012 | 0.004 |
| 17 | Fuberidazole | 109 | 6 | 85 | 12 | 79 | 9 | 0.017 | 0.006 |
| 18 | Iprobenfos | 92 | 5 | 95 | 10 | 96 | 10 | 0.012 | 0.004 |
| 19 | Malathion | 90 | 4 | 90 | 16 | 94 | 9 | 0.013 | 0.004 |
| 20 | Methabenzthiazuron | 99 | 8 | 81 | 6 | 77 | 6 | 0.014 | 0.005 |
| 21 | Methidathion | 110 | 5 | 98 | 10 | 93 | 7 | 0.019 | 0.006 |
| 22 | Monocrotophos | 79 | 16 | 101 | 5 | 103 | 6 | 0.014 | 0.005 |
| 23 | Omethoate | 100 | 14 | 93 | 12 | 98 | 10 | 0.014 | 0.005 |
| 24 | Oxadiazon | 100 | 3 | 100 | 6 | 94 | 10 | 0.014 | 0.005 |
| 25 | Oxydemeton-methyl | 88 | 18 | 110 | 7 | 115 | 5 | 0.014 | 0.005 |
| 26 | Phosphamidon | 103 | 6 | 77 | 8 | 87 | 10 | 0.015 | 0.005 |
| 27 | Phoxim | 78 | 12 | 102 | 14 | 100 | 6 | 0.014 | 0.005 |
| 28 | Primiphos-methyl | 117 | 3 | 96 | 3 | 101 | 8 | 0.020 | 0.007 |
| 29 | Propiconazole | 107 | 3 | 87 | 6 | 89 | 12 | 0.012 | 0.004 |
| 30 | Propoxur | 75 | 7 | 86 | 18 | 83 | 12 | 0.017 | 0.006 |
| 31 | Pyrazophos | 108 | 2 | 92 | 9 | 90 | 3 | 0.010 | 0.003 |
| 32 | Spinosyn A | 102 | 9 | 94 | 17 | 100 | 18 | 0.014 | 0.005 |
| 33 | Spinosyn D | 84 | 13 | 92 | 12 | 95 | 7 | 0.016 | 0.005 |
| 34 | TCMTB | 104 | 4 | 81 | 13 | 84 | 13 | 0.014 | 0.005 |
| 35 | Thiobencarb | 104 | 4 | 100 | 10 | 95 | 8 | 0.015 | 0.005 |
| 36 | Thiophanate-methyl | 81 | 6 | 110 | 12 | 92 | 14 | 0.016 | 0.005 |
| 37 | Triadimenol | 78 | 1 | 76 | 8 | 94 | 7 | 0.012 | 0.004 |
| 38 | Triallate | 75 | 5 | 80 | 14 | 78 | 5 | 0.013 | 0.004 |
| 39 | Triazophos | 98 | 9 | 81 | 15 | 81 | 9 | 0.011 | 0.004 |
| 40 | Tricyclazole | 89 | 4 | 82 | 15 | 79 | 10 | 0.016 | 0.005 |
| 41 | Triflumizole | 79 | 12 | 84 | 13 | 95 | 12 | 0.010 | 0.003 |
Mean recoveries (%) and relative standard deviations, RSDr (%), LOQs and LODs (mg/kg) obtained for 41 compounds in rice samples, spiked at 0.025, 0.250 and 1.000 mg/kg levels (n = 5)
| No. | Compounds | Unprocessed samples | Washing | Cooking | ||||
|---|---|---|---|---|---|---|---|---|
| Concentration (mg/kg) | Concentration (mg/kg) | PF | Reduction | Concentration (mg/kg) | PF | Reduction | ||
| 1 | Azinphos-ethyl | 0.880 ( ± 0.071 ) | 0.755 ( ± 0.044 )* | 0.86 | 14.2 | 0.096 ( ± 0.034 ) | 0.11 | 89.1 |
| 2 | Bromacil | 0.961 ( ± 0.029 ) | 0.649 ( ± 0.094 ) | 0.68 | 32.5 | 0.179 ( ± 0.016 ) | 0.19 | 81.4 |
| 3 | Carbaryl | 0.880 ( ± 0.031 ) | 0.668 ( ± 0.069 ) | 0.76 | 24.1 | 0.195 ( ± 0.018) | 0.22 | 77.9 |
| 4 | Carbofuran | 0.905 ( ± 0.086 ) | 0.878 ( ± 0.058 )* | 0.97 | 3.0 | 0.505 ( ± 0.081 ) | 0.56 | 44.2 |
| 5 | Cartap | 0.842 ( ± 0.034 ) | 0.540 ( ± 0.016 ) | 0.64 | 35.8 | 0.020 ( ± 0.064 ) | 0.02 | 97.6 |
| 6 | Chlorbromuron | 0.982 ( ± 0.017 ) | 0.603 ( ± 0.076 ) | 0.61 | 38.6 | 0.498 ( ± 0.083 ) | 0.51 | 49.2 |
| 7 | Chlorfenvinphos | 0.983 ( ± 0.047 ) | 0.637 ( ± 0.088 ) | 0.65 | 35.2 | 0.286 ( ± 0.048 ) | 0.29 | 71.0 |
| 8 | Chlorpyrifos | 0.855 ( ± 0.078 ) | 0.409 ( ± 0.038 ) | 0.48 | 52.2 | 0.163 ( ± 0.018 ) | 0.19 | 80.9 |
| 9 | Cinosulfuron | 0.904 ( ± 0.088 ) | 0.871 ( ± 0.061 )* | 0.96 | 3.6 | 0.669 ( ± 0.031 ) | 0.74 | 26.0 |
| 10 | Coumaphos | 0.897 ( ± 0.030 ) | 0.837 ( ± 0.108 )* | 0.93 | 6.7 | 0.711 ( ± 0.074 ) | 0.79 | 20.7 |
| 11 | Dialifos | 0.909 ( ± 0.049 ) | 0.551 ( ± 0.071 ) | 0.61 | 39.4 | 0.385 ( ± 0.039 ) | 0.42 | 57.6 |
| 12 | Diazinon | 0.982 ( ± 0.0.25 ) | 0.492 ( ± 0.060 ) | 0.50 | 49.9 | 0.557 ( ± 0.069 ) | 0.57 | 43.3 |
| 13 | Dicrotophos | 0.956 ( ± 0.062 ) | 0.242 ( ± 0.083 ) | 0.25 | 74.7 | 0.349 ( ± 0.038 ) | 0.37 | 63.5 |
| 14 | Edifenphos | 0.921 ( ± 0.078 ) | 0.648 ( ± 0.073 ) | 0.70 | 29.7 | 0.730 ( ± 0.045 ) | 0.79 | 20.7 |
| 15 | Etrimfos | 0.996 ( ± 0.017 ) | 0.957 ( ± 0.023 )* | 0.96 | 3.9 | 0.499 ( ± 0.093 ) | 0.50 | 49.9 |
| 16 | Fluometuron | 0.903 ( ± 0.109 ) | 0.837 ( ± 0.050 )* | 0.93 | 7.3 | 0.205 ( ± 0.084 ) | 0.23 | 77.3 |
| 17 | Fuberidazole | 0.890 ( ± 0.107 ) | 0.194 ( ± 0.075 ) | 0.22 | 78.2 | 0.119 ( ± 0.067 ) | 0.13 | 86.7 |
| 18 | Iprobenfos | 0.806 ( ± 0.042 ) | 0.476 ( ± 0.047 ) | 0.59 | 41.0 | 0.408 ( ± 0.091 ) | 0.51 | 49.3 |
| 19 | Malathion | 0.982 ( ± 0.031 ) | 0.864 ( ± 0.010 ) | 0.88 | 12.0 | 0.260 ( ± 0.004 ) | 0.26 | 73.6 |
| 20 | Methabenzthiazuron | 0.926 ( ± 0.082 ) | 0.468 ( ± 0.086 ) | 0.51 | 49.5 | 0.331 ( ± 0.087 ) | 0.36 | 64.3 |
| 21 | Methidathion | 0.958 ( ± 0.065 ) | 0.641 ( ± 0.067 ) | 0.67 | 33.1 | 0.242 ( ± 0.047 ) | 0.25 | 74.7 |
| 22 | Monocrotophos | 0.767 ( ± 0.024 ) | 0.562 ( ± 0.091 ) | 0.73 | 26.7 | 0.350 ( ± 0.027 ) | 0.46 | 54.4 |
| 23 | Omethoate | 0.783 ( ± 0.098 ) | 0.284 ( ± 0.048 ) | 0.36 | 63.7 | 0.339 ( ± 0.029 ) | 0.43 | 56.7 |
| 24 | Oxadiazon | 0.979 ( ± 0.089 ) | 0.117 ( ± 0.115 ) | 0.12 | 88.1 | 0.216 ( ± 0.060 ) | 0.22 | 77.9 |
| 25 | Oxydemeton-methyl | 0.793 ( ± 0.035 ) | 0.183 ( ± 0.061 ) | 0.23 | 76.9 | <LOQ | 0.00 | 99.0 |
| 26 | Phosphamidon | 0.911 ( ± 0.035 ) | 0.677 ( ± 0.082 ) | 0.74 | 25.7 | 0.474 ( ± 0.053 ) | 0.52 | 48.0 |
| 27 | Phoxim | 1.012 ( ± 0.074 ) | 0.615 ( ± 0.030 ) | 0.61 | 39.2 | 0.722 ( ± 0.034 ) | 0.71 | 28.6 |
| 28 | Primiphos-methyl | 1.019 ( ± 0.109 ) | 0.793 ( ± 0.097 )* | 0.78 | 22.1 | 0.139 ( ± 0.056 ) | 0.14 | 86.4 |
| 29 | Propiconazole | 0.935 ( ± 0.092 ) | 0.064 ( ± 0.041 ) | 0.07 | 87.1 | 0.432 ( ± 0.096 ) | 0.46 | 53.8 |
| 30 | Propoxur | 0.885 ( ± 0.021 ) | 0.586 ( ± 0.092 ) | 0.66 | 33.7 | 0.202 ( ± 0.009 ) | 0.23 | 77.2 |
| 31 | Pyrazophos | 0.910 ( ± 0.014 ) | 0.416 ( ± 0.007 ) | 0.46 | 54.3 | 0.502 ( ± 0.036 ) | 0.55 | 44.8 |
| 32 | Spinosyn A | 1.110 ( ± 0.057 ) | 0.586 ( ± 0.043 ) | 0.53 | 47.2 | 0.344 ( ± 0.070 ) | 0.31 | 69.0 |
| 33 | Spinosyn D | 0.975 ( ± 0.064 ) | 0.413 ( ± 0.103 ) | 0.42 | 57.6 | 0.226 ( ± 0.087 ) | 0.23 | 76.9 |
| 34 | TCMTB | 0.905 ( ± 0.007 ) | 0.213 ( ± 0.021 ) | 0.24 | 76.5 | 0.067 ( ± 0.041 ) | 0.07 | 92.6 |
| 35 | Thiobencarb | 0.990 ( ± 0.042 ) | 0.300 ( ± 0.002 ) | 0.30 | 69.7 | 0.505 ( ± 0.036 ) | 0.51 | 49.0 |
| 36 | Thiophanate-methyl | 1.000 ( ± 0.028 ) | 0.241 ( ± 0.024 ) | 0.24 | 75.9 | 0.299 ( ± 0.057) | 0.30 | 70.1 |
| 37 | Triadimenol | 0.912 ( ± 0.054 ) | 0.462 ( ± 0.036 ) | 0.51 | 49.3 | 0.258 ( ± 0.061 ) | 0.28 | 71.7 |
| 38 | Triallate | 0.800 ( ± 0.028 ) | 0.491 ( ± 0.096 ) | 0.61 | 38.6 | 0.279 ( ± 0.013 ) | 0.35 | 65.1 |
| 39 | Triazophos | 0.850 ( ± 0.014 ) | 0.223 ( ± 0.005 ) | 0.26 | 73.8 | 0.359 ( ± 0.090 ) | 0.42 | 57.8 |
| 40 | Tricyclazole | 0.835 ( ± 0.021 ) | 0.229 ( ± 0.044 ) | 0.27 | 60.6 | 0.409 ( ± 0.041 ) | 0.49 | 51.1 |
| 41 | Triflumizole | 1.001 ( ± 0.028 ) | 0.357 ( ± 0.040 ) | 0.36 | 64.3 | 0.484 ( ± 0.093 ) | 0.48 | 51.6 |
Mean concentrations (± SD, n = 3), mean values of processing factors (PF) and reductions (%) of the pesticides in unprocessed rice samples, after washing and cooking
| No. | Compound | Molecular formula | Chemical group | Pesticide type | Melting Point (°C) | log P (octanol-water) | Water solubility (mg L-1) at 25 °C | Vapour Pressure (Pa) at 25 °C |
|---|---|---|---|---|---|---|---|---|
| 1 | Azinphos-ethylb | C12H16N3O3PS2 | Organophosphate | Insecticide, Acaricide | 53 | 3.4 | 10.5 | 1.80E-08 |
| 2 | Bromacilb | C9H13BrN2O2 | Uracil | Herbicide | 158 | 2.11 | 815 | 2.30E-09 |
| 3 | Carbaryla | C12H11NO2 | Carbamate | Insecticide, Plant growth regulator | 145 | 2.36 | 110 | 1.02E-08 |
| 4 | Carbofuranb | C12H15NO3 | Carbamate | Insecticide, Nematicide, Acaricide, Metabolite | 151 | 2.32 | 320 | 3.64E-08 |
| 5 | Cartapa | C7H15N3O2S2 | Unclassified | Insecticide | 131 | -0.95 | 2.0 E 05 | 7.50E-13 |
| 6 | Chlorbromuronb | C9H10BrClN2O2 | Urea | Herbicide | 96 | 3.09 | 35 | 2.98E-09 |
| 7 | Chlorfenvinphosb | C12H14Cl3O4P | Organophosphate | Insecticide, Acaricide, Veterinary treatment | -20 | 3.81 | 124 | 5.63E-08 |
| 8 | Chlorpyrifosa | C9H11Cl3NO3PS | Organophosphate | Insecticide | 42 | 4.96 | 1.12 | 1.52E-07 |
| 9 | Cinosulfurona | C15H19N5O7S | Sulfonylurea | Herbicide | 130 | 2.04 | 120 | 5.19E-15 |
| 10 | Coumaphosb | C14H16ClO5PS | Organothiophosphates | Insecticide, Miticide | 93 | 4.13 | 1.5 | 7.28E-10 |
| 11 | Dialifosb | C14H17ClNO4PS2 | Organophosphate | Insecticide, Acaricide | 68 | 4.69 | 0.18 | 4.65E-10 |
| 12 | Diazinona | C12H21N2O3PS | Organophosphate | Insecticide, Acaricide, Repellent, Veterinary treatment | < 25 | 3.81 | 40 | 6.76E-07 |
| 13 | Dicrotophosb | C8H16NO5P | Organophosphate | Insecticide | < 25 | -0.49 | 1.00E+06 | 1.20E-06 |
| 14 | Edifenphosa | C14H15O2PS2 | Organophosphate | Fungicide | < 25 | 3.48 | 56 | 2.03E-09 |
| 15 | Etrimfosb | C10H17N2OPS | Organophosphate | Insecticide | -3.35 | 2.94 | 40 | 6.00E-07 |
| 16 | Fluometuronb | C10H11F3N2O | Phenylurea | Herbicide | 164 | 2.42 | 110 | 7.04E-09 |
| 17 | Fuberidazoleb | C11H8N2O | Benzimidazole | Fungicide | 292 | 2.67 | 71 | 5.06E-11 |
| 18 | Iprobenfosb | C13H21O3PS | Organophosphate | Fungicide | < 25 | 3.34 | 400 | 3.04E-07 |
| 19 | Malathiona | C10H19O6PS2 | Organophosphate | Insecticide, Acaricide, Veterinary treatment | 2.8 | 2.36 | 143 | 2.54E-08 |
| 20 | Methabenzthiazuronb | C10H11N3OS | Urea | Herbicide | 120 | 2.64 | 59 | 8.48E-10 |
| 21 | Methidathionb | C6H11N2O4PS3 | Organophosphate | Insecticide, Acaricide | 39 | 2.2 | 187 | 2.53E-08 |
| 22 | Monocrotophosb | C7H14NO5P | Organophosphate | Insecticide, Acaricide | 55 | -0.2 | 8.18+05 | 1.64E-08 |
| 23 | Omethoateb | C5H12NO4PS | Organophosphate | Insecticide, Acaricide, Metabolite | -28 | -0.74 | 1.00E+06 | 1.86E-07 |
| 24 | Oxadiazona | C15H18Cl2N2O3 | Oxidiazole | Herbicide | 90 | 4.8 | 0.7 | 8.40E-10 |
| 25 | Oxydemeton-methyla | C6H15O4PS2 | Organophosphate | Insecticide | -20 | -0.74 | 1.00E+06 | 2.14E-07 |
| 26 | Phosphamidonb | C10H19ClNO5P | Organophosphate | Insecticide, Acaricide | -45 | 0.79 | 1.00E+06 | 1.24E-07 |
| 27 | Phoximb | C12H15N2O3PS | Organophosphate | Insecticide, Disinfectant | 6.1 | 4.39 | 4.1 | 1.19E-07 |
| 28 | Pirimiphos-methyla | C11H20N3O3PS | Organophosphate | Insecticide, Acaricide | 15 | 4.2 | 8.6 | 1.13E-07 |
| 29 | Propiconazolea | C15H17Cl2N3O2 | Triazole | Fungicide | < 25 | 3.72 | 110 | 7.50E-09 |
| 30 | Propoxurb | C11H15NO3 | Carbamate | Insecticide, Acaricide, Veterinary treatment | 87 | 1.52 | 1860 | 7.26E-08 |
| 31 | Pyrazophosb | C14H20N3O5PS | Phosphorothiolate | Fungicide | 51 | 3.8 | 4.2 | 7.35E-10 |
| 32 | Spinosyn Aa | C41H65NO10 | Micro-organism derived | Insecticide, Veterinary treatment | 84-99.5 | 4 | 235 | 3.00E-05 |
| 33 | Spinosyn Da | C42H67NO10 | Micro-organism derived | Insecticide, Veterinarytreatment | 161.5-170 | 4.5 | 0.33 | 2.00E-05 |
| 34 | TCMTBb | C9H6N2S3 | Mercaptobenzothiazole | Fungicide, Microbiocide, Wood preservative | Liquid | 3.3 | 125 | 2.34E-09 |
| 35 | Thiobencarba | C12H16ClNOS | Thiocarbamate | Herbicide | 3.3 | 3.4 | 28 | 1.65E-07 |
| 36 | Thiophanate-methyla | C12H14N4O4S2 | Benzimidazole | Fungicide | 172 | 1.4 | 26.6 | 5.35E-10 |
| 37 | Triadimenola | C14H18ClN3O2 | Triazole | Fungicide | 124 | 2.9 | 120 | 2.33E-12 |
| 38 | Triallatec | C10H16Cl3NOS | Thiocarbamate | Herbicide | 29 | 4.6 | 4 | 9.00E-07 |
| 39 | Triazophosb | C12H16N3O3PS | Organophosphate | Insecticide, Acaricide, Nematicide | 3.5 | 3.34 | 39 | 2.18E-08 |
| 40 | Tricyclazolea | C9H7N3S | Triazolobenzothiazole | Fungicide | 187 | 1.7 | 1600 | 1.50E-09 |
| 41 | Triflumizolea | C15H15ClF3N3O | Imidazole | Fungicide | 63.5 | 1.4 | 1.25E+04 | 1.05E-08 |
Physico-chemical properties of the pesticides studied in this investigation (according to the references 2-6).
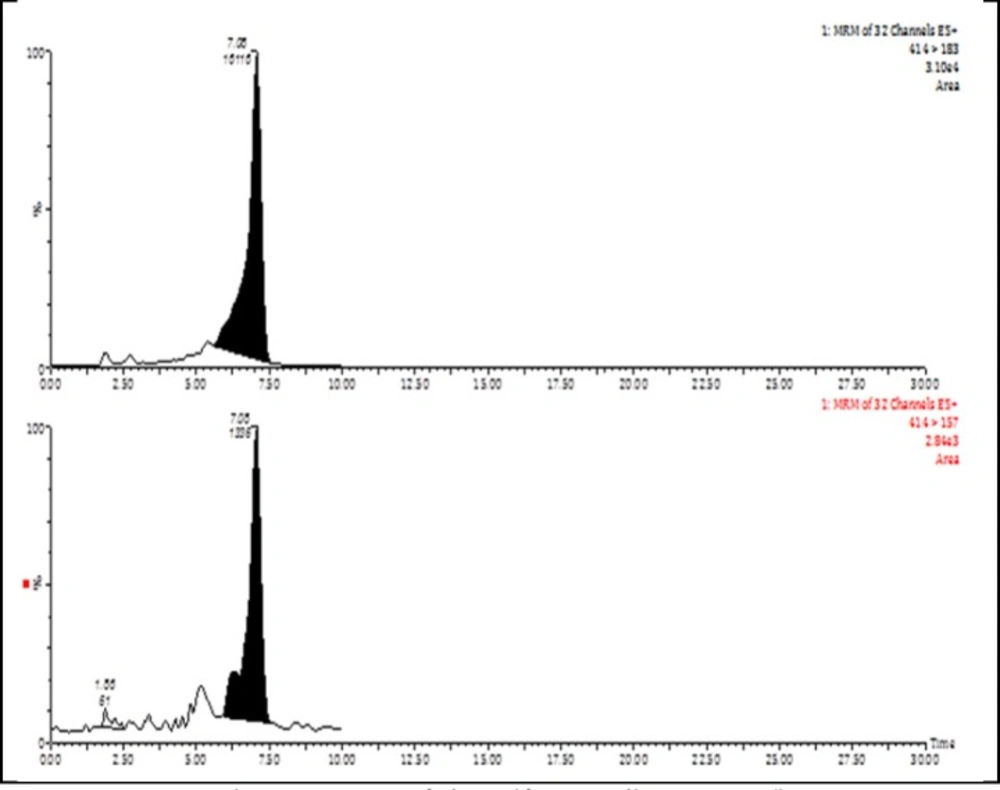
MRM Chromatograms of cinosulfuron (spike: 0.05 mg/kg

Effects of washing and cooking on pesticides residues in rice
Cooking rice in Iranian traditional method (Kateh)
Washing
A 50 g portion of the rice samples was completely washed twice with tap water and soaked in water. After 20 min, the samples were ground with dry ice and then analyzed.
Cooking
For each sample, a mixture of 50 g of the rice sample, 50 mL of water, 2 g NaCl and 4 g edible oil were placed in a container. The mixture was boiled on a stove until the water was evaporated. Then, the lid of the container was completely closed and the flame of the stove minimized and rice sample steamed for 20 min. Then, the cooked rice sample were completely crushed and analyzed.
Extraction
Extraction was performed by the original QuEChERS method (16). Five g of homogenized rice sample was accurately weighed into a 50 mL centrifuge tube. Appropriate concentrations of the mixed working standard solution (for spiking) and internal standard (TTP) were added to the tube and 10 mL of acetonitrile (MeCN) was added. The mixture was mixed using a vortex for 2.0 min, followed by addition of a mixture of 4 g anhydrous MgSO4 and 1.5 g sodium acetate and mixed using a vortex for 2.0 min again. The mixture was centrifuged for 5 min at 5433×g, and 5 mL of the supernatants then transferred into an appropriate tube placed in a nitrogen evaporator and evaporated at 40 °C until dryness. The residue was reconstituted in 0.5 mL MeCN. The mixture was mixed using a vortex for 2.0 min followed by sonication for 4.0 min and the solution was transferred to a tube containing 60 mg anhydrous MgSO4 and 20 mg primary secondary amine (PSA). The mixture was mixed using a vortex vigorously for 2 min and centrifuged for 5 min at 5433×g. Finally, a 0.4 mL aliquot of the cleaned extract was transferred into a screw cap vial and 100 μL of the solution injected into LC-MS/MS.
Liquid chromatography
The separation of the different pesticides from the samples was carried out using an Alliance separations module 2695 (Waters, Milford, MA, USA), which consist of a quaternary solvent delivery system, degasser, autosampler, column heater, and diode array detector coupled with a Quattro Micro Triple Quadrupole LC/MS (Waters, Micromass, Manchester, UK).
Chromatographic separation was performed using an Agilent ZORBAX Eclipse XDB-C18 (Narrow-Bore 2.1 × 150 mm, 3.5-micron) analytical column at a flow rate of 0.2 mL/min and an injection volume of 100 μL. The mobile phase was 5 mM ammonium formate in methanol (solvent A) and 5 mM ammonium formate in water (solvent B) in a gradient mode and a total analysis time of 30 min. The elution program was as follows: at the start 30% solvent A and 70% solvent B; the percentage of solvent A was linearly increased to 100% in 20 min, then constant for 5 min and ramped to original composition in 5 min. The temperature of the column heater was maintained at 40 °C.
Mass spectrometry
The MS/MS system consisting of a triple quadrupole mass spectrometer Quattro Micro (Waters-Micromass, UK) was equipped with an electrospray source (Z-spray) and operated in positive ionization mode. MassLynx software, version 4.0, was used for instrument control and data acquisition. Analysis was performed in positive ion mode. The ESI source values were as follow: capillary voltage: 4.12 kV; extractor: 2 V; RF lens: 0.1 V; source temperature: 120 °C; desolvation temperature: 300 °C; and desolvation gas and cone gas (nitrogen 99.99% purity) flow rates: 500 and 50 L/h, respectively. The analyzer settings were as follow: resolution: 14.6 (unit resolution) for LM1 and LM2 resolution and 14 for HM1 and HM2 resolution; ion energy 1 and 2, 0.3 and 3.0, respectively; entrance and exit energies: 55 and 75 (V); multiplier: 700 (V); and collision gas (argon, 99.995%) pressure: 5.35 × 10⁻³ mbar.
MS/MS conditions for all pesticides were conducted in the positive electrospray ionization mode using multiple reaction monitoring (MRM) with two mass transitions. The optimization of the precursor ion, product ions, cone voltage and collision energy was performed via direct injection of the individual pesticide standard solution (1 μg/mL) into the mass spectrometer using a syringe pump at flow rate 10 μL/min. The product ion with the strongest intensity was used for quantitation, while the other with the lowest intensity was employed for confirmation
(Figure 1). The optimized parameters are presented in Table 1.
Validation studies
The validation study was performed based on the European SANCO guidelines (17). Linearity was studied using matrix-matched calibration curve by analyzing in triplicate six concentration levels, between 0.02 and 1.0 mg/kg. For determination of mean recoveries and precision five spiked blank rice samples at concentration levels of 0.025, 0.250, and 1.000 mg/kg were prepared and then treated according to the procedure described in sample preparation. The limit of quantification (LOQ) was established as the lowest validated spike level meeting the method performance acceptability criteria (mean recoveries in the range 70-120%, with an RSDr ≤ 20%), and the limits of detection (LOD) estimated by a signal-noise ratio. The concentration of pesticides were determined by interpolation of the relative peak areas for each pesticide to internal standard peak area in the sample on the matrix-matched calibration curve. In order to compensate for losses during sample processing and instrumental analysis, internal standard (TPP) was used. Quality control samples were prepared using cooked rice at three concentration levels (0.025, 0.250, and 1.000 mg/kg) and validation parameters were calculated for them. All figures of merits were within the acceptable limits.
Statistical analysis
Pesticide residue reduction during processing was evaluated by calculating the processing factor (PF) according to the equation PF = Mean Cafter/Mean Cbefore, where Cafter and Cbefore are the pesticide residue levels after and before processing (18). Final Data of residue levels were presented as mean ± standard deviation (SD), which were statistically evaluated by t-test analysis with Excel software. When residues were below limit of quantification (LOQ) after processing, the PF value was set as zero.
Results and Discussion
Method validation
Calibration curves were obtained by analyzing in triplicate six concentration levels, between 0.01 and 1.25 mg/kg. The range of coefficient of determinations (r2) was between 0.993 and 0.999. As shown in Table 2, mean recoveries ranged from 71-119% with satisfactory precision (RSDr < 20%). The limits of quantification (LOQ) and the limits of detection (LOD) ranged between 0.010-0.025 mg/kg and 0.003-0.008 mg/kg, respectively.
Unprocessed rice samples
For calculating the amount of pesticide reduction during the washing and cooking processes, it is necessary to determine the concentration of pesticides in unprocessed rice samples. All mean concentrations (three replicate) of the studied compounds in control raw samples and after washing and cooking are shown in Table 3. The mean concentration of the studied pesticides was in the range of 0.767-1.110 mg/kg. The obtained results are in accordance with OECD guideline (>0.1 m/kg), so that various processing factors can be determined (18).
Effects of washing
Washing is the most common form and generally the first step in household food processing. This study showed that washing removed different portions of pesticide residues. As shown in Table 3 and Figure 2, washing process removed the residues of 34 pesticides in the range between 12.0-88%, whereas azinphos-ethyl (organophosphate), carbofuran (carbamate), cinosulfuron (sulfonylurea), coumaphos (organothiophosphate), etrimfos (organophosphate), fluometuron (phenylurea), and primiphos-methyl (phosphorothioate) did not significantly get removed by washing. The most reduction occurred in oxadiazon (88.1%) and propiconazole (87.1%) that chemically belong to oxidiazole and triazole groups, respectively. On the other hand, the least removal occurred in the levels of malathion (12%), carbaryl (24.1%), and phosphamidon (25.7%). Our findings indicated that there was no correlation between chemical structure and the levels of residue removed by washing. For example in organophosphate group, the residues of etrimfos was not significantly decreased, while phoxim, omethoate, and oxydemeton-methyl were decreased 39.2% and 63.7%, and 76.9%, respectively. Therefore, we suggest that the loosely attached pesticides at surface of rice matrix were easily removed by washing. Our findings are consistent with previous studies. Angel Yang et al. (19), Chavarri et al. (20), and Kaushik et al. (21) suggested that the loosely attached residues were simply washed and removed from the surface of polluted food samples. We also found that there is no correlation between water solubility and residue removed by washing. For example, the residues of oxadiazon and spinosyn D with water solubility 0.70 and 0.33 g/mL were decreased 88.1% and 57.6%, respectively, while the reduction of phosphamidon and monocrotophos with water solubility 1.00E+06 and 8.18+05 g/mL was 25.7% and 26.7%, respectively (Tables 3 and 4). Previously, Cabras et al. (22, 23) and Walter et al. (24) indicated that water solubility is not a principal agent for removing pesticide residues by washing. Kaddus Miah et al. demonstrated that rice has high capacity for absorbing water during soaking (25). In this study, rice samples were soaked in contaminated water with different pesticides. Therefore, we propose that some very soluble pesticides such as phosphamidon and monocrotophos deeply penetrate to rice seeds and washing process cannot completely remove the residues.
Effects of cooking
As shown in Table 3, the amounts of the pesticide residues decreased in range 20.7-100%. Oxydemeton-methyl (organophosphate) completely was removed (<LOQ) and the lowest removal occurred for coumaphos (organothiophosphate) and edifenphos (organophosphate). The residue reductions were not associated with the chemical group which the pesticide belong to. For example, in organophosphate group the concentration of edifenphos, diazinon, dicrotophos, and oxydemeton-methyl was decreased 20.7%, 43.3% 63.5%, and 100%, respectively. This controversial reduction was observed in other groups such as carbamates. Cooking rice in Iranian method (Kateh) consists of two principal steps; boiling and steam cooking. During boiling, the system is open and the temperature of system rises to 100 °C. During steam cooking, the lid of container is tightly closed and cooking is completed under pressure and high temperature. Under these conditions, volatilization, hydrolysis, and thermal degradation may reduce pesticide residues. Our findings are consistent with previous studies (27, 28). Briefly, our results indicated that the removal of pesticide residues in this study was associated with both physicochemical properties of pesticides and cooking conditions.
Conclusion
Pesticide residue in various commodities including rice is a major challenge in food safety. Rice is cooked in different methods all around the world and this study confirmed that Iranian home cooking processes reduced residue levels in contaminated rice. Washing and cooking removed different portions of pesticide residues in the range between 12.0-88.1% and 20.7-100%, respectively. The residue reductions were not correlated with chemical structure or water solubility of the pesticides but intensity of pesticide bindings to rice matrix, volatilization, hydrolysis, and thermal degradation determined the amounts of residues removed. In conclusion, proper home processing of rice before eating can result to reduction of intake of pesticide residues through rice consumption.
