
Introduction
Experimental
Results
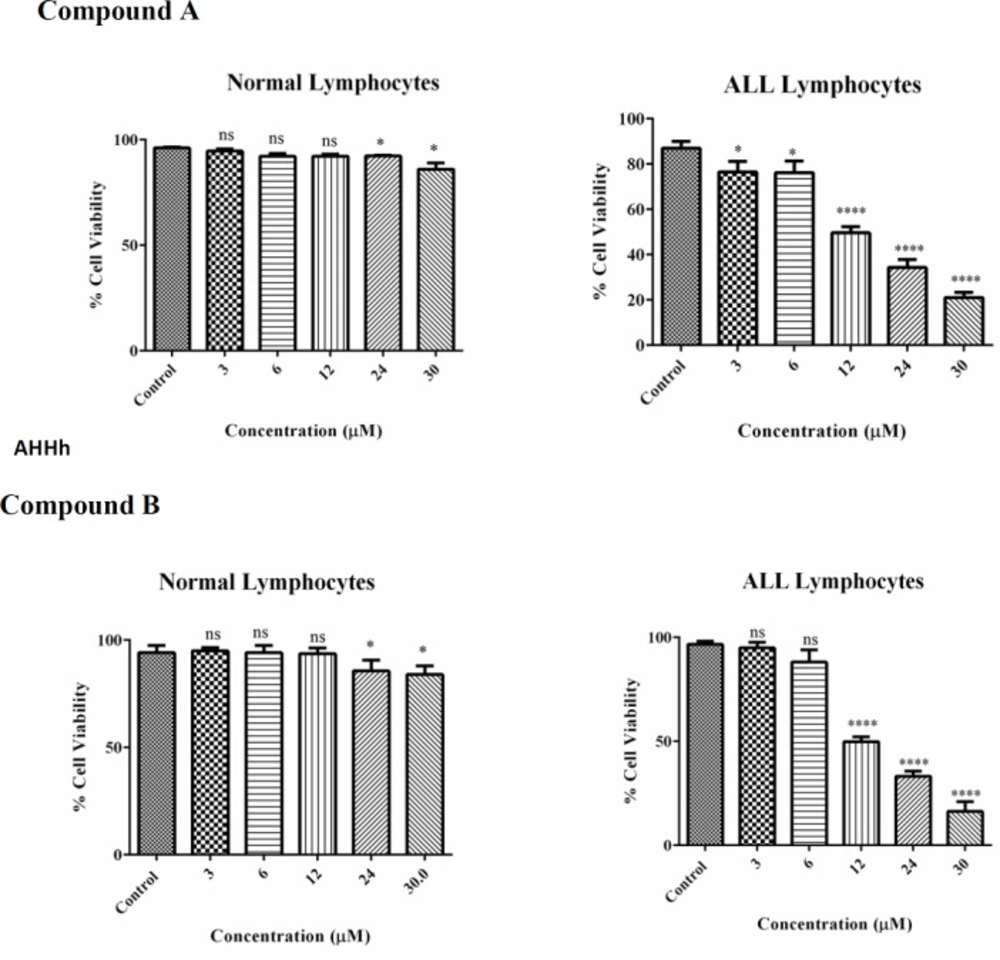
Cell viability, B-lymphocytes from ALL and healthy donors, at 1 × 10⁶ cells/well, were seeded on 96-well plates. Colchicine derivatives (A and B) at 3, 6, 12, 24 and 30 μM concentrations were incubated for 12 h.
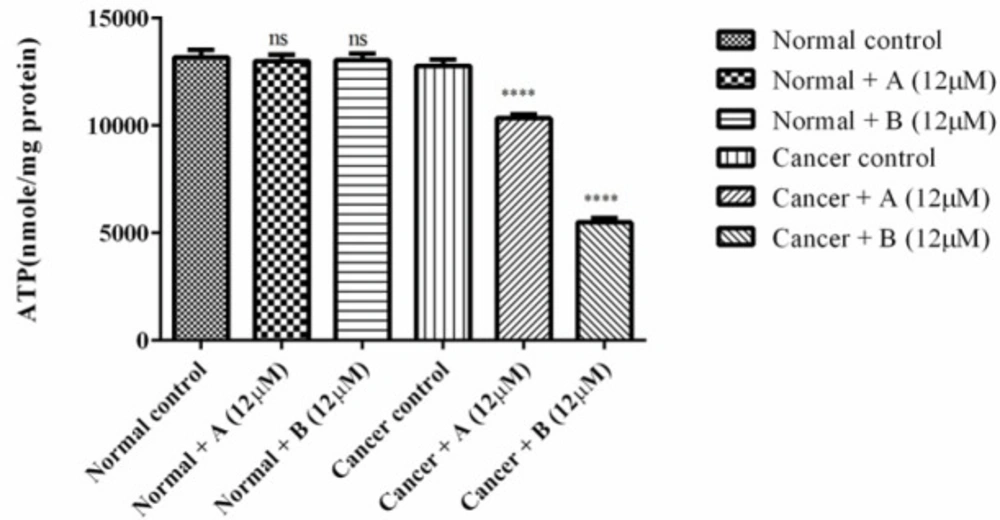
The effect of colchicine derivatives (A and B) on ATP content in both ALL and healthy B-lymphocytes. ATP was measured luminometrically based on luciferin–luciferase bioluminescence reaction. Columns represent ATP (nmol/mg protein) in ALL and healthy B-lymphocytes treated with colchicine derivativesfor 6 h. Values (mean ± S.D.) are from three independent experiments (n = 6) ****p < 0.0001
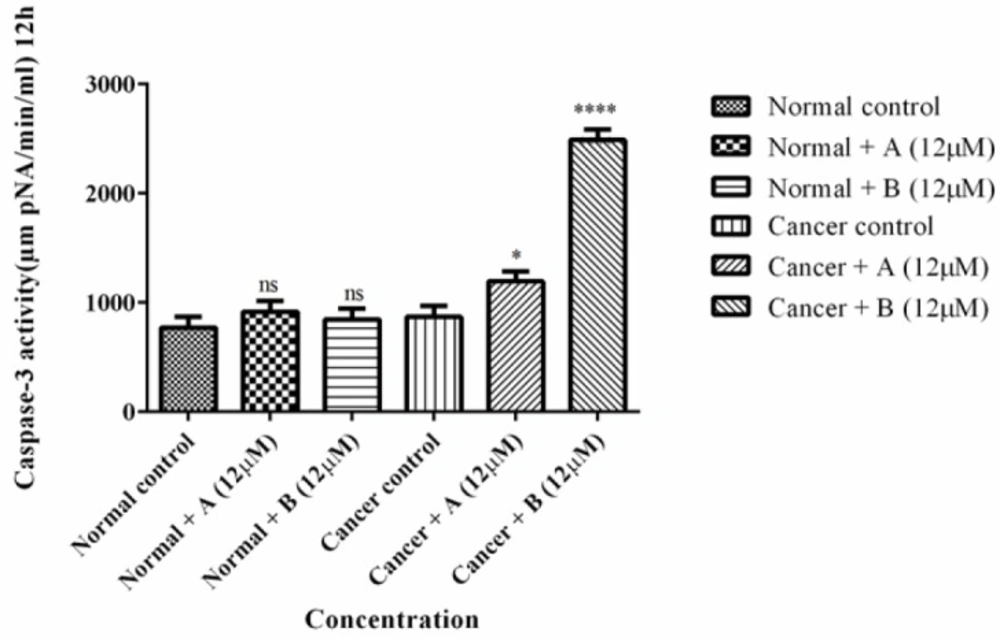
The effect of Colchicine derivatives (A and B) on caspase-3 activity in both ALL and healthy B-lymphocytes. ALL and healthy B-lymphocytes (106 Cells/mL) were incubated in RPMI 1640 medium in conventional condition (37 °C and 5% CO2-air) following the addition of Colchicine derivatives (A and B). Caspase-3 activity was determined by Sigma-Aldrich kit. Columns represent caspse-3 activity (µM pNA/min/mL) in ALL and healthy B-lymphocytes treated with colchicine derivativesfor 6 h
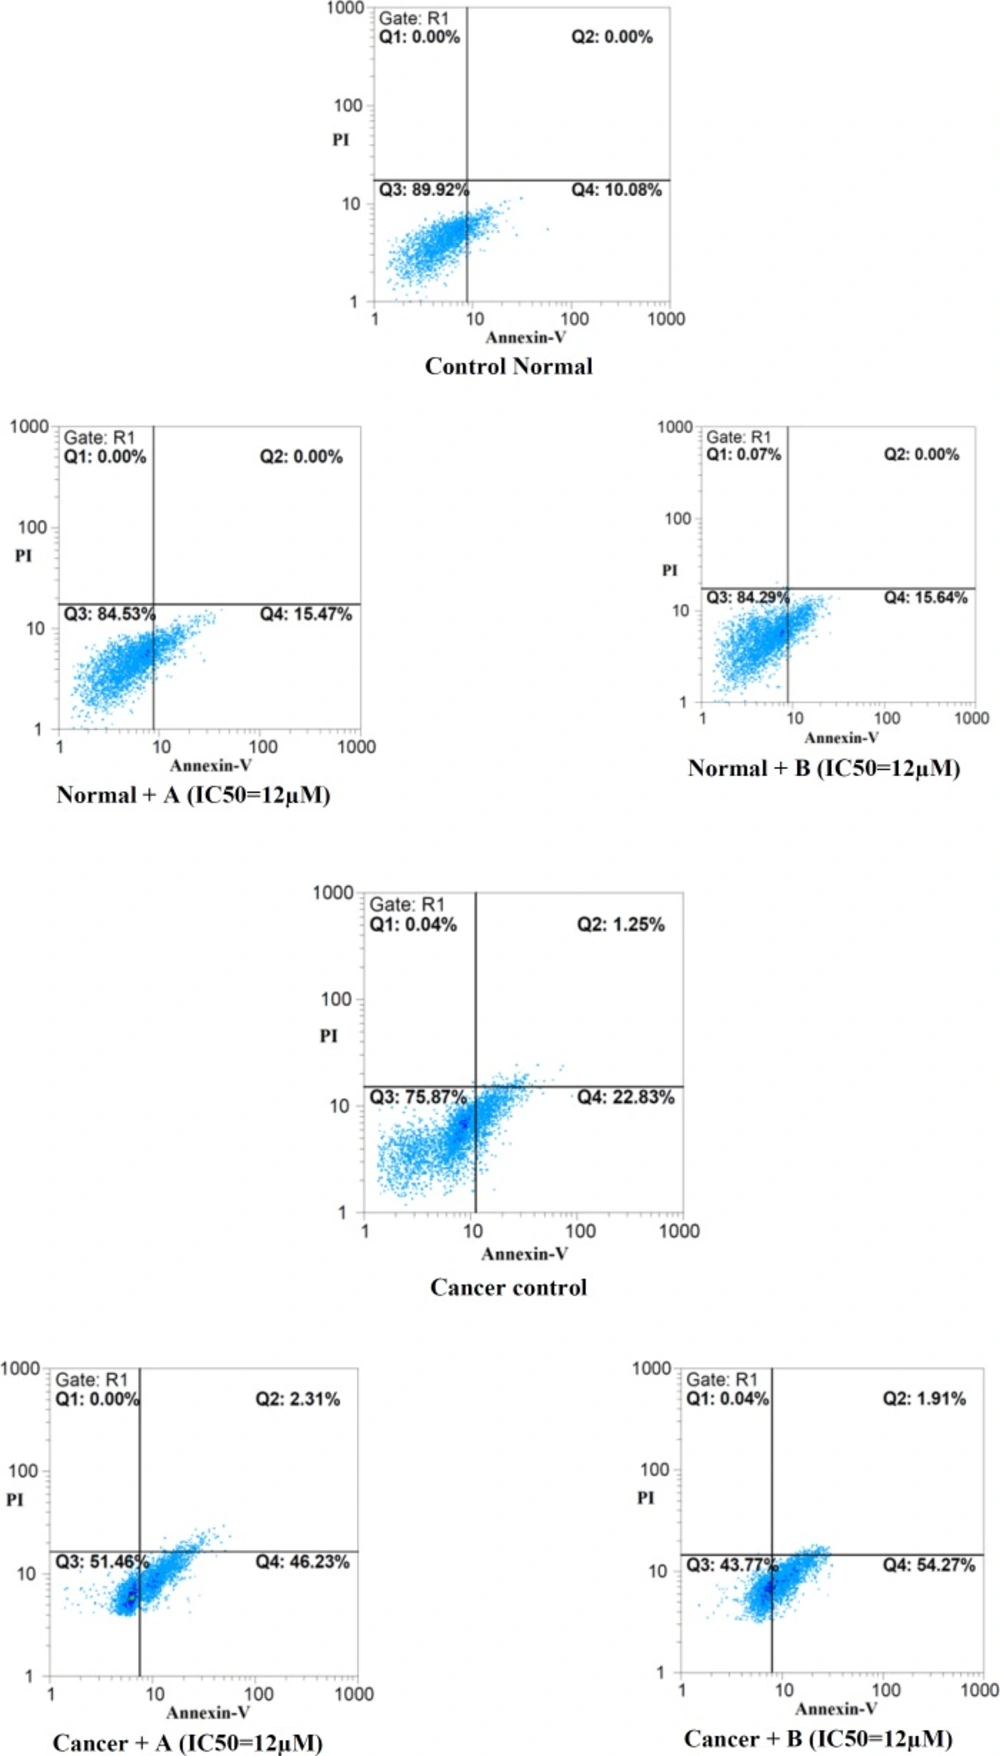
Effects of colchicine derivatives (A and B) on apoptosis in both ALL and healthy lymphocytes.Colchicine derivatives induced apoptosis in ALL but not in normal B-lymphocytes at IC50 concentration (3 μM) within 12 h
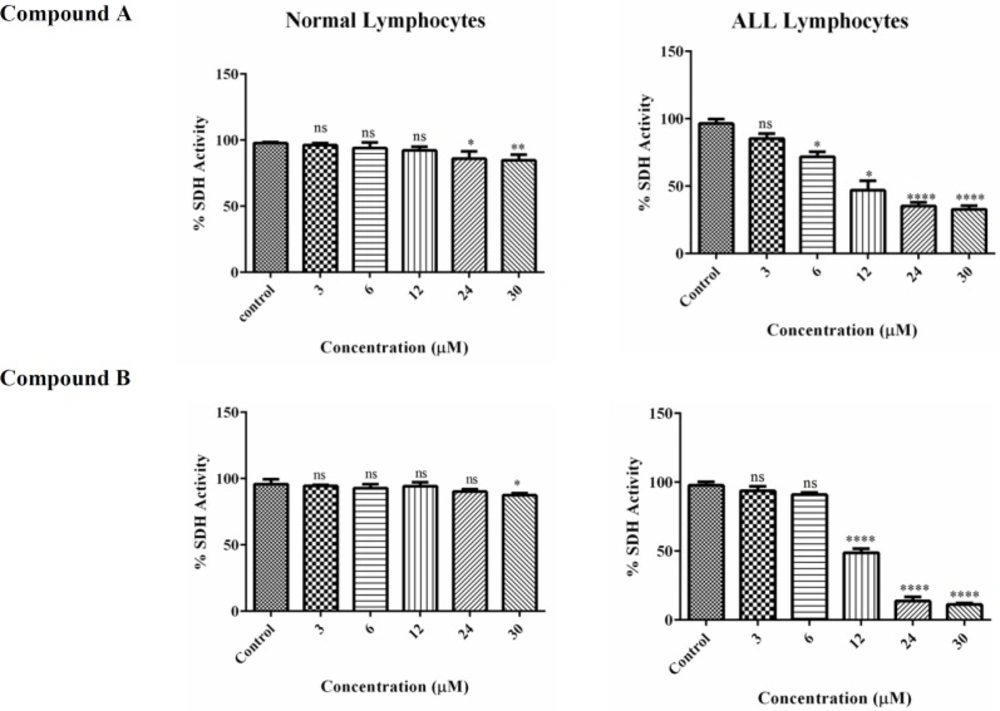
The effect of Colchicine derivatives (A and B) on Succinate dehydrogenase activity in both ALL and healthy B-lymphocytes. The effect of colchicine derivatives (A and B) on succinate dehydrogenase activity in both healthy and ALL mitochondria obtained from human B-lymphocytes were evaluated by MTT assay following 1 h of treatment. Values (mean ± S.D.) are from three independent experiments (n = 6) *p < 0.05, **p < 0.01, ****p < 0.0001
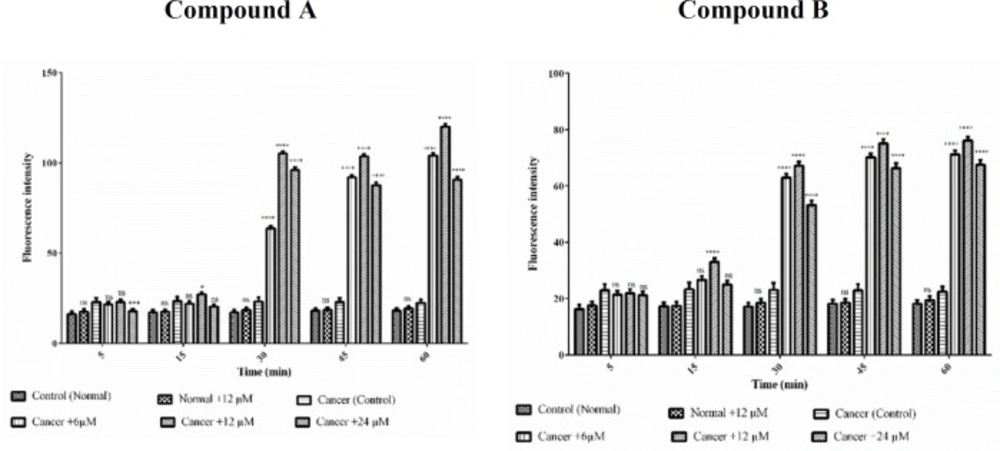
The effect of Colchicine derivatives (A and B) on ROS formation in both healthy and ALL mitochondria. Freshly isolated purified mitochondria were obtained from both healthy and ALL donors incubated with of colchicine derivatives (A and B) for 1 h. Columns represent mean of DCF fluorescence intensity in ALL and healthy B-lymphocytes treated with colchicine derivatives for 0–60 min. Values (mean ± S.D.) are from three independent experiments (n = 6) ****p < 0.0001
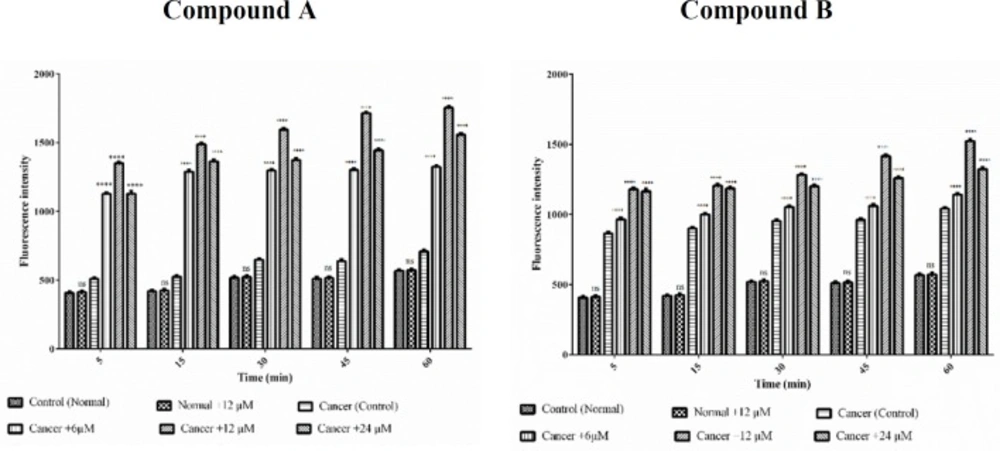
Effects of Colchicine derivatives (A and B) on MMP decline in both ALL and healthy mitochondria. Colchicine derivatives-induced MMP decline in ALL but not in healthy mitochondria. Columns represent mean of Rhodamine123 fluorescence intensity in ALL and healthy mitochondria treated with colchicine derivatives5-60 min. Values (mean ± S.D.) are from three independent experiments (n = 6). ****p < 0.0001
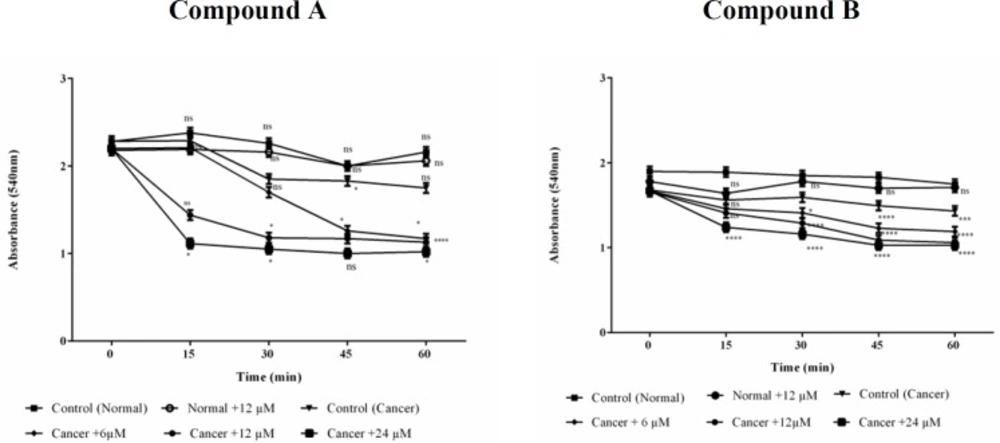
Effects of Colchicine derivatives (A and B) on mitochondrial swelling in both ALL and healthy mitochondria. Addition of colchicine derivatives (A and B) 6, 12 and 24μM induces mitochondrial swelling in ALL but not in healthy B-lymphocyte mitochondria in a concentration depending manner. Mitochondria were suspended in swelling buffer and incubated for 1 h. The mitochondrial swelling was measured by following absorbance (λmax = 540 nm) decrease. Values (mean ± S.D.) are from three independent experiments (n = 6) *p < 0.05, **p < 0.01, ***p < 0.001, ****p < 0.0001
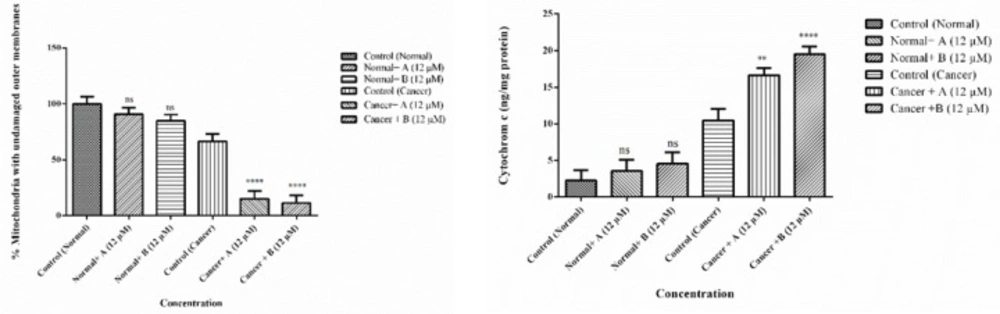
Effects of Colchicine derivatives (A and B) on mitochondrial membrane integrity and cytochrome c release in both ALL and healthy mitochondria. Colchicine derivatives (A and B) (12 μM) cause mitochondrial membrane damage and cytochrome c release in the ALL mitochondria but not in healthy mitochondria. The amount of expelled cytochrome c from mitochondrial fraction into the suspension buffer was determined using human Cytochrome c ELISA kit as described in above. Values (mean ± S.D.) are from three independent experiments (n = 6) *p < 0.05, ***p < 0.001
Discussion
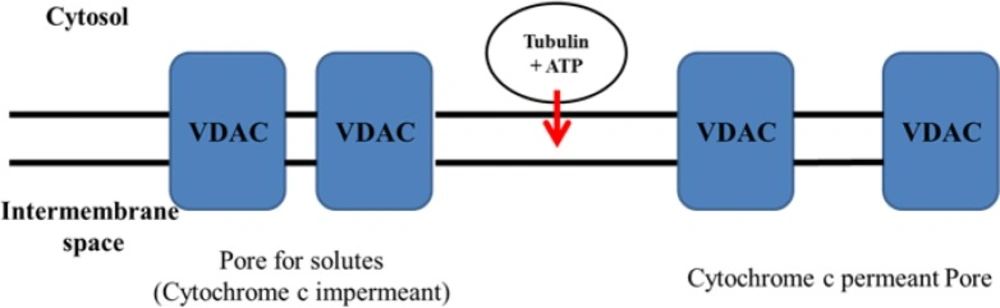
Proposed mechanisms for the selective colchicine derivatives induced mitochondrial targeting in ALL B-lymphocytes

