Internal validation
The internal validation step was performed via extracting the structures of co-crystallized ligands ditercalinium (DIT) and propamidine (TNT) and re-docking them into the original crystallographic files of the d(CGCAAATTTGCG)2 and d (CGCG)2 oligonucleotides. Validation of the AutoDock method for each crystallographic structure was interpreted in terms of root mean square deviation (RMSD) of the Cartesian coordinates of the atoms of the ligand in the docked and crystallographic poses (RMSD < 2Ǻ). It should be noted that top-ranked AutoDock clusters in the output files were supported by high conformational population. Obtained results indicated that the parameters set for AutoDock were reliable for reproducing X-ray complex structures.
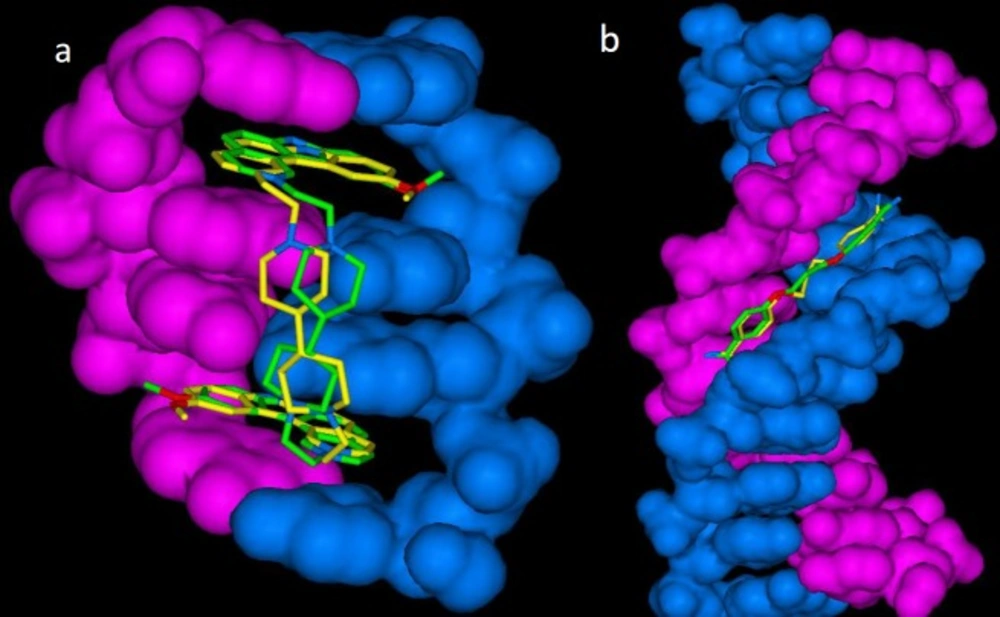
For more elucidation, lowest energy poses of cognate drugs (propamidine and ditercalinium) in docked and crystallographic states are shown in
Figure 1.
Lowest energy (bioactive conformation) poses of a) propamidine-DNA (1D32) and b) ditercalinium-DNA (102D) in docked (yellow stick) and crystallographic (green stick) complexes (DNA structure rendered in blue and pink as solvent-excluded surface) (RMSD for 1D32: 1.10 Å and RMSD for 102D: 1.05 Å)
Binding model selection
AutoDock is a widely used docking package in computational medicinal chemistry and it is believed to offer relatively logical outcomes within several calculations (
35). To further elucidate the interactions of DNA with indeno [1,2-b]quinoline-9,11-diones (1–21), we used AutoDock4.2 software to dock all the relevant structures into the d (CGCG)
2 and d (CGCAAATTTGCG)
2 oligonucleotides of DNA double helix.
Structure elucidation of the evaluated indeno [1, 2-b]quinoline-9,11-diones showed that these compounds possessed aromatic/heteroaromatic rings constructed around a DHP/pyridine core. In our opinion, such molecular pattern might be appropriate for intercalation and H-bond interactions with DNA double helix. To explain more, possible structure DNA binding relationship of indeno [1, 2-b] quinoline-9,11-diones is depicted below (
Scheme 1). Observed binding potentialities persuaded us toward performing modeling studies with the aim of proposing novel DNA interfering agents.
Possible relationship between chemical structure and DNA binding ability of evaluated indeno [1, 2-b] quinoline-9, 11-diones, as can be predicted from the model, both hydrophobic and hydrogen interactions might be expected on the basis of represented scaffold template
Chemical structures of screened ligands are summarized in
Figure 2. All of the molecules could be interpreted as drug-like chemical entities and for this reason they might be good candidates for further drug development strategies (
36). In addition, selected DHP structures possessed low number of active torsions (rotatable bonds) which proposed them as suitable candidates for docking simulation due to lower free torsional energies.
Chemical Structures of indeno [1, 2-b] quinoline-9,11-diones under study
For more clarification,
in-vitro cytotoxicity effects of indeno [1, 2-b] quinoline-9,11-diones on different cell lines could be reviewed elsewhere (
11).
Binding affinity prediction
Predicted docked energies can be reported in terms of final docked energy (FDE) which is the sum of final intermolecular energy and final internal energy of ligand or estimated free energy change of binding (ΔG) that is the sum of final intermolecular energy and torsional free energy penalty (
37).
Docking results indicated that indeno [1, 2-b]quinoline-9,11-diones could be reversibly attached to DNA oligonucleotides with varied binding affinities ranging from -6.86 to -9.20 kcal.mol
-1 and -5.85 to -9.87 kcal.mol
-1 in 1D32 and 102D macromolecular templates, respectively. For more clarification, AutoDock binding affinities together with probability factors in terms of number of clusters and top-ranked cluster population in AutoDock output files are summarized in
Table 1.
| No. of conformations in top-ranked cluster (out of 50) | No. ofclusters | Inhibition constant (Ki)(µM) | Final Docked energy(kcal.mol-1) | Estimated free binding energy(kcal.mol-1) | PDB code | Comp. code |
|---|
| 41 | 4 | 5.58 | -8.30 | -7.17 | 1D32 | 1 |
| 30 | 3 | 4.60 | -7.99 | -7.28 | 1D32 | 2 |
| 29 | 3 | 4.68 | -8.27 | -7.27 | 1D32 | 3 |
| 46 | 3 | 2.36 | -9.25 | -7.68 | 1D32 | 4 |
| 24 | 4 | 4.86 | -9.40 | -7.25 | 1D32 | 5 |
| 45 | 4 | 5.85 | -8.38 | -7.14 | 1D32 | 6 |
| 32 | 4 | 3.98 | -8.15 | -7.37 | 1D32 | 7 |
| 38 | 3 | 5.64 | -7.93 | -7.16 | 1D32 | 8 |
| 44 | 2 | 2.13 | -8.64 | -7.74 | 1D32 | 9 |
| 43 | 4 | 4.28 | -8.53 | -7.32 | 1D32 | 10 |
| 49 | 2 | 2.16 | -9.35 | -7.73 | 1D32 | 11 |
| 50 | 1 | 1.08 | -9.95 | -8.14 | 1D32 | 12 |
| 50 | 1 | 2.53 | -8.93 | -7.63 | 1D32 | 13 |
| 27 | 3 | 0.764 | -9.00 | -8.34 | 1D32 | 14 |
| 45 | 2 | 2.02 | -8.58 | -7.77 | 1D32 | 15 |
| 2 | 8 | 0.179 | -9.71 | -9.20 | 1D32 | 16 |
| 37 | 5 | 9.34 | -7.88 | -6.86 | 1D32 | 17 |
| 21 | 5 | 0.624 | -9.08 | -8.45 | 1D32 | 18 |
| 34 | 4 | 4.39 | -8.02 | -7.31 | 1D32 | 19 |
| 4 | 6 | 0.270 | -9.16 | -9.12 | 1D32 | 20 |
| 29 | 5 | 5.47 | -8.24 | -7.18 | 1D32 | 21 |
| 48 | 2 | 6.65 | -8.19 | -7.06 | 102D | 1 |
| 38 | 5 | 1.07 | -8.76 | -8.15 | 102D | 2 |
| 34 | 2 | 0.134 | -10.06 | -9.38 | 102D | 3 |
| 17 | 10 | 1.12 | -9.18 | -8.12 | 102D | 4 |
| 14 | 6 | 4.80 | -9.39 | -7.26 | 102D | 5 |
| 20 | 3 | 9.01 | -8.13 | -6.88 | 102D | 6 |
| 31 | 4 | 0.480 | -9.27 | -8.62 | 102D | 7 |
| 26 | 3 | 1.28 | -8.82 | -8.04 | 102D | 8 |
| 36 | 4 | 0.328 | -10.58 | -8.85 | 102D | 9 |
| 28 | 3 | 0.791 | -9.44 | -8.32 | 102D | 10 |
| 24 | 5 | 1.64 | -9.13 | -7.89 | 102D | 11 |
| 26 | 3 | 0.975 | -9.42 | -8.20 | 102D | 12 |
| 48 | 2 | 1.73 | -9.44 | -7.86 | 102D | 13 |
| 50 | 1 | 0.076 | -10.32 | -9.71 | 102D | 14 |
| 26 | 2 | 0.304 | -9.61 | -8.89 | 102D | 15 |
| 44 | 3 | 0.077 | -10.44 | -9.70 | 102D | 16 |
| 21 | 7 | 3.94 | -8.64 | -7.37 | 102D | 17 |
| 29 | 4 | 0.058 | -10.5 | -9.87 | 102D | 18 |
| 35 | 3 | 0.340 | -9.68 | -8.82 | 102D | 19 |
| 20 | 9 | 0.108 | -10.18 | -9.50 | 102D | 20 |
| 18 | 7 | 0.844 | -9.59 | -8.29 | 102D | 21 |
Comparative analysis of experimental cytotoxicity values and calculated binding affinities might be interpreted via following rationales:
(
1) Nearly all aromatized indeno [1, 2-b] quinoline-9,11-diones were associated with higher binding energies when compared to their non-aromatized analogues (
Figure 3). One of the possible explanations for such observation might be attributed to the superior π-π stacking interactions with oligonucleotides of DNA double helix in aromatized compounds. Such observation could not be confirmed by experimental cytotoxic activities in Jurkat cell lines (Such rationalization may not be offered for other cell lines due to the uncertainty of cytotoxic data). This trend might be explained by this point that the cytotoxic effect of aromatized scaffolds in Jurkat cell lines is not related to the DNA intercalation.
Comparison of the DNA binding affinities for non-aromatized (1,2,3,6,7,8,9 & 10) and aromatized (13,15,16,17,18,19,20 & 21) indeno [1,2-b] quinoline-9,11-diones (PDB deposition codes: 1D32 & 102D); as can be understood from the diagram, aromatized indeno [1, 2-b] quinoline-9,11-diones were associated with higher binding energies when compared to their non-aromatized analogues
(
2) Experimental cytotoxic data showed that
N-phenyl substituted compounds had increased effects in the majority of cases (Compounds 4, 5, 11 & 12). It was also recognized that FDE values (1D32) could better anticipate DNA-ligand interactions in such molecules (4: -9.25, 5: -9.40, 11: -9.35 & 12: -9.95 kcal/mol).
(
3) FDE values over -10 kcal/mol were contributed to compounds 3, 9, 14, 16 & 20 in 102D model. Experimental results showed that except for compound 14 which was inactive in HeLa, LS180 and MCF7 cell lines, the other four compounds showed good anti-tumoral effects within tested cells. In relation to this, modeling studies confirmed that the incorporation of electron-withdrawing substituents such as chlorine atoms to the imidazole moiety of indeno [1, 2-b] quinoline-9, 11-dions might be associated with higher cytotoxic effects.
(
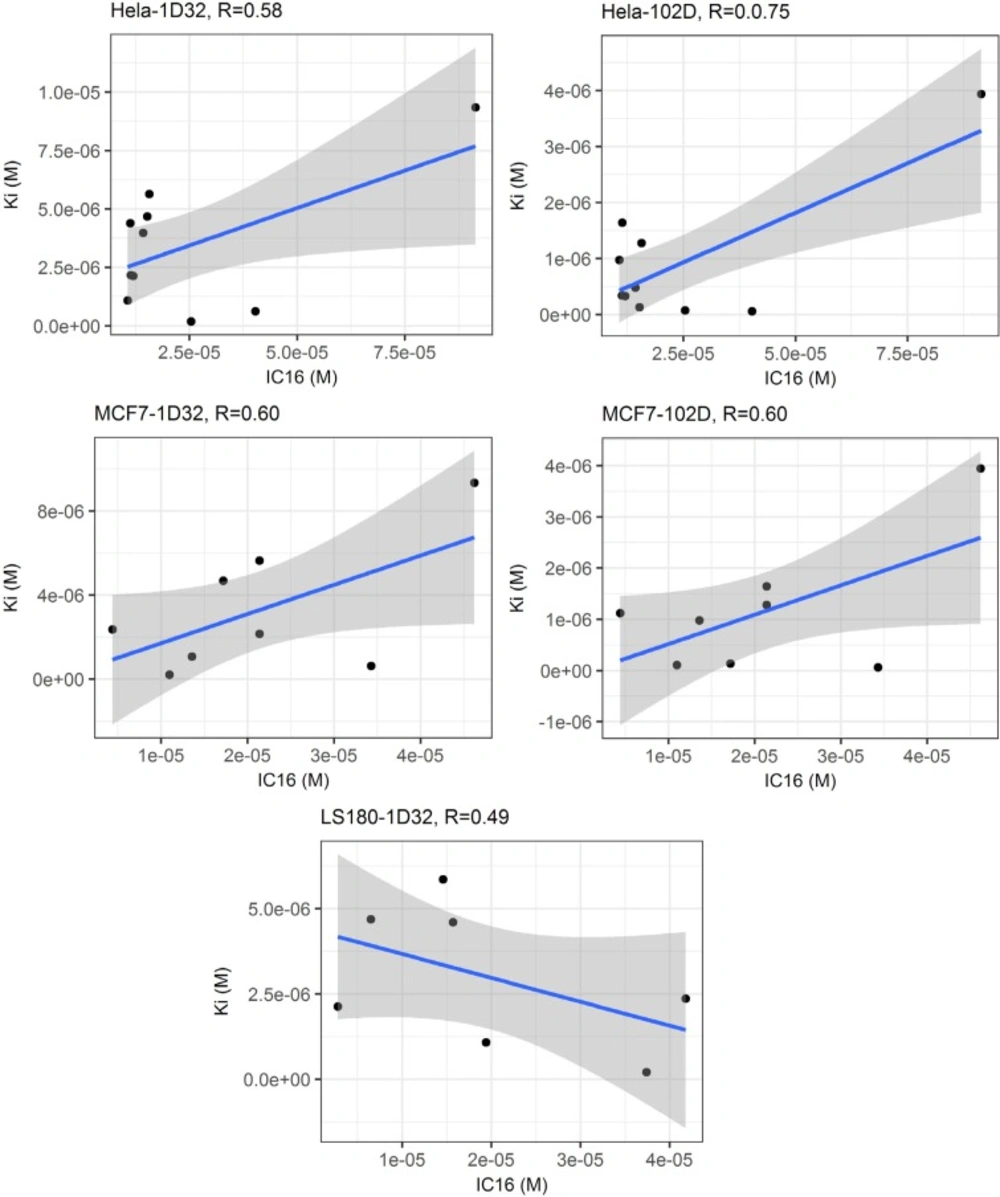
4) Linear regression analysis of calculated binding affinities and experimental cytotoxicity values showed that maximum correlation could be achieved in the case of HeLa cells (r = 0.74; r
2 = 0.56 for experimental IC
16 versus predicted K
i values in 102D system) (
Figure 4). No correlation could be found between predicted DNA affinities and cytotoxic activities in Jurkat cell lines.
Linear regression analysis of predicted DNA binding affinities (Ki) versus experimental cytotoxic effects (IC16) within two DNA conformations (1D32 & 102D); it can be seen that maximum correlation was achieved in the case of HeLa cells (r = 0.75; r 2= 0.56 for experimental IC16 versus predicted Ki values in 102D system) while no correlation could be found in the case of Jurkat
Ligand-DNA binding interactions
With the aim of further elucidating ligand-DNA binding interactions, LIGPLOT program was used to generate the binding interactions between DHPs and DNA. Selective hydrophobic interactions were depicted using the hydrophobic bond module of Ligplot (Supplementary
material 1).
To be informative, binding interactions along with binding participants of various complexes of indeno [1, 2-b] quinoline-9,11-dions with DNA are summarized in the supplementary material 2. Analysis of the DNA-ligand binding interactions revealed that:
1) Various PDB deposited templates of DNA cold have a considerable effect on binding mode of indeno [1 ,2-b]quinoline-9,11-diones. Such observation might emphasize on the effect of initial macromolecular template on molecular modeling results.
2) Model 102D provided more hydrophobic participants when compared to 1D32. This might be expected since the residual constituents of 102D template included additional adenine and thymine bases with thymine being the most hydrophobic interacted residue.
3) All the compounds exhibited hydrophobic contacts with a number of DNA nucleobases in model 102D but there were some exceptions in model 1D32. To explain more, compounds 2, 5, 8, 10, 14 & 18 contributed to hydrophobic contact with DG, DC, DG, DG, DG & DG nucleobases, respectively. Such priority of guanine over cytosine in hydrophobic binding might be demonstrated through additional aromatic ring of guanine and hence providing weak interactions with DHP molecules.
4) Thymine was the only residue participating in key H-bonds with indeno [1, 2-b]quinoline-9,11-diones in model 102D. Our binding maps showed that this priority could be best explained by additional oxygen acceptors and also NH donors of thymine.
5) In compounds such as 1, nitroimidazole substituent provided additional hydrogen interactions with H-bond donor atoms of DNA bases (supplementary material 3).
6) In non-aromatized structures, molecular alignment of compounds 2, 8 and 10 associated with key H-bonds to carbonyl oxygen of DG2 nucleobase (1D32).
7) Unlike the model 1D32, in model 102D all the non-aromatized compounds participated in key H-bond interactions via DHP NH site. Compounds 6-10 made H-bonds with sugar ring oxygen of nucleotide while binding template for compounds 1-3 was through thymine carbonyl oxygen.
8)
N-phenyl substituted compounds (
4,
5,
11 and
12) contributed to additional hydrophobic interactions with DC7 and DG8 nucleobases of DNA (1D32). Such hydrophobic contacts were observed within DA18, DT8, DT9 and DT19 residues in model 102D.
Molecular dynamic simulations
Dynamic stabilities of two indeno [1, 2-b] quinoline-9,11-dione/DNA complexes were evaluated using MD simulations. Considering probable binding mechanisms, i.e. intercalation (1D32) and minor groove binding (102D), the ligand with highest binding energy was selected for further simulations in each case.
Due to the planar structure of Compound 16, it was expected that this compound could bind to the DNA structure through intercalating between DG and DC nucleobases. Moreover; presence of two methyl groups at position 7 of quinoline moiety opposed steric hindrance on compound 18 and made its interaction more favorable within DNA minor groove when compared to the intercalation between DNA nucleobases.
After solvation of the DNA-ligand systems in a dodecahedron box with TIP3P water and adding enough number of Na+ ions to achieve electro-neutrality, 5000 minimization steps was performed using the steepest descent method. Soaking of DNA-ligand system was carried out by 100 ps constrained NVT followed by 100 ps NPT ensembles. Following system equilibration, 50 ns MD production was performed in each case without any constraint.
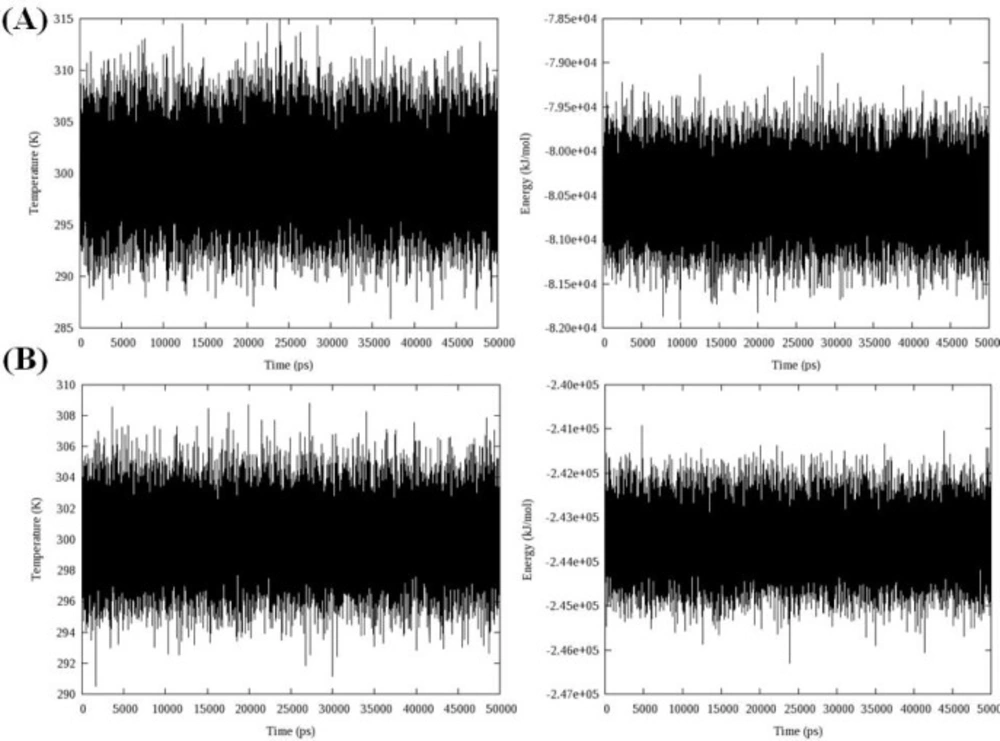
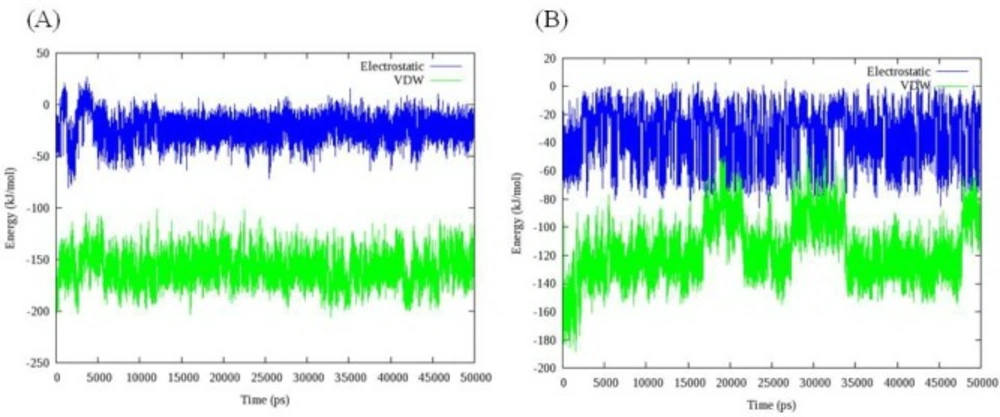
Total energy, temperature and root mean square deviation (RMSD) were assessed to confirm the stability of trajectories. The average temperature during MD simulations at 300 K was found to be 299.0 K (± 3.6) and 298.2 K (± 2.3) in the case of models 1D32 and 102D, respectively. The temperatures of the both systems were stable for the whole simulation time. Fluctuation of temperature and energy is depicted in
Figure 5. Obtained results showed that the conservation of energy over 50 ns MD simulations was convinced in both systems.
The time evolution of temperature and energy during 50 ns of MD simulations A: Complex of 16 and DNA (PDB code: 1D32), B: Complex of 18 and DNA (PDB code: 102D); data represents that conservation of energy over 50 ns MD simulations is convinced in both systems
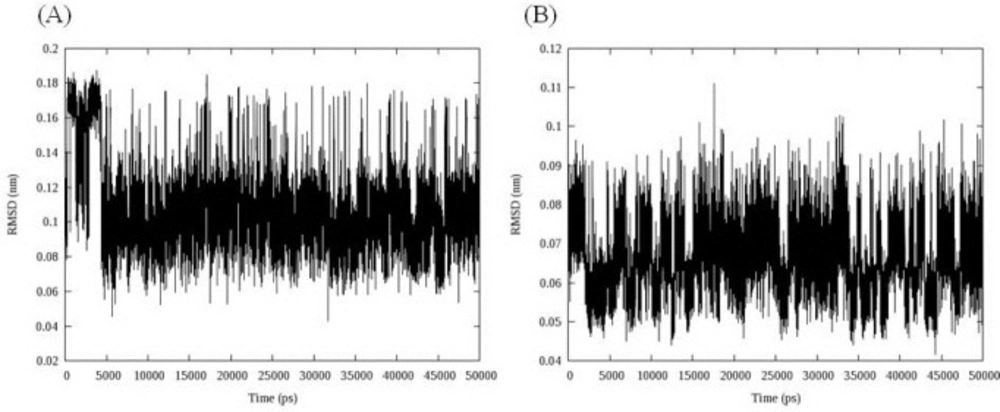
The stability of the MD simulation was determined in terms of departures and fluctuations from the initial ligand-DNA structure. The time evolution of the ligand (all atoms) RMSDs was recorded as a function of time. The RMSD of two ligands with regard to initial conformations was illustrated in
Figure 6.
RMSD fluctuations of compound 16 (A) and 18 (B) in their complex with DNA over 50 ns MD simulations; data represented that both ligands were overally stable in their binding mode
As can be seen in
Figure 7, both ligands had overall stability in binding state. Compound 16 bound to DNA through intercalation between DC and DG nucleobases. After 5 ns fluctuations, compound 16 converged to a stable binding conformation and leveled off the rest of MD simulations time. This demonstrated that after 5 ns simulation and initial fluctuations in the all atom scale of ligand RMSD, the ligand acquired an equilibrium state characterized by the RMSD outline. At first glance, the complex between compound 18 and DNA minor groove seemed to be unstable. But a closer look at RMSD fluctuations revealed that the changes in RMSD were very small by the mean 0.066 ± 0.008 nm.
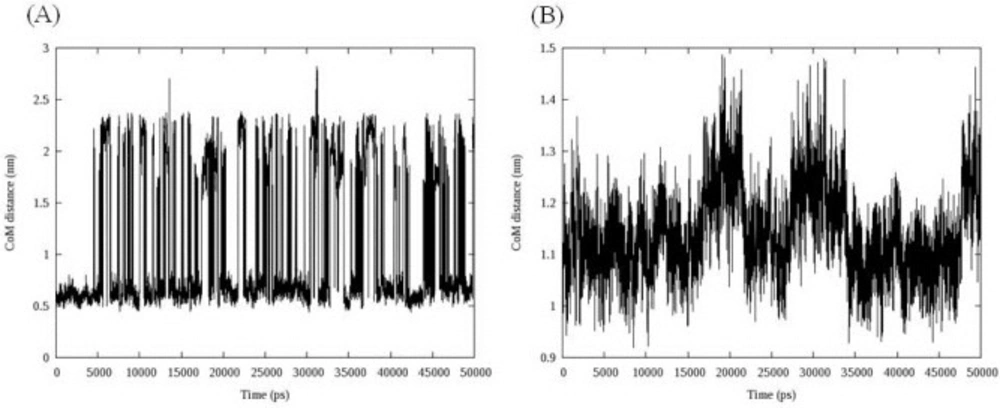
More informative illustration of the system stability could be achieved by computing the center of mass (COM) distance between ligand and DNA. To get the DNA-ligand interactions, we calculated the COM distance between ligand and DNA during the simulation time. The results are depicted in
Figure 7.
Center of mass (COM) distance between compound 16 (A), compound 18 (B) and DNA, data indicated that compound 16 showed dramatic changes in its COM distance during simulation time
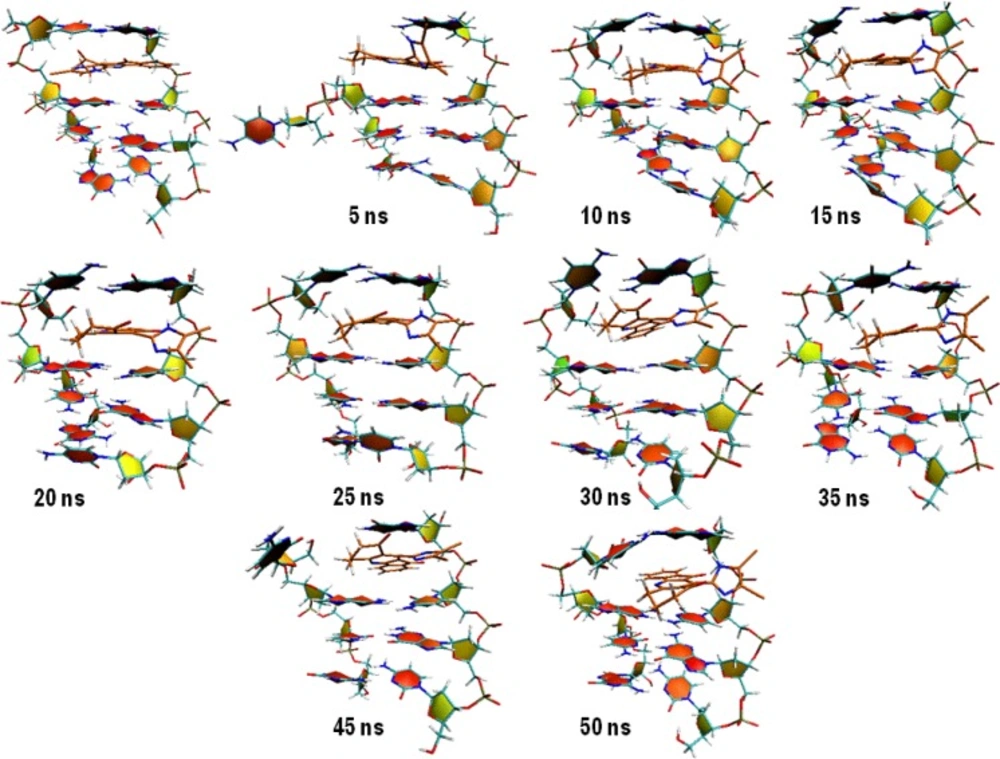
Compound 16 showed dramatic changes in COM distance during simulation time. COM distance between the intercalated ligand (
16) and DNA nucleobases was stable at mean distance 0.60 ± 0.05 till 4.54 ns when the first increase occurred. As can be seen in
Figure 8, the new state seemed to be unstable and rapidly returned to the mean value. This trend repeated over the whole simulation time. To discover the system condition in these situations, complex structure between compound 16 and DNA was extracted from trajectories for each 5 ns (
Figure 8).
5ns snapshot representations of the complex between compound 16 and DNA (PDB deposited code: 1D32); as can be seen, the rise in COM distance might be related to the departure of DNA strands from initial position
We postulated that compound 16 was probably capable of separating DNA strands from each other. The rise in COM distance might be related to the departure of DNA strands from initial position. This movement increased the COM distance between compound 16 and DNA with regard to their initial conformation (
Figure 8A). The separation of DNA strands took place at the end of strand and we could not predict the situation in which the compound intercalated in the middle of DNA strands.
In the case of compound 18, three increases followed by relevant decreases in COM distance could be detected. The fluctuations occurred between 15 and 22 ns, 27 and 35 ns and finally at 47 ns and continued to the end of simulation. Double helix structure was stable during simulation so this time the movement of ligand could be responsible for observed changes. Compound 18 moved along the minor groove. In this case an interesting fact was the returning of ligand into its initial position. Analyzing the binding energy between compound 18 and DNA revealed that initial complex had maximum binding energy (
Figure 9B).
Electrostatic and Van der Waals interactions between compound 16 (A) compound 18 (B) and DNA
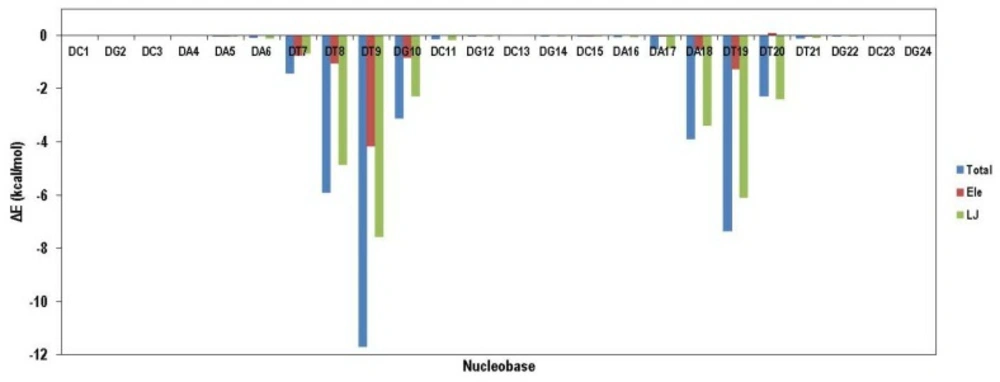
VDW interaction energy as a main contributor to total energy decreased due to the movement of ligand from its initial position. This result demonstrated that compound 18 preferred binding to DT reach domain. For more clarification, the contribution of each nucleobase in total binding energy is illustrated in
Figure 10. As it was expected, compound 18 attached to the minor groove of DNA mainly through VDW interactions. Moreover; compound 18 could favorably bind to DT rich domain through free movement in the minor groove.
Contribution of various nucleobases in total binding energy of compound 18 in complex with DNA; data indicated that compound 18 preferred binding to DT reach domain in the minor groove of DNA mainly through VDW interactions while compound 18 could favorably bind to DT rich domain through free movement in the minor groove.

![Possible relationship between chemical structure and DNA binding ability of evaluated indeno [1, 2-b] quinoline-9, 11-diones, as can be predicted from the model, both hydrophobic and hydrogen interactions might be expected on the basis of represented scaffold template](https://brieflands.com/journals/ijpr/articles/124861/figures/ijpr-17-1249-g002-preview.webp)
![Chemical Structures of indeno [1, 2-b] quinoline-9,11-diones under study](https://brieflands.com/journals/ijpr/articles/124861/figures/ijpr-17-1249-g003-preview.webp)
![Comparison of the DNA binding affinities for non-aromatized (1,2,3,6,7,8,9 & 10) and aromatized (13,15,16,17,18,19,20 & 21) indeno [1,2-b] quinoline-9,11-diones (PDB deposition codes: 1D32 & 102D); as can be understood from the diagram, aromatized indeno [1, 2-b] quinoline-9,11-diones were associated with higher binding energies when compared to their non-aromatized analogues](https://brieflands.com/journals/ijpr/articles/124861/figures/ijpr-17-1249-g004-preview.webp)