
Introduction
Experimental
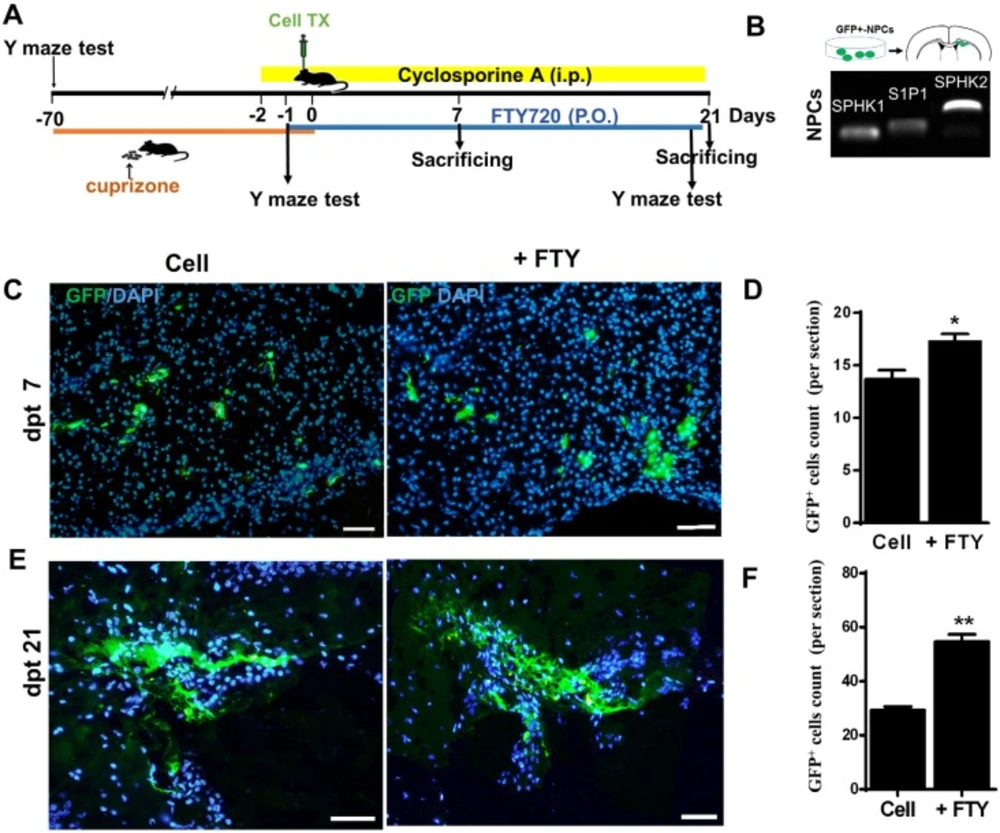
Human induced pluripotent stem cell derived neural progenitor (hiPSC-NP) transplantation and tracking. (A) Schematic diagram of the experimental procedure. (B) Sphingosine-1-phosphate receptor (S1P1) and sphingosine kinase (SPHK) gene expressions in NPs. (C-D) Tracking of transplanted cells in cell and cell +FTY treated groups and quantitative analysis of transplanted cell survival at 7 dpt. (E-F) Tracking of transplanted cells and quantitative analysis of transplanted cell survival at dpt 21. Cell (as control): animals that received NPs; +FTY: Animals that received fingolimod and NPs; *P < 0.05 and **P < 0.01; Scale bar: 50 µm. GFP: Green fluorescence protein (reporter gene); dpt: Day post-transplantation. n = 3
| Antibody | Host | Cat. no. | Dilution | Label |
|---|---|---|---|---|
| PLP | Rabbit polyclonal IgG | Abcam, Inc. (ab28486) | 1:200 | - |
| Olig2 | Rabbit polyclonal IgG | Abcam, Inc. (ab81093) | 1:200 | - |
| GFAP | Rabbit polyclonal IgG | Dako(Z0334) | 1:300 | |
| GFP | Mouse monoclonal IgG | Abcam, Inc.(ab1218) | 1:400 | |
| NeuN | Rabbit monoclonal IgG | Abcam, Inc. (ab177487) | 1:500 | - |
| Anti-rabbit IgG | Goat anti-rabbit IgG | Life Technology(A-11011) | 1:1000 | Alexa Fluor 568 |
| Anti-mouse IgG | Goat anti-mouse IgG | Life Technology(A-11001) | 1:1000 | Alexa Fluor 488 |
| mRNA | Product length | Sequences |
|---|---|---|
| S1P1 | 114 | 5'- TTCTGCGGGAAGGAAGTATG -3' |
| 5'- TGCTGCCGTTGTGTAGTTTC -3' | ||
| SPHK1 | 103 | 5´- GAGAAGTATCGGCGTCTGGG -3´ |
| 5´- CTACAGGGAGGTAGGCCAGT -3´ | ||
| SPHK2 | 200 | 5´- AGACGTGATGCTGGAAGGTG -3´ |
| 5´- AGGGCGACGCGTAAAATAGA -3´ |
Results
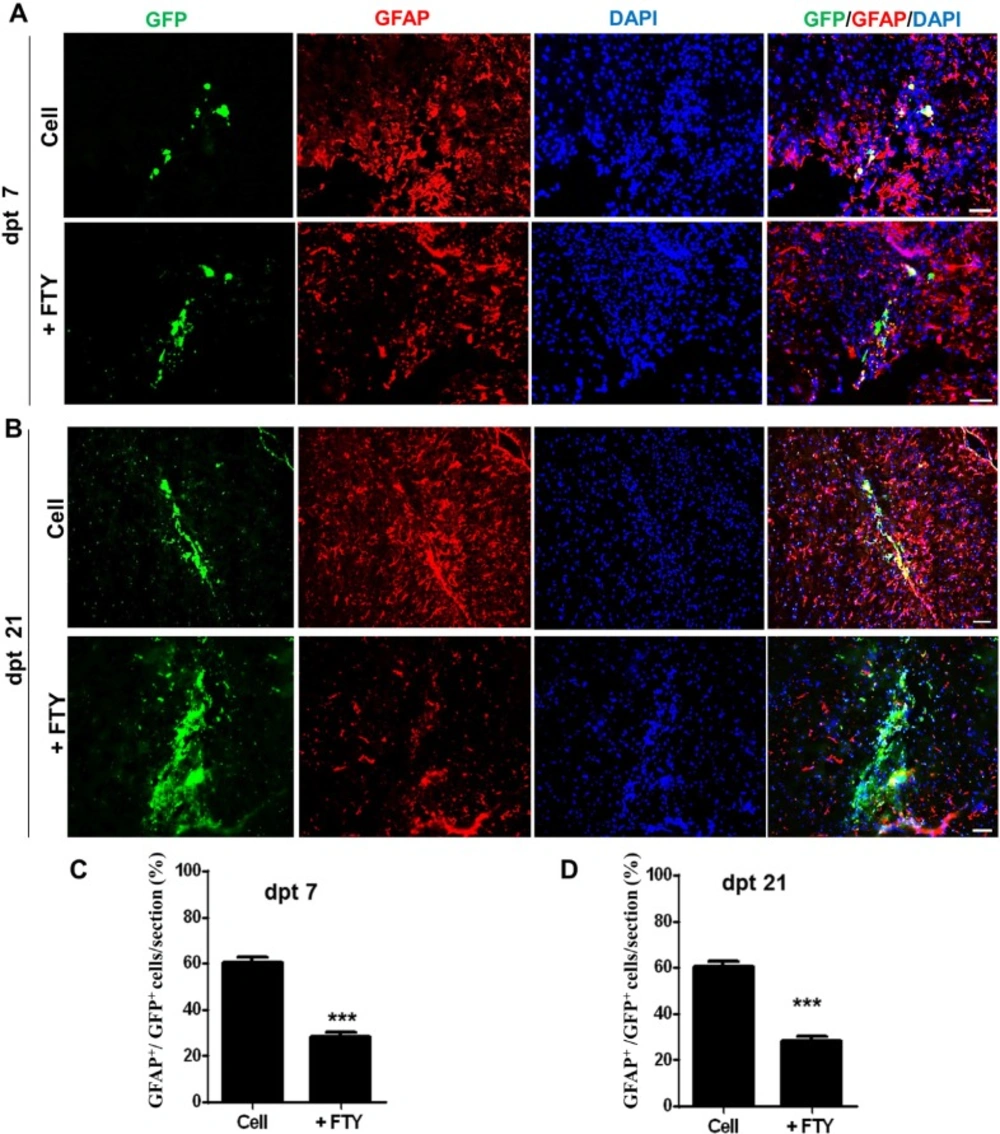
Evaluation of the effect of fingolimod on transplanted neural progenitor (NP) differentiation to astrocytes. (A) Transplanted NPs that expressed GFAP as an astrocyte marker at dpt 7. (B) Transplanted NPs that expressed GFAP at dpt 21. (C) Quantified data for transplanted NPs that expressed GFAP at dpt 7. (D) Quantified data for transplanted NPs that expressed GFAP at dpt 21. Control: Intact animals; CPZ: Animals that received cuprizone for 10 weeks. Cell (as control): animals that received NPs; +FTY: Animals that received fingolimod and NPs. **P < 0.01 and ***P < 0.001. Scale bar: 50 µm. GFP: Green fluorescence protein (reporter gene); DAPI: Nuclei stain; GFAP: Astrocyte marker; dpt: Day post-transplantation. n = 3
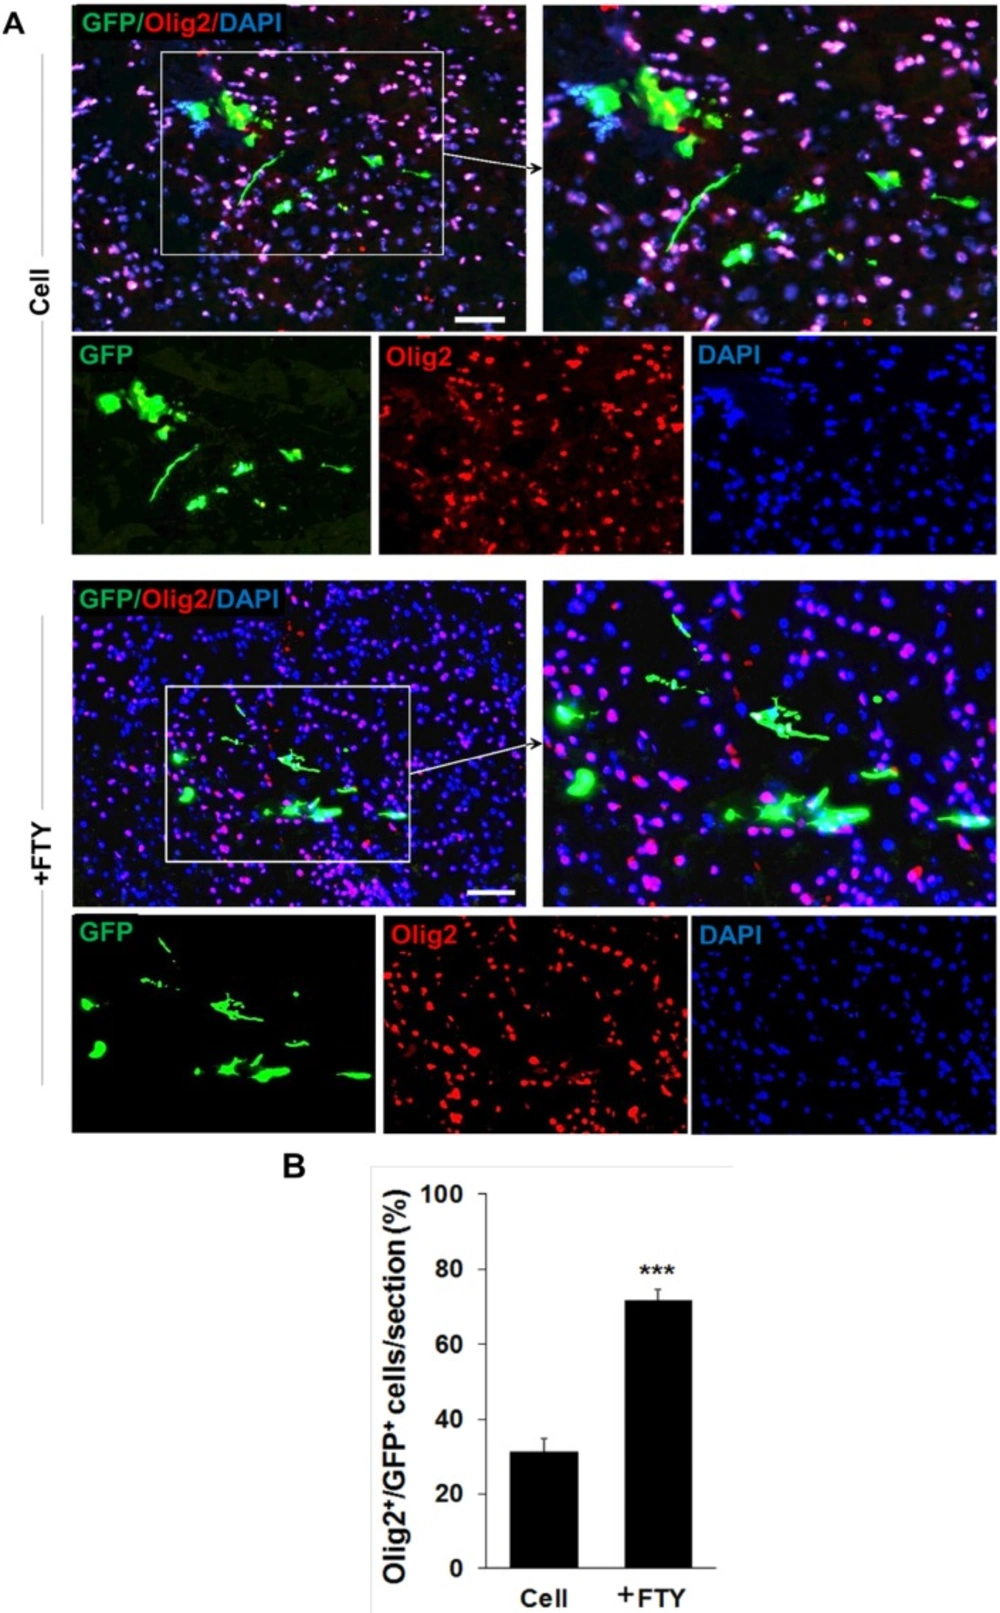
Evaluation of the effect of fingolimod on transplanted neural progenitor (NP) differentiation to oligodendrocyte lineage cells. (A) Transplanted NPs that expressed Olig2 as an oligodendrocyte lineage marker on dpt 7. (B) Quantitative analysis of transplanted cells that differentiated to oligodendrocyte lineage cells at dpt 7. Cell (as control): animals that received NPs. +FTY: Animals that received fingolimod and NPs. ***P < 0.001. Scale bar: 20 µm. GFP: Green fluorescence protein (reporter gene); DAPI: Nuclei stain; Olig2: Oligodendrocyte lineage marker; dpt: Day post-transplantation. n = 3
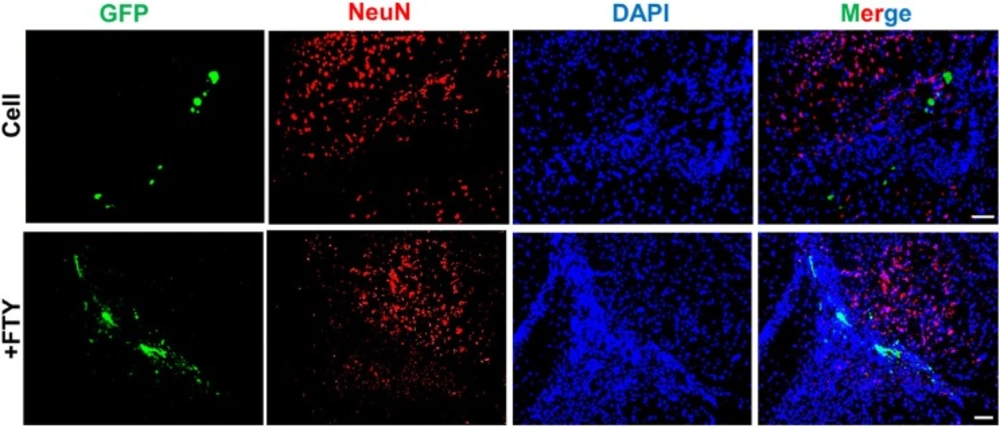
Evaluation of the effect of fingolimod on transplanted neural progenitor (NP) differentiation to neurons. No remarkable NeuN+/GFP+ cells were observed at dpt 7. +FTY: Animals that received fingolimod and NPs. Scale bar: 50 µm. GFP: Green fluorescence protein (reporter gene); DAPI: Nuclei stain; NeuN: Neuronal marker; dpt: Day post-transplantation. n = 3
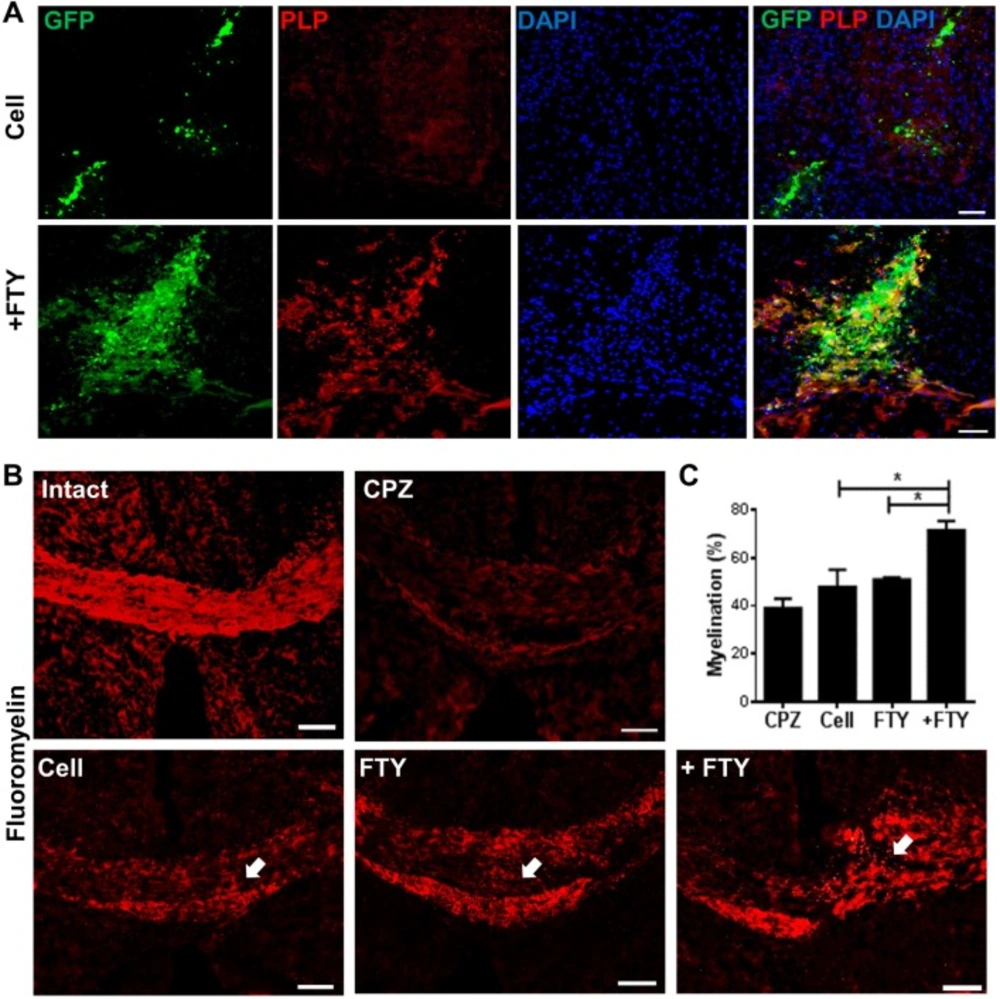
Evaluation of the effect of fingolimod on remyelination efficacy of transplanted neural progenitors (NPs). (A) Transplanted NPs expressed PLP as a mature oligodendrocyte marker at dpt 21. (B) FluoroMyelin™ staining showed the extent of myelination at dpt 21 at the injection site (arrows). (C) Quantification analysis of the extent of myelination at the cell injection site. *P < 0.05; +FTY: Animals that received fingolimod and NPs; CPZ (as control): Animals that received cuprizone for 10 weeks; FTY: Animals that received fingolimod without cell transplantation; Scale bar in (A): 50 µm and (B): 100 µm. GFP: Green fluorescence protein (reporter gene); DAPI: Nuclei stain; PLP: Mature oligodendrocyte marker; dpt: Day post-transplantation. Arrows represent the cell injection site. n = 3
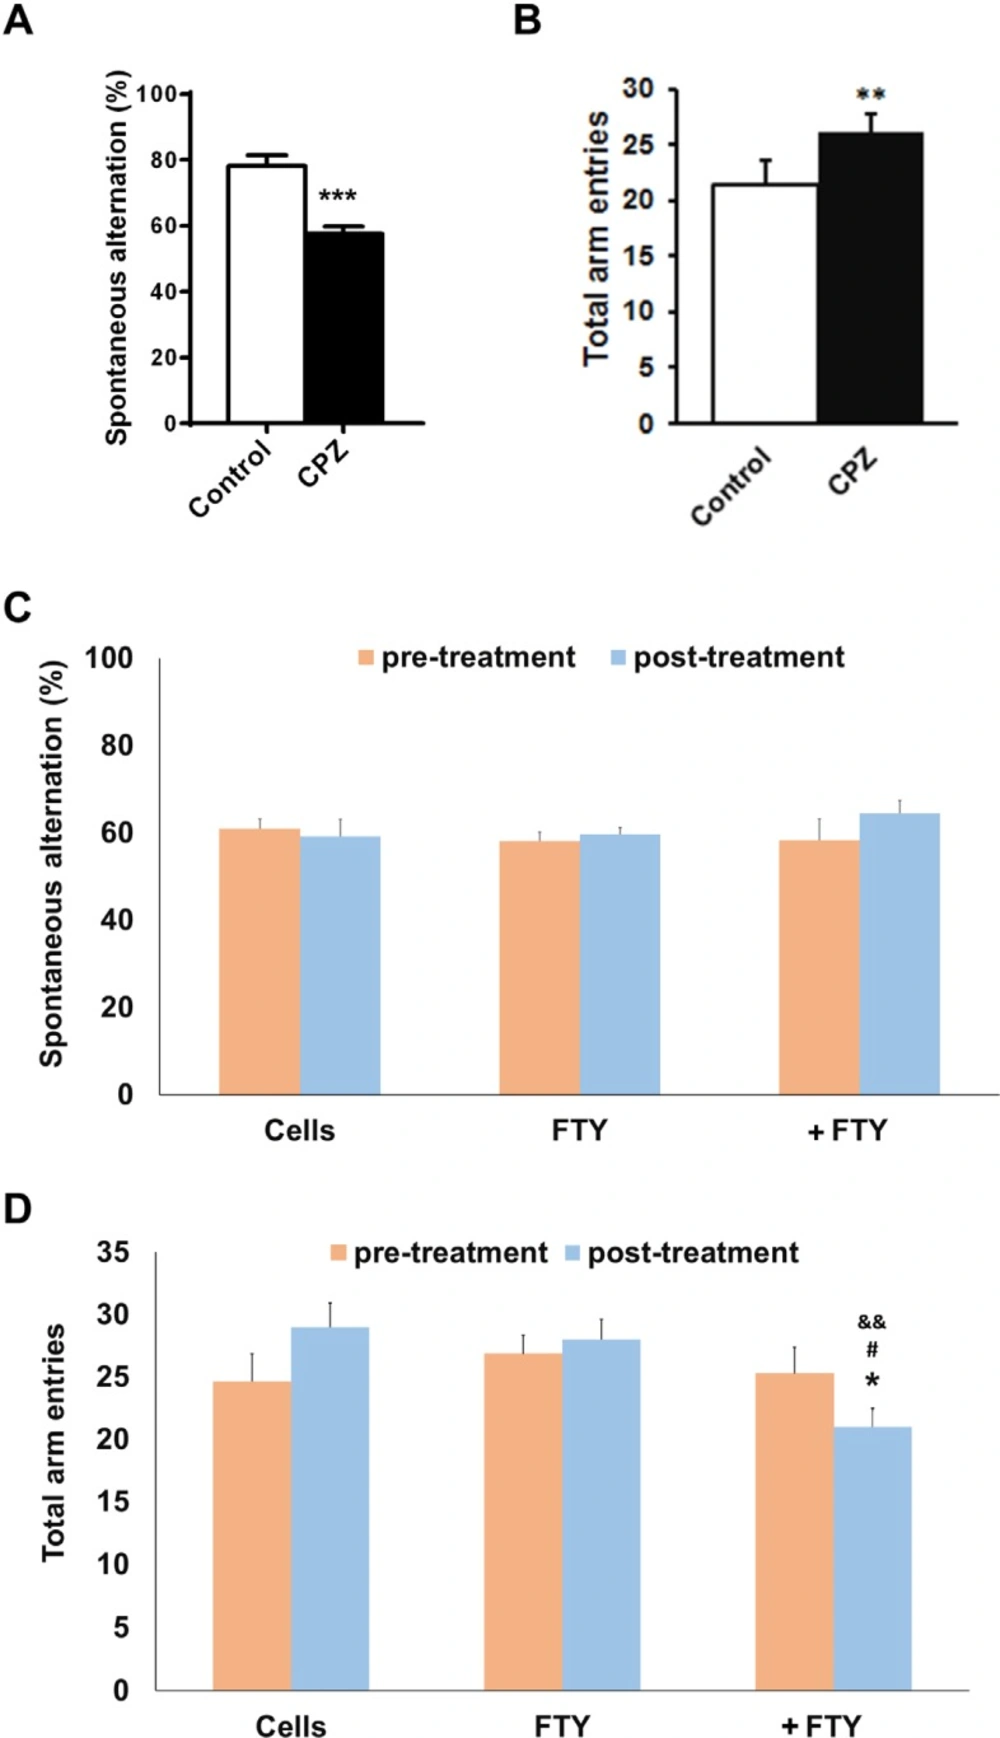
Evaluating the effect of fingolimod on Y-maze behavioral parameters in cuprizone-induced demyelinated mice transplanted with neural progenitors. Animals received cuprizone (CPZ) for 10 weeks, then transplanted with human induced pluripotent stem cell derived neural progenitors (hiPSC-NPs). Y-maze test was performed prior to CPZ, 10 weeks after CPZ feeding and 21 days after NPs transplantation with or without fingolimod (FTY) treatment. (A) Changes in spontaneous alternations following 10 weeks of CPZ feeding. (B) Changes in total arm entries following 10 weeks of CPZ feeding. (C) Changes in spontaneous alternations in CPZ-treated animals following 21 days of treatments. (D) Changes in total arm entries in CPZ-treated animals following 21 days of treatments. Cell: animals that received NPs; FTY: Animals that received fingolimod without cell transplantation; +FTY: Animals that received fingolimod and NPs transplantation; *P < 0.05, **P < 0.01, ***P < 0.001, compared to pre-treatment, &&P < 0.01 compared to Cells, #P < 0.05 compared to +FTY
