Chemicals
2,2-Diphenyl-1-picrylhydrazyl (DPPH), 5,5-dimethyl-1-pyroline-N-oxide (DMPO), phenolic acids including gallic, protocatechuic, vanillic, ellagic, caffeic, chlorogenic, coumaric, ferulic, synapic and rosmarinic acids, quercetin, rutin, luteolin, myricetin, kaempferol, catechin, epicatechin and epicatechin gallate were purchased from Sigma Chemical Co. (St. Louis, MO, USA). These chemicals were of analytical reagent grade. Other chemicals and solvents used of the highest analytical grade were obtained from ''Zorka'' Šabac (Serbia).
Plant material
Two raspberry (Rubus idaeus L.) cultivars (Meeker and Willamette) were obtained from “Alfa RS”, Lipolist, Serbia. Raspberries were washed in running water, cut into pieces, and raspberry pulp was prepared using a domestic food processor (Neo SK-400). After juice separation, the samples of the obtained raspberry pomace were stored at -20 °C until analysis. Moisture of each sample was determined using drying oven method, by drying a representative 10 g sample in a forced air oven (Sterimatic ST-11, Instrumentaria, Zagreb, Croatia) at 60 °C until the constant mass.
Preparation of raspberry pomace extracts
Samples of the wet raspberry pomaces (20 g) were extracted at room temperature using a homogenizer, Ultraturax, and DIAX 900 (Heidolph Instruments GmbH, Kelheim, Germany). The extraction was performed two times with different amounts of 80% methanol aqueous solution containing 0.05% acetic acid: 160 mL in 60 min and 80 mL in 30 min at room temperature. The obtained extracts were filtrated, combined, and evaporated to dryness under reduced pressure and lyophilisated (Alpha 2-4 LSC Martin Christ, Osterode, Germany). The yields of the lyophilisated raspberry pomace extracts were: Meeker (ERM) 2.33 ± 0.08 g and Willamette (ERW) 3.06 ± 0.09 g.
HPLC analysis of raspberry pomaces
All analyte solutions and solvents were filtered prior to analysis through 0.45 µm (pore size) membrane filters (Millipore, Bedford, MA). Quantification of phenolics was done by the following HPLC analysis. Samples were analyzed by a Shimadzu Prominence (Shimadzu, Kyoto, Japan) chromatographic system, which consisted of LC-20AT binary pump, CTO-20A thermostat and SIL-20A autosampler connected to the Waters SPD-20AV UV/Vis detector (Shimadzu, Kyoto, Japan). Chromatograms were recorded using different wavelength for individual compounds: 280 nm for hydroxybenzoic acids (gallic, protocatechuic, vanillic and syringic acid) and ellagic acid, 320 nm for hydroxycinnamic acids (caffeic, chlorogenic, coumaric, ferulic, synapic and rosmarinic acid) and 360 nm for flavonoids (quercetin, rutin, luteolin, myricetin, kaempferol, catechin, epicatechin and epicatechin gallate). Separation was performed on a Luna C-18 RP column, 5 µm, 250 x 4.6 mm (Phenomenex, Torrance, CA, USA) with a C18 guard column, 4 x 30 mm (Phenomenex, Torrance, CA, USA). Two mobile phases, A (acetonitrile) and B (1% formic acid) were used at flow rates of 1 mL/min with the following gradient profile: 0 - 10 min from 10 to 25% A; 10 - 20 min linear rise up to 60% A, and from 20 min to 30 min linear rise up to 70% A, followed by 10 min reverse to initial 10% A with additional 5 min of equilibration time. Reference substances (flavonoids and phenolic acids) and samples were dissolved in 50% methanol. The data acquisition were carried out by the LC Solution Software (Shimadzu, Kyoto, Japan). All analysis were run in triplicate.
Electron spin resonance (ESR) measurements
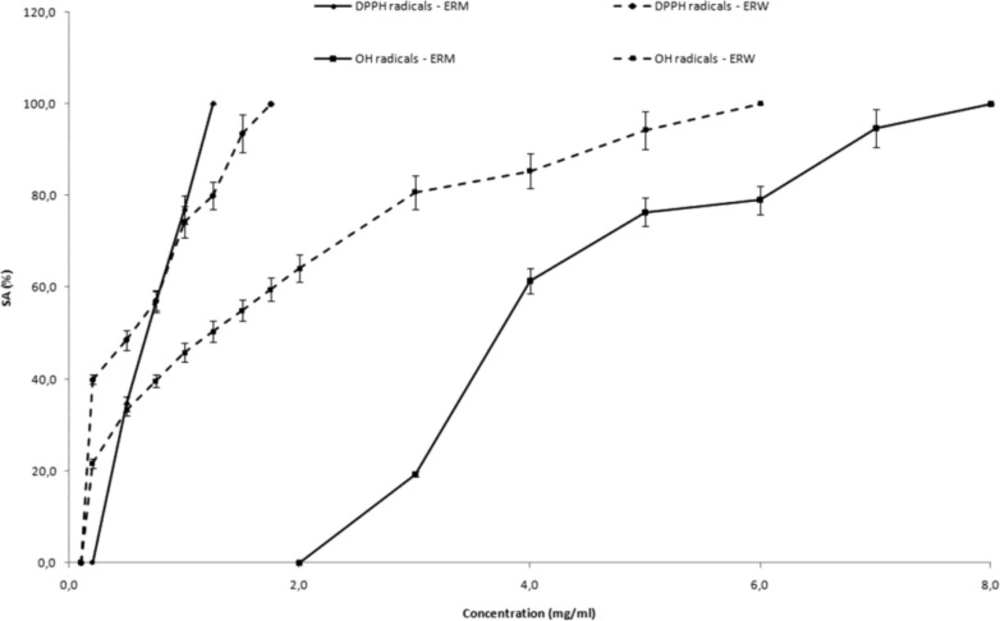
DPPH radical assay
DPPH radicals (DPPH
•) were generated by mixing 0.2 mL water and 0.4 mL 0.4 mM methanolic solution of DPPH radicals (control)
(24). The influence of extracts on the DPPH radicals was investigated by adding the water solutions of ERM (0.25 - 1.25 mg/mL) or ERW (0.1 - 1.75 mg/mL) in the reaction system. After that, the mixture was stirred for 2 min and transferred to an ER-160FT quartz flat cell. The ESR spectra were recorded on model 300E, Bruker, Rheinstetten, Germany under the following conditions: field modulation 100 kHz, modulation amplitude 0.256 G, receiver gain 5 x 10
5, time constant 40.96 msec, conversion time 335.54 msec, center field 3440.00 G, sweep width 100.00 G, x-band frequency 9.45 GHz, power 7.96 mW, temperature 23°C. The scavenging activity (SA) value of extract for DPPH radical was defined as: SA
DPPH•= 100 × (h
0 – h
x) / h
0 [%]
, where h
o and h
x are the height of the second peak in the ESR spectrum of DPPH radicals of the control and the probe, respectively.
Hydroxyl radical scavenging activity
Hydroxyl radicals (
•OH) were generated in the Fenton reaction system obtained by mixing 0.2 mL of 112 mM DMPO, 0.2 mL of H
2O, 0.2 mL of 2 mM H
2O
2, and 0.2 mL of 0.3 mM Fe
2+ (control)
(25). The influence of extracts on the formation and stabilization of hydroxyl radicals was investigated by adding the water solutions of ERM (2.0 - 8.0 mg/mL) or ERW (0.1 – 6.0 mg/mL) in the Fenton reaction system. ESR spectra were recorded after 5 min, with the same setting as DPPH test except: modulation amplitude 0.226 G, time constant 80.72 ms, conversion time 327.68 ms,
x-band frequency 9.64 GHz, power 20 mW. The SA
•OH value of the extract was defined as: SA
•OH = 100 × (h
0 – h
x) / h
0 [%], where h
0 and h
x are the height of the second peak in the ESR spectrum of DMPO-OH spin adduct of the control and the probe, respectively.
Cytotoxic activity against Ehrlich’s tumour in mice
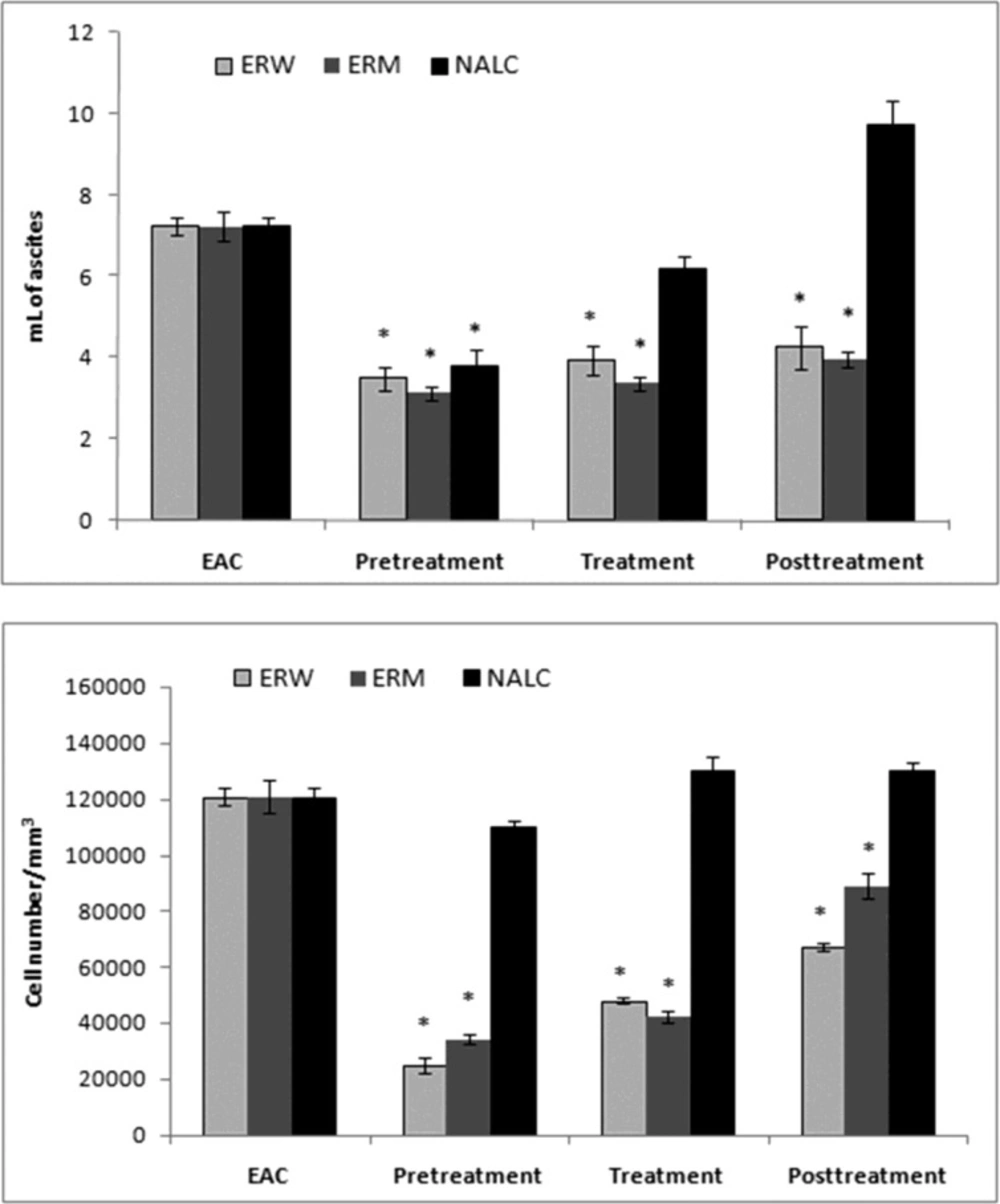
Animals and experimental procedures. Animal care and all experimental procedures were conducted in accordance with the Guide for the Care and Use of Laboratory Animal Resources edited by the Commission of Life Sciences, National Research Council. Male and female Hannover National Medical Institute (Hann:NMRI) mice were obtained from the Biochemical Laboratory, Clinical Centre of Vojvodina (Novi Sad, Serbia). Animals were fed standard mice chow (LM2, Veterinarski zavod, Subotica, Serbia) with free access to tap water, in a temperature (25 ºC) and humidity-controlled (30-50%) animal house under 12 h light/day cycles. NMRI mice of both sexes (6 - 8 weeks old), weighing 25.0 g ± 2.5 g, were used in our experiments. Animals were divided into four groups of six mice under the following conditions and treatments: I, EAC group (mice with implanted EAC cells), (n=6); II mice pre-treated with the ERM, or ERW, 2.0 mL/kg b.w. per day, i.p., starting 7 days before the EAC implantation (n=6); III, mice treated with the ERM, or ERW, 2.0 mL/kg b.w. per day, i.p., starting from the day of the EAC implantation (n=6); and IV, mice post-treated with the ERM, or ERW 2.0 mL/kg b.w. per day, i.p., starting 7 days after EAC implantation (n=6). The experiments were repeated in the same way using the 2.0 mL/kg b.w of antioxidant N-acetyl-L-cysteine (NALC) instead of the ERM, or ERW. Fourteen days after EAC implantation, all mice were anesthetized and sacrificed, and the ascites of the carcinoma were collected for further experiments.
Determination of tumour cell number and cell viability. Ascites from the abdomen were transferred to a Krebs–Ringer phosphate buffer solution (0 C, pH 7.4), then subjected to subsequential centrifuging at 4500 rpm (MSE HIGH SPEED centrifuge at 4 C) and 12 000 rpm (Eppendorf 3200 centrifuge, 2.5 min) to obtain a dense cell suspension (1 : 1). The cell weight and cell number, expressed as the number of cells per mm
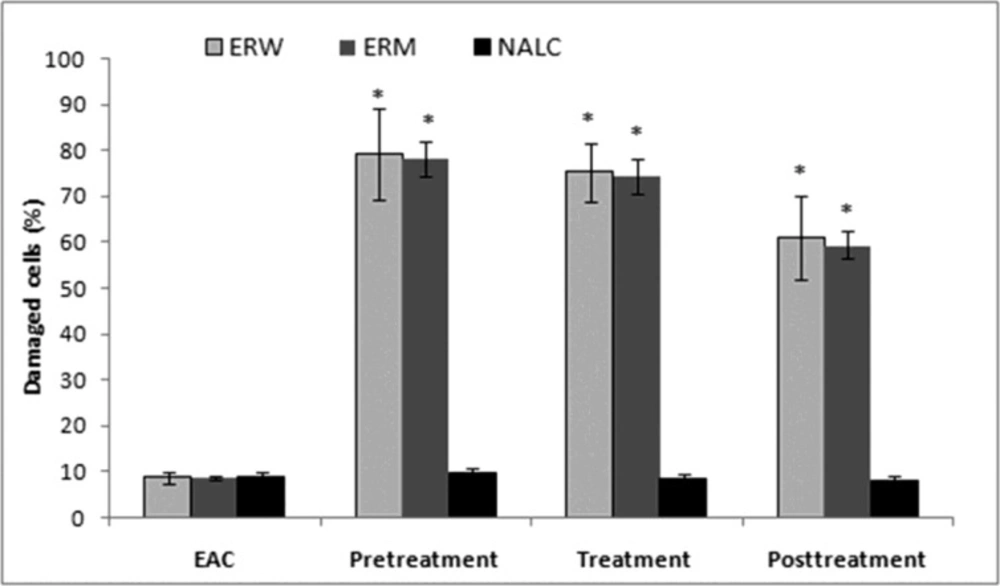
3 (counted in a Neubauer's compartment), were determined from the suspension. Cell viability was determined by the Trypan blue exclusion method: Trypan blue (0.4% solution in Krebs–Ringer phosphate buffer) stained only the damaged cells. These data were expressed as a percentage of damaged cells.
Biochemical tests. Samples were dilluted by Krebs-Ringer phosphate buffer and the activities of several antioxidant enzymes were determined in EAC cells samples by standard well-known laboratory protocols. The activity of xanthine oxidase (XOD) was determined following the Bergmayer method (
25), catalase (CAT) according to Beers and Sizer (
26), peroxidase (Px) according to Simon
et al. (1974) (
27), glutathione peroxidase (GSHPx) according to Beuthler [
28] and glutathione reductase (GR) according to Goldberg and Spooner (
20). The quantity of reduced glutathione (GSH) (non-protein SH) was also determined as well as the intensity of lipid peroxidation (LPx) using the Buege and Aust protocol (
29).
Statistical analysis
All analysis were run in triplicate and were expressed as mean ± standard deviation (SD). Student's
t-test was carried out to identify statistical differences.
p values of 0.05 or less (
p<0.05) were considered to be statistically significant. Mean values between the groups in biochemical analyses were considered significantly different at
p<0.05 confidence level, after the performance of the ANOVA single/double factor statistical analysis (
30), followed by Bonferonni and Tuckey post-hoc tests.