
Introduction
Passiflora is the largest widespread genus in the family Passifloraceae comprising about 500 species (1). Plants of this genus are shrubs and herbs, mostly climbers with auxiliary tendrils (2). They are rich in flavonoids, cyanogenic glycosides and alkaloids. Passiflora caerulea (Blue Passion Flower), native to Brazil and introduced into Britain in 17th century, is the most vigorous and tender species having traditional use of its fruit as sedative and anxiolytic (1, 3). In West Indies, the roots have been used as sedative and vermifuge, while in Italy as diuretic. In Argentine folk medicine, the aerial parts were used as mild antimicrobial agents in diseases like catarrh and pneumonia (4). The plant was introduced to Egypt and cultivated due to its ornamental value of the vines and the showy unusual flowers (3, 5, 6).
Evidence was previously reported that anticonvulsant, anxiolytic and sedative activities of certain Passiflora species were due to their chrysin content (7, 8). No data can be so far found concerning the antioxidant, anti-inflammatory nor antipyretic activities of P. caerulea; however, antioxidant (9-11) and anti-inflammatory (12, 13) activities have been investigated in other Passiflora species.
Genetic fingerprinting by means of RAPD (Random Amplified Polymorphic DNA) technique has been widely used in plants for the construction of genetic maps, for genotyping identification and taxonomic studies (14).
In the present study, authentication of the plant by DNA-fingerprinting was carried out, as well as a bio-guided fractionation of plant leaf extracts was performed in order to isolate their active principles; five different activities were used in the biological screening and advanced chromatographic and spectroscopic techniques were applied in the phytochemical investigation.
Experimental
Plant material and extracts
Samples of Passiflora caerulea L. leaves used in the study were collected during 2008-2010 from El-Orman Botanical Garden, Giza, Egypt and the identification of the plant material was kindly verified by Eng. Therese Labib, consultant of plant taxonomy at Ministry of Agriculture and the former director of El-Orman Botanical Garden, Giza, Egypt. A herbarium (No.21.09.13) is deposited at the Department of Pharmacognosy, Faculty of Pharmacy, Cairo University.
The leaves were collected, air-dried and reduced to fine powder. A sample (2.65 kg) was exhaustively extracted, by percolation, with 70% ethanol. The residue left after evaporation of the solvent was successively fractionated with n-hexane, chloroform, ethyl acetate and n-butanol (6 x 300 mL, each). Whereas another sample of the powdered leaves (50 gm) were used in preparation of the aqueous extract; the powder was macerated 3 times in hot water for fifteen minutes then filtered and the combined filtrates were collected together and evaporated to dryness.
For molecular investigation, a sample of fresh leaves was stored at -70ºC, freeze-dried and ground under liquid nitrogen to a fine powder prior to DNA isolation.
Material and methods for biological study
Experimental animals
Albino mice of 25-30g body weight and adult male albino rats of Sprauge Dawely Strain, weighing 130-150g were obtained from National Research Center, Cairo, Egypt. The animals were kept under the same hygienic conditions and on standard laboratory diet consisting of vitamin mixture (1%), mineral mixture (4%), corn oil (10%), sucrose (20%), cellulose (0.2%), casein (10.5%) and starch (54.3%). Water was supplied ad lib. Animal protocol was approved by the Medical Research Ethics Committee of National Research Center, Giza, Egypt.
Determination of the median lethal dose (LD50)
LD50 of the aqueous and ethanolic extracts of the leaves were separately estimated according to Karber's procedure (15).
Evaluation of anticonvulsant activity
The anticonvulsant activity was determined using the frequency pulse shock current apparatus with width duration (16). The stimulus duration was 0.2 second, the end point was tonic hind limb jump needed to emit a cry. The maximum electric shock was determined. One hour before the experiment, Swiss male albino mice were divided into groups (six for each): the first received 1 mL saline and served as control. The second group was treated with the reference drug carbamazepine (Tegratol®: Swiss Pharma S.A.E., Cairo, under license from CIBA GEIGY limited, Basle, Switzerland) at a dose of 100 mg/ kg b.wt. p.o. The other groups of mice received separately, a single oral dose of 100 mg/kg. b.wt of the tested extracts or fractions, or 20 mg/kg. b.wt of the tested column sub-fractions.
Evaluation of analgesic activity
The analgesic activity was performed using writhing test induced by acetic acid (17). Swiss male albino mice were divided into groups (six for each): the first received 1 mL saline and served as control. The second group was treated with the reference drug indomethacin (EIPICO, Egyptian Int. Pharmaceutical Industries Co, A.R.E. under license of Merck & Co INC_RAHAWY, N.J, U.S.A.) at a dose of 20 mg/ kg b.wt. p.o. The tested extracts or fractions were given, separately to other groups of animals at a dose of 100 mg/ kg b.wt. p.o. Thirty minutes later, 0.6% acetic acid was injected i.p. (0.2 mL/ mice), each mice was then placed in an individual clear plastic observed chamber and total number of writhes/ 30 min was counted for each.
Evaluation of antioxidant activity
The antioxidant activity was calculated by the determination of glutathione in blood of alloxan-induced diabetic rats (18). The method depends on the fact that both protein and non protein SH-groups react with Ellman’s reagent (Biodiagnostic Biomérieux kit, France) to form a stable yellow color, which can be measured at 405 nm. In order to determine glutathione level in blood, precipitation of protein SH- groups was necessary before the addition of Ellman’s reagent. Adult male albino rats were divided into groups (six for each): one group was kept as a negative control while for the other groups, diabetes mellitus was induced, where a single dose of 150 mg alloxan / kg b.wt. (Sigma-Aldrich, Germany) was injected intraperitoneally in each animal followed by an overnight fast (19). A group of diabetic rats was kept non-treated; another group received Vitamin E (PHARCO Pharmaceutical Co.) as reference drug (Vitamin E, 7.5 mg/kg b. wt. p.o.). The other groups of rats received a single oral dose of 100 mg/kg. b.wt of the tested extracts or fractions, separately. The rats were kept one week before the determination of glutathione in blood.
Evaluation of acute anti-inflammatory activity
The hind paw edema method (20) was used for the detection of the anti-inflammatory activity. Male albino rats were divided into groups (six for each): the first received 1 mL saline and served as control. The second group was treated with the reference drug indomethacin (EIPICO, Egyptian Int. Pharmaceutical Industries Co, A.R.E. under license of Merck & Co INC_RAHAWY, N.J, U.S.A.) at a dose of 20 mg/ kg b.wt. p.o. The tested extracts or fractions were given, separately to other groups of animals at a dose of 100 mg/ kg b.wt. p.o. One hour after receiving the tested extracts, hind paw edema was induced in the treated rats by 0.1 mL of 1% carrageenan (Sigma-Aldrich, Germany) injected into the subplantar region of the right hind paw and 0.1 mL saline in the left hind paw. Four hours later, the rats were sacrificed then both hind paws were excised and weighed separately.
Evaluation of antipyretic activity
Male albino rats were divided into groups (six for each): the first received 1 mL saline and served as control. The second group was treated with the reference drug paracetamol (Mist Mataria, Cairo, Egypt) at a dose of 20 mg/ kg b.wt. p.o. The tested extracts or fractions were given, separately to other groups of animals at a dose of 100 mg/ kg b.wt. p.o. The normal rectal temperature of the animals was recorded before starting the experiment. Pyrexia was induced by intramuscular injection of 1mg /100 gm b.wt of 44% yeast suspension; the site of injection was then massaged to spread the suspension beneath the skin. After 18 h, the rectal temperature was recorded for all groups of animals to serve as the base line of elevated body temperature, to which the antipyretic effect will be compared. One and two h after drug administration, other records of rectal temperature was determined (21).
Statistical analysis
The data obtained from the pharmacological study were statistically analyzed using the Student’s t- test (22). All values are expressed as mean+S.E. of a number of experiments (n).
Material and methods for phytochemical study
General
Melting points were uncorrected and measured on a Digital melting point apparatus (Electrothermal 9100 series, U.K.). 1H- NMR (500 MHz) and 13C- NMR (125 MHz) spectra were recorded on Bruker APX-400 NMR-spectrometer (Japan) at 25ºC using TMS as an internal standard and chemical shifts were given in δ values. Mass spectroscopy was done using direct inlet unit (DI-50) of Shimadzu GC/MS-PQ5050A, software class 5000 at ionization mode 70 eV and scan speed 2000 amu/sec with scan interval 0.5 sec. HPLC apparatus used was an Agilent 1100 series HPLC system (Aglilent Technologies, Palo Alto, CA), adapted with a quaternary pump and degasser G1322A, series 1200 and Agilent Chemstations software were used for the chromatographic analysis. The separation was carried out on a Lichrosphere C18 column (250×4 mm id, 5µm) (E-Merck, Germany) maintained at a temperature of 25°C, guarded by a guard column (10×4 mm id, 5 µm). The mobile phase was set: 0-3 min linear gradient program of 15-75% A in B, 3-14 min isocratic 75% A in B and 14-17 min linear gradient 75-15% A in B; A and B being acetonitrile and 0.3% aqueous Ơ-phosphoric acid, respectively at a flow rate of 1.0 mL/min and a total run time of 18 min. The injection volume, column temperature and UV wavelength were fixed at 20µL, 25°C and 325 nm, respectively. Bechman Du-7 and Shimadzu-265 spectrophotometer was used for recording the UV absorption spectra. Silica gel RP-18 (E-Merck, Germany) was used for column chromatography. TLC were conducted on pre-coated silica gel 60 F254 plates (0.25 mm thickness, Flucka, Switzerland), developed with solvent system EtOAc: formic acid: acetic acid: H2O (100:0.5:0.5:1.3). Visualization was accomplished by UV (254/365 nm) for localization of spots and by spraying with aluminium chloride (23) and natural product-polyethylene glycol (24) spray reagents.
Column chromatographic fractionation of the most bioactive fraction
1.5 g of the ethyl acetate fraction (3 x 0.5 g) was chromatographed on Vacuum Liquid chromatographic (VLC) column of RP-18 silica gel (13 cm Lx4 cm D, 25g), eluted, in increasing proportions, with 10-40% MeOH/H2O mixtures. Fractions (100 mL, each) were collected by TLC and HPLC monitoring. Four sub-fractions A, B, C and D were obtained. Part of each sub-fraction was reserved to evaluate its anticonvulsant activity. Sub-fractions A, C and D were subjected to further purification for the isolation of major compounds, while no compounds could be isolated from sub-fraction B due to its minute amount. Sub-fraction A (75 mg) was eluted by 25% MeOH/H2O, it was subjected to rechromatography on the same VLC-RP-18 column, with the same conditions with gradient elution starting with 100% H2O then gradually increasing MeOH (1%, per fraction). Compound 1 (Rt = 5.3 min, Rf = 0.3, 16 mg) was eluted using 13% MeOH/H2O. Sub-fraction C (70 mg) eluted by 31% MeOH/H2O, was similarly subjected to purification on VLC-RP-18 column, with the same conditions as sub-fraction A to afford the isolation of compound 2 (Rt = 7.2 min, Rf = 0.6, 19 mg) upon elution with 17-22% MeOH/H2O. Sub-fraction D (80 mg), eluted by 34-38% MeOH/H2O, was as well purified on VLC-RP-18 column and gave compound 3 (Rt = 9.1 min, Rf = 0.8, 50 mg) by elution with 34-44% MeOH/H2O.
HPLC quantification of chrysin-6-C-β-D-glucoside
A standard calibration curve was constructed through HPLC analysis of different aliquots of chrysin-6-C-β-D-glucoside solution (1 mg/mL, 99.9% purity) in the range of 0.015-0.25 mg/mL, adopting the conditions previously described; chrysin-6-C-β-D-glucoside peak areas were plotted versus concentrations. The concentration of chrysin-6-C-β-D-glucoside (compound 3) in the ethyl acetate fraction (2 mg/mL) was then determined. Results were the average of triplicate determinations.
Material and Methods for Molecular Investigation
Apparatus
DNA thermocycler (Hybaid PCR Express) used for amplification of DNA, agarose gel electrophoresis tool (Biorad Wide Mini Sub Cell) for separation of RAPD fragments according to size and UV Polaroid camera for visualization of RAPD fragments.
Buffer solutions and gel
Extraction buffer: 1.4 M NaCl, M Tris (pH 7.5), 0.02 M EDTA, 2% (w/v) N-cetyl-N, N, N- trimethylammonium bromide (CTAB), 1% (v/v) β-mercaptoethanol (added immediately before use); washing buffer 1: 76% ethanol, 0.2 M Na-acetate; washing buffer 2: 76% ethanol, 10mM NH4O-acetate; TE-buffer: 10mM tris-HCl (pH 8.0), 1 mM EDTA; 10x reaction buffer: 100mM tris (pH 8.3), 500mM KCl, 0.01% (w/v) gelatin, chloroform/isoamyl alcohol 24:1 (v/v), isopropanol, dNTP (Pharmacia, Sweden), Taq DNA polymerase (Perkin-Elmer/Cetus, USA, Advanced Biotechnologies, UK). Agarose gel: 1.8% agarose gel (Sigma-Aldrich, Germany), with running buffer TE buffer, was used for electrophoresis.
Primers and Molecular size marker
Fifteen decamer primers (Operon Technologies Inc., Almeda, California, USA) were used for RAPD analysis with the following sequence: TGCCGAGCTG (OPA-02), AGTCAGCCAC (OPA-03), GACCGCTTGT (OPA-17), AGGTGACCGT (OPA-18), AAAGCTGCGG (OPC-11), GGACTGCAGA (OPE-18), GGACCCAACC (OPD-02), ACCTGAACGG (OPD-06), TTGGCACGGG (OPD-07), AGGGCGTAAG (OPD-16), GAGAGCCAAC (OPD-18), ACCCGGTCAC (OPD-20), GGCACTGAGG (OPG-02), GAGCCCTCCA (OPG-03) and AGCGTCCTCC (OPG-16). Molecular size marker: A 100 bp ladder (Promega Corporation, Madison, USA) was used as standard marker.
DNA extraction and quantification
A sample (50 mg) of the frozen leaves was powdered in liquid nitrogen, extracted with 0.8 mL of extracted buffer and precipitated with isopropanol. The precipitate was washed by washing buffers and dissolved in deionized water (25).
Amplification of RAPD markers: The polymerase chain reactions were carried out with 100 ηg of genomic DNA template following a thermal cyclic program. Amplified products were analyzed by electrophoresis on 1.8% agarose gel and finally stained with ethidium bromide. A molecular size marker was used as standard marker.
Analysis of RAPD data: RAPD bands were treated as presence or absence, without considering their percentage.
Results and Discussion
The percentage yield of the ethanolic extractive and its fractions, n-hexane, chloroform, ethyl acetate and n-butanol of the leaves of Passiflora caerulea L. were 8.67, 0.69, 0.17, 0.16 and 0.13% w/w of dried plant material, respectively; while the percentage yield of the aqueous extract was 20% w/w. The preliminary phytochemical screening demonstrated the presence of carbohydrates and/or glycosides, flavonoids, sterols and/or triterpenes, tannins as well as, traces of saponins and coumarins.
The toxicity study revealed that the LD50 of each of the aqueous and ethanolic extracts of the leaves was more than 5g/kg b.wt., consequently they were considered to be safe (26). The extracts were then, separately subjected to a biological study (each in a dose of 100 mg/kg b.wt., p.o.) to investigate their anticonvulsant, analgesic, antioxidant, anti-inflammatory and antipyretic activities compared to carbamazepine, indomethacin, vitamin E, indomethacin and paracetamol as reference drugs, respectively. Results shown in Table 1 revealed that significant activities were exerted by both aqueous and ethanolic extracts in all performed tests; ethanolic extract being more potent as anticonvulsant, analgesic, acute anti-inflammatory, antipyretic but equally potent to aqueous extract as antioxidant. Accordingly, the ethanolic extract was successively fractionated using n-hexane, chloroform, ethyl acetate and n-butanol and the obtained fractions (each in a dose of 100 mg/kg b.wt., p.o.) were further subjected to the same biological testing. Significant activities were exerted mainly by polar fractions in all tests of the screening; ethyl acetate fraction was the most active, followed by n-butanol then n-hexane and chloroform fractions. In anticonvulsant and antipyretic activities, n-butanol fraction showed same potency as that of ethyl acetate fraction. This is the first report concerning antioxidant, anti-inflammatory and antipyretic activities for the plant under investigation.
Table 1Biological activities of the tested extracts, fractions and subfractions of Passiflora caerulea L. leaves and reference drugs in experimental animals (n=6)
| Anticonvulsant activity | ||||||||||||||
|---|---|---|---|---|---|---|---|---|---|---|---|---|---|---|
| Group of animals | Dose | Volts induced seizures | % Protection | Relative Potency | ||||||||||
| Control | 1ml saline | 2.4±0.1 | -- | -- | ||||||||||
| Carbamazepine | 100 | 11.7±0.9* | 387.5% | 1 | ||||||||||
| Aqueous extract | 100 | 7.9±0.3* | 229.1% | 0.6 | ||||||||||
| Ethanol extract | 100 | 8.3±0.4* | 245.8% | 0.63 | ||||||||||
| Fractions of ethanol extract | n-Hexane fraction | 100 | 3.3±0.1* | 37.5% | 0.1 | |||||||||
| Chloroform fraction | 100 | 3.4±0.1* | 41.6% | 0.1 | ||||||||||
| Ethyl acetate fraction | 100 | 7.4±0.2* | 208.3% | 0.5 | ||||||||||
| n-Butanol fraction | 100 | 7.1±0.1* | 195.8% | 0.5 | ||||||||||
| Subfractions of ethyl acetate fraction | Subfraction A | 20 | 4.2±0.1* | 75% | 0.19 | |||||||||
| Subfraction B | 20 | 3.9±0.1* | 62.5% | 0.16 | ||||||||||
| Subfraction C | 20 | 4.1±0.2* | 70.8% | 0.18 | ||||||||||
| Subfraction D | 20 | 4.9±0.1* | 104% | 0.26 | ||||||||||
| Analgesic activity | ||||||||||||||
| Group of animals | Dose | Number of abdominal Constriction | % inhibition | Relative potency | ||||||||||
| Control | 1 ml saline | 47.6±1.3 | -- | -- | ||||||||||
| Indomethacin | 20 | 18.4±0.3* | 61.3% | 1 | ||||||||||
| Aqueous extract | 100 | 29.5±0.7* | 38% | 0.6 | ||||||||||
| Ethanol extract | 100 | 26.4±0.5* | 44.1% | 0.7 | ||||||||||
| Fractions of ethanol extract | n-Hexane fraction | 100 | 39.2±1.2* | 17.6% | 0.28 | |||||||||
| Chloroform fraction | 100 | 41.3±1.3* | 13.2% | 0.21 | ||||||||||
| Ethyl acetate fraction | 100 | 24.2±0.4* | 49.1% | 0.8 | ||||||||||
| n-Butanol fraction | 100 | 27.5±1.7* | 42.2% | 0.68 | ||||||||||
| Antioxidant activity | ||||||||||||||
| Group of animals | Dose | Blood glutathione (mg %) | % of change | Relative Potency | ||||||||||
| Control | 1 ml saline | 36.3±1.4 | -- | -- | ||||||||||
| Diabetic | 21.4±0.3* | -- | -- | |||||||||||
| Diabetic + Vitamin E | 7.5 | 35.9±1.1* | 67.7 | 1 | ||||||||||
| Diabetic + aqueous extract | 100 | 34.6±0.8* | 61.6 | 0.9 | ||||||||||
| Diabetic + ethanol extract | 100 | 35.1±0.9* | 64 | 0.9 | ||||||||||
| Fractions of ethanol extract | Diabetic + n-hexane fraction | 100 | 28.2±0.7* | 31.7 | 0.46 | |||||||||
| Diabetic + chloroform fraction | 100 | 26.3±0.4* | 22.8 | 0.33 | ||||||||||
| Diabetic +ethyl acetate fraction | 100 | 35.4±1.2 | 65.4 | 0.96 | ||||||||||
| Diabetic+ n-butanol fraction | 100 | 32.9±0.6 | 53.7 | 0.8 | ||||||||||
| Acute anti inflammatory activity | ||||||||||||||
| Group of animals | Dose in mg/kg.b.wt. | % Oedema | ||||||||||||
| Mean ± S.E. | % of change | Relative Potency | ||||||||||||
| Control | 1 ml saline | 61.8±1.7 | -- | -- | ||||||||||
| Indomethacin | 20 | 21.4±0.6* | 65.3 | 1 | ||||||||||
| Aqueous extract | 100 | 29.8±0.7* | 51.7 | 0.8 | ||||||||||
| Ethanol extract | 100 | 24.9±0.4* | 59.7 | 0.9 | ||||||||||
| Fractions of ethanol extract | n-Hexane fraction | 100 | 45.6±1.2* | 26.2 | 0.4 | |||||||||
| Chloroform fraction | 100 | 49.2±1.4* | 20.3 | 0.3 | ||||||||||
| Ethyl acetate fraction | 100 | 27.6±0.3* | 55.3 | 0.84 | ||||||||||
| n-Butanol fraction | 100 | 32.4±1.8* | 47.5 | 0.7 | ||||||||||
| Antipyretic activity | ||||||||||||||
| Group of animals | Dose in mg/gm b.wt. | Induced rise in temperature | Body temperature change | |||||||||||
| One hour | Two hours | Relative Potency | ||||||||||||
| Mean | % of | Mean | % of | |||||||||||
| Control | 1 ml saline | 38.9±0.3 | 39.1±0.4 | 39.4±0.5 | -- | -- | ||||||||
| Paracetamol | 20 | 39.4±0.3 | 37.8±0.1* | 3.3 | 36.9±0.1* | 6.3 | 1 | |||||||
| Aqueous extract | 100 | 39.4±0.4 | 38.7±0.3* | 1.02 | 37.9±0.1* | 3.8 | 0.6 | |||||||
| Ethanol extract | 100 | 39.3±0.5 | 38.5±0.2* | 1.5 | 37.6±0.1* | 4.5 | 0.71 | |||||||
| Fractions of ethanol extract | n-Hexane fraction | 100 | 39.2±0.3 | 38.6±0.4* | 1.27 | 38.2±0.2* | 3 | 0.47 | ||||||
| Chloroform fraction | 100 | 39.5±0.4 | 39.1±0.3* | -- | 38.7±0.2* | 1.7 | 0.26 | |||||||
| Ethyl acetate fraction | 100 | 39.1±0.4 | 38.2±0.2* | 2.3 | 37.8±0.1* | 4 | 0.63 | |||||||
| n-Butanol fraction | 100 | 39.2±0.2 | 38.1±0.2* | 2.5 | 37.8±0.1* | 4 | 0.63 | |||||||
Statistically significant different from control group at p <0.01
A comparative HPLC screening was performed to study the chemical composition of the polar fractions as presented in Figure 1, from which we can conclude a similarity in the presence of major peaks in ethyl acetate and n-butanol fractions (Rt ~ 5-6.5 and 9.1 min.). On the contrary, extra major peaks appeared only in the ethyl acetate fraction (Rt = 7.2 and 12 min.) and other minor peaks with different area percentage were shown in both chromatograms. The resemblance in chromatograms of the two polar fractions may thus explain the likeness –to some extent- in the results of their biological activities.
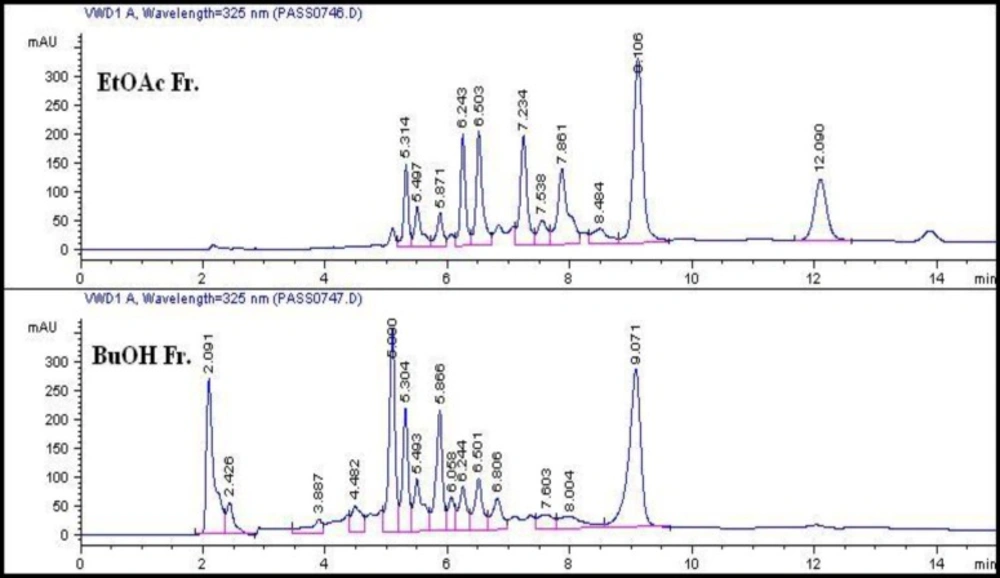
Figure 1.
HPLC chromatograms of ethyl acetate and n- butanol fractions.
The ethyl acetate fraction, being the most bioactive fraction, was subjected to column chromatographic fractionation; a part of each collected sub-fractions A-D was reserved for testing their anticonvulsant activity where the results in Table 1, showed the highest potency for sub-fraction D (26 % of carbamazepine activity) followed by sub-fractions A, C and B with 19, 18 and 16 % of reference drug potency, respectively.
These interesting biological findings stimulated further investigation of the chemical composition of the ethyl acetate fraction on an attempt to identify the constituents responsible for these activities. VLC fractionation resulted in the isolation of three compounds 1-3. Their structures as shown in Figure 2, were elucidated through their physical characters and spectral data, as well as, by comparison with published data of related compounds and then identified as Lucenin II 1 (23, 27, 28). 4-hydroxycinnamic acid 2 (29, 30) and Chrysin-6-C-β-D-glucoside 3 (27).
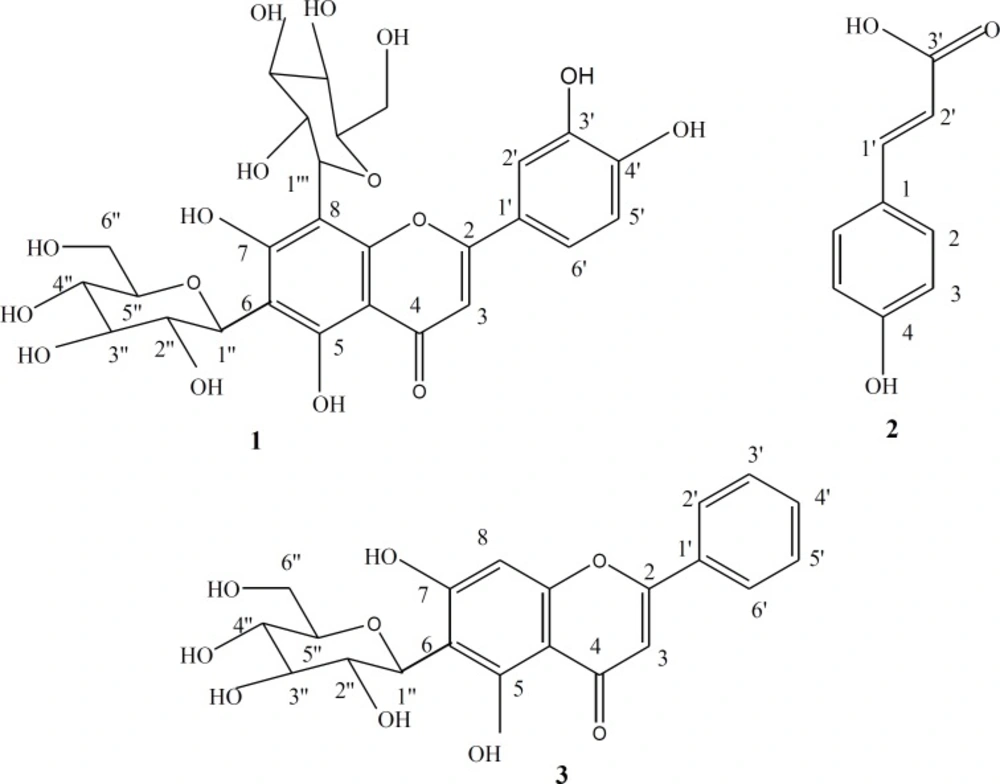
Figure 2
Structures of compounds 1-3
Lucenin II C27H30O16 (1):
Yellow powder, m.p. 245-247ºC, 1H-NMR (500 MHz, DMSO) H (ppm): 7.49 (1H, dd, J = 2.5 Hz, 8.5 Hz, H-6ʹ), 7.44 (1H, d, J = 2.5 Hz, H-2ʹ), 6.87 (1H, d, J = 8.5 Hz, H-5ʹ), 6.7 (1H, s, H-3), 4.97 (1H, br. d, J = 9.8 Hz, H-1ʹʹʹ of 8-glu), 4.7 (1H, d, J = 9.6 Hz, H-1ʹʹof 6-glu), 3.1-3.7 (m, sugar protons). 13C-NMR (125 MHz, DMSO) C (ppm): 182.6 (C-4), 164.2 (C-2), 161.6 ( C-7), 158.3 (C-5), 157.9 (C-9), 150 (C-4ʹ), 147.1 (C-3ʹ), 130.5 (C-1ʹ), 129.16 (C-2ʹ,C-6ʹ), 115.8 (C-5'), 108.9 (C-6), 104.5 (C-10), 105.6 (C-8), 103.15 (C-3), 81.78 (C-5ʹʹ, C-5'''-overlapped), 78.8 (C-3ʹʹ, C-3'''-overlapped), 71.3 (C-1ʹʹ, C-1'''-overlapped ), 70.8 (C-2ʹʹ, C-2''' –overlapped), 70.6 (C-4ʹʹ, C-4''' –overlapped), 60.6 (C-6ʹʹ, C-6''' -overlapped).
4-hydroxycinnamic acid C9H8O3 (2):
Yellowish white powder, m.p. 214-216ºC, 1H-NMR (500 MHz, MeOD) H (ppm): 7.54 (2H, d, J = 8.6 Hz, H-2,6), 7.19 (1H, d, J = 15.9 Hz, H-1ʹ; b-position), 6.89 (2H, d, J = 8.6 Hz, H-3,5), 6.34 (1H, d, J = 15.9 Hz, H-2ʹ; a-position). 13C-NMR (125 MHz, MeOD) C (ppm): 170.8 (C-3ʹ; -COOH), 158.6 (C-4), 138.6 (C-1ʹ), 129.0 (C-2, C-6), 126.9 (C-1), 115.8 (C-3, C-5), 114.7 (C-2ʹ).
Chrysin-6-C-β-D-glucoside C21H20O9 (3):
Pale yellow powder, m.p. 275-277ºC, 1H-NMR (500 MHz, DMSO) H (ppm): 8.05 (2H, d, J = 6.85Hz, H-2ʹ, H-6ʹ), 7.56 (3H, m, H-3ʹ, 4ʹ, 5ʹ), 6.52 (1H, s., H-8), 4.5 (1H, d, J = 9.9 Hz, H-1ʹʹ), 3.1-3.7 (m, sugar protons). 13C-NMR (125 MHz, DMSO) C (ppm): 181.68 (C-4), 162.8 (C-2, 7), 161.3 (C-5), 156.6 (C-9), 132 (C-4ʹ), 130.5 (C-1ʹ), 129.16 (C-2ʹ, 6ʹ), 126.4 (C-3ʹ, 5ʹ), 109.5 (C-6), 104.5 (C-10), 100.15 (C-3), 93.78 (C-8), 81.78 (C-5ʹʹ), 79.6 (C-3ʹʹ), 72.2 (C-1ʹʹ), 71.15 (C-2ʹʹ), 70.8 (C-4ʹʹ), 60.22 (C-6ʹʹ).
It is worthy to say that 4-hydroxycinnamic acid was for the first time isolated from this plant.
The activity of the ethyl acetate fraction, as anticonvulsant, may consequently be attributed, at least in part, to the presence of compounds 1-3. This assumption is in conformity to literature since it was previously demonstrated the occurrence of benzodiazepine (BZD) – like compounds in P. caerulea (31) and it was also verified that Chrysin was one of these compounds, having moderately high affinity to central BZD receptors and medium to low affinity for the peripheral BZD receptors, thus displayed anticonvulsant properties when tested in vivo (7).
The presence of the C-glycosyl flavones viz. Lucenin II 1 and Chrysin-6-C-β-D-glucoside 3 also composed a major contribution to the antioxidant (9) and anti-inflammatory effects of the polar fractions (12, 32). In addition, hydroxycinnamic acids are well recognized as antioxidants (33, 34); research reports have revealed that hydroxycinnamic acids can be used for prevention and treatment of several disorders associated to oxidative stress such as cancer, injuries, atherosclerosis and cardiovascular diseases (35); accordingly, 4-hydroxycinnamic acid 2 is assumed to potentiate the activity exerted by the C-glycosyl flavones. On the other hand, we cannot exclude other unidentified minor components from participation in activities.
No HPLC method for quantification has so far been reported on P. caerulea leaves, so the study focused on the isolation and determination of chemical markers from the bioactive fraction; HPLC quantification revealed that Chrysin-6-C-β-D-glucoside was the major compound in the ethyl acetate fraction, amounting to 0.0184 g % w/w of the dried leaves. The developed method exhibited distinct linearity between the peak area and the concentration over the range of 0.015-0.25 mg/mL with a correlation coefficient (R2) of 0.9996. Linear regression equation was found to be: y= 13124 x – 9.0843 where y is the peak area and x is the concentration in mg/mL.
Moreover, the DNA of P. caerulea when amplified using fifteen decamer primers, 106 RAPD fragments have been recorded and treated as presence or absence, without considering their percentage. Results, presented in Table 2 and Figure 3 revealed the presence of 11 bands by OPG-03 ranging from 1.5 to 0.3 Kbp, 9 bands by each of OPA-02 (1.5 - 0.42 Kbp), OPC-11 (2 - 0.32 Kbp), OPD-02 (1.5 - 0.45 Kbp), OPD-18 (2.5 - 0.2 Kbp) and OPD-20 (2 - 0.55 Kbp), 8 bands by OPA-03 (2 - 0.3 Kbp), 7 bands by each of OPA-18 (1.2 - 0.55 Kbp), OPD-16 (1.5 - 0.5 Kbp) and OPG-16 ( 1.5 - 0.4 Kbp), 6 bands by OPE-18 (2 - 0.32 Kbp), 5 bands by OPA-17 (1.5 - 0.5 Kbp), 4 bands by each of OPD-07 (1.05 - 0.75 Kbp) and OPG-02 (1.5 - 0.6 Kbp), 2 bands by OPD-06 (0.75 - 0.7 Kbp). The analysis of RAPD data, under the experimental conditions, can be used in control analysis and to distinguish the plant from other species.
Table 2Molecular size in base pairs of amplified DNA fragments produced by fifteen decamer primers in Passiflora caerulea L.
| Band | Primer codes | ||||||||||||||
|---|---|---|---|---|---|---|---|---|---|---|---|---|---|---|---|
| OPA-02 | OPA-03 | OPA-17 | OPA-18 | OPE-18 | OPC-11 | OPD-02 | OPD-06 | OPD-07 | OPD-16 | OPD-18 | OPD-20 | OPG-02 | OPG-03 | OPG-16 | |
| 200 | - | - | - | - | - | - | - | - | - | - | + | - | - | - | - |
| 250 | - | - | - | - | - | - | - | - | - | - | - | - | - | - | - |
| 300 | - | + | - | - | - | - | - | - | - | - | - | - | - | + | - |
| 320 | - | - | - | - | + | + | - | - | - | - | - | - | - | - | - |
| 400 | - | - | - | - | - | + | - | - | - | - | - | - | - | + | + |
| 420 | + | - | - | - | - | + | - | - | - | - | - | - | - | - | - |
| 450 | - | - | - | - | - | - | + | - | - | - | - | - | - | - | + |
| 500 | + | - | + | - | - | - | + | - | - | + | + | - | - | - | - |
| 550 | - | - | - | + | - | - | - | - | - | - | - | + | - | + | - |
| 600 | + | + | - | - | - | - | + | - | - | - | + | + | + | + | + |
| 650 | - | - | - | + | + | - | + | - | - | - | - | - | - | + | - |
| 700 | + | + | + | + | - | - | - | + | - | + | - | - | - | - | - |
| 750 | - | - | - | - | - | + | - | + | + | - | + | - | + | + | + |
| 800 | + | - | + | + | - | - | + | - | - | - | - | - | - | - | - |
| 850 | - | + | - | - | - | + | - | - | + | - | - | + | - | + | + |
| 900 | + | - | - | - | - | - | + | - | - | + | + | - | - | - | + |
| 920 | - | + | - | + | - | + | - | - | - | - | - | + | - | - | - |
| 950 | - | - | - | - | + | - | + | - | + | - | - | - | - | + | - |
| 1000 | + | - | - | - | - | - | - | - | - | + | - | + | - | - | - |
| 1050 | - | - | - | - | + | + | + | - | + | - | + | - | - | - | - |
| 1100 | - | + | - | + | - | - | - | - | - | - | + | - | - | + | - |
| 1150 | + | - | - | - | - | - | - | - | - | + | - | + | + | - | - |
| 1200 | - | - | + | + | - | - | - | - | - | + | - | + | - | + | - |
| 1500 | + | + | + | - | + | + | + | - | - | + | + | + | + | + | + |
| 2000 | - | + | - | - | + | + | - | - | - | - | - | + | - | - | - |
| 2500 | - | - | - | - | - | - | - | - | - | - | + | - | - | - | - |
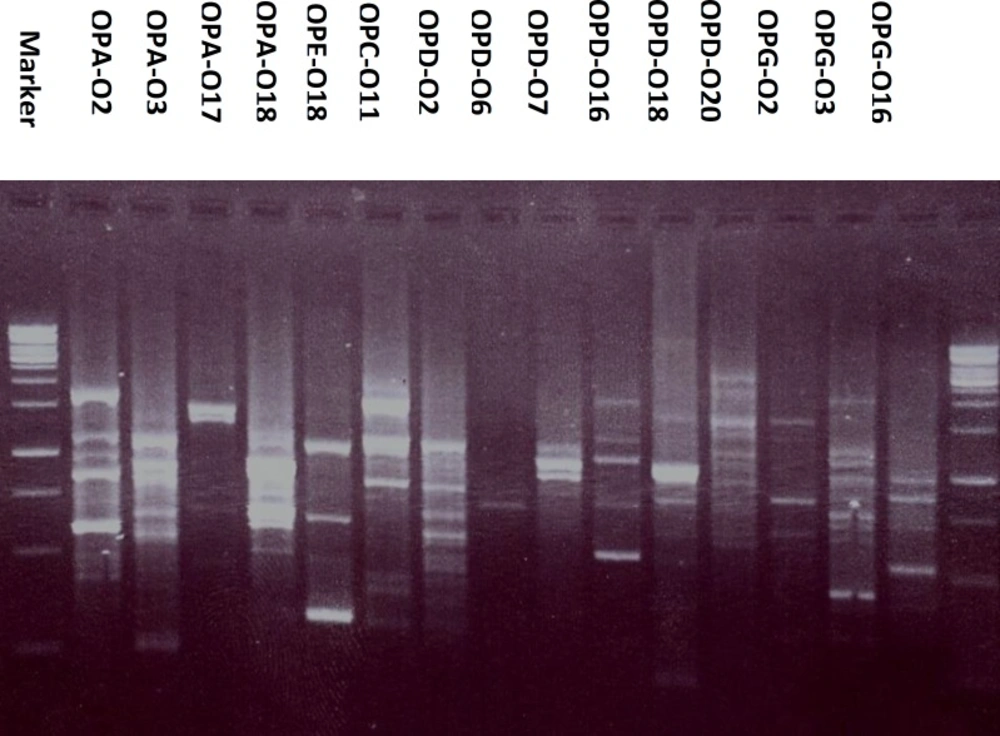
Figure 3
The RAPD electrophoretic profile of Passiflora caerulea L. generated by fifteen decamer primers
Conclusion
Both aqueous and ethanolic extracts of the leaves of Passiflora caerulea L. demonstrated significant anticonvulsant, analgesic, antioxidant, anti-inflammatory and antipyretic activities; however, clinical studies are required to evaluate their effects on patients. Three compounds 1-3 were isolated from the bioactive ethyl acetate fraction; the activity was assumed to be related -at least in part- to the major constituent, Chrysin-6-C-β-D-glucoside that was then quantified by HPLC. Moreover, the genetic characterization was performed for the authentication of the plant under investigation.

