Animals
Healthy male albino Wistar rats (290 ± 20 g) were used in this study. They were housed in standard polypropylene cages, six per cage, under a 12 h light/dark cycle in temperature of
22 ± 2 °C with 50±10% relative humidity. The animals were given food and water freely. The present study was performed in accordance with the Guide for the Care and Use of Laboratory Animals of Tabriz University of Medical Sciences, Tabriz, Iran (National Institutes of Health Publication No. 85-23, revised 1985).
Plant material
The aerial parts of S. frigida were freshly collected from Mishodagh mountain place located in 15 km of south of Marand in Eastern Azerbaijan province (Iran) in September of 2013. After final botanical identification, the voucher specimen with herbarium number of Tbz-FPh-746 was retained in the School of Pharmacy, Tabriz University of Medical Sciences, Iran.
Extraction
The fresh aerial parts of S. frigida (100 g) were extracted with 1.1 L of n-hexane, dichloromethane (DCM) and MeOH by Soxhlet apparatus. To yield a dry and concentrated extracts, rotary evaporator was used to remove solvents. Among the crude extracts, brownish MeOH extracted sap was kept in refrigerator at 4 °C in sterile screw capped containers until use.
Phytochemical analysis
Extracts were tested to identify the existence of active chemical groups such as flavonoids, tannins and iridoids, following standard procedures (
16,
22,
23).
Test for Tannins and phenolic compounds
Amount of 5% FeCl
3 solution was added to tubes of extracts in the presence of tannins. Dark green color was appeared (
24).
Tests for flavonoids
(Shinoda test)
Drop wise of concentrated HCL with extract solutions was mixed, then one piece of Magnesium ribbon added which was accelerated the speed of color changes to red.
Test for iridoids
1mL of Trim-Hill reagent was added to the concentrated extract and then was heated for a few minutes. A blue-green or red color indicated the presence of iridoids.
Determination of total phenolic content (TPC)
Determination of total phenolic constituents of MeOH extract was evaluated using slight modified Folin- Ciocalteau`s test (
21). This method is based on the reducing capacity of Folin- Ciocalteau`s reagent in producing blue color in the samples containing polyphenols. Briefly, 1 mL of prepared extract (5 mg in aqueous acetone 60%) was mixed with 2 mL Folin-ciocalteu reagent and 1 mL of aqueous Na
2CO
3. Afterwards the complex mixture was centrifuged in 1200 rpm for 5 min. After incubation at room temperature for 30 min, absorbance of transparent upper mixture was measured at 750 nm using UV spectrophotometer (Pharmacia biotech Ultrospec 2000, UV/Visible spectrophotometer, England) against control (reagent with no extract) for the quantitative phenol estimation. All the process were repeated for different concentrations of gallic acid solution which were previously prepared from 1mg/mL (acetone: water 60:40) of gallic acid stock as a standard. The calibration curve was prepared using the value of absorbance vs. different concentrations. TPC were expressed in terms of gallic acid equivalent (GAE; mg of gallic acid/ g of extract) as an ordinary reference compound.
Determination of Total flavonoid contents (TFC(
Total flavonoid constituents of the extract was assessed leading a modified assay (
25). Concisely, 2 mL of all sample (previously was dissolved in 80% methanol) was mixed with 400 µl of distilled water and 1 mL of AlCl
3 reagent (133 mg crystalline AlCl
3 plus 400 mg crystalline sodium acetate in 100 mL of 80% methanol). Thereafter mixtures were allowed to remain at room temperature for 30 min. The absorbance of the reaction mixtures was read at 430 nm vs. blank, spectrophotometrically. Dilutions of quercetin in 5-25 µg/mL of 80% methanol were prepared in the same way and were applied to calculate calibration curve in order to determine the flavonoid quantity. Finally TFC was expressed as quercetin equivalents (mg/ g of extract).
Determination of Free-radical-scavenging activity in-vitro
Antioxidant activity of the extract was assessed using the 2, 2-diphenyl-1-picrylhydrazyl (DPPH) obtained from Sigma Aldrich Company. The DPPH assay was carried out as described by Takao
et al (
20). Stock solutions of the extract was prepared as 1 mg/mL in MeOH .Serial dilutions were made to obtain concentrations of 5×10
-1, 2.5×10
-1, 1.25×10
-1, 6.25×10
-2, 3.13×10
-2 and 1.56×10
-2 mg/ml. Diluted solutions of extract (5 mL each) were mixed with 0.08 mg/mL DPPH solution (5 mL) and allowed to stand for 30 min for occurring any reaction. The UV absorbance was recorded at 517 nm. The experiment was done in triplicate and the inhibition percent of free radical DPPH in percent (I %) was calculated in the following way:
I% = (A blank – A sapmle)/ A blank × 100
Where A blank is the absorbance of the negative control (containing all the reagents except the extract), and A sapmle is the absorbance of the test samples. Extract concentration providing 50% inhibition (IC50) was calculated. Quercetin was used as positive control.
Preparation of isolated heart perfusion
Preparation of isolated heart perfusion was performed as previously described (
26) with minor modifications. Male Wistar rats were heparinized (1000 IU/kg; i.p.) and then anesthetized with ketamine/xylasin (60 / 10 mg/kg; i.p.). When the rats didn’t responded to external stimuli, the surgery for harvesting the heart was done. Harvested heart was transferred as soon as possible to a dish containing ice cold modified Krebs–Henseleit buffer (K/H) and mounted immediately to the langendorff apparatus (ML176-V Langendorff Apparatus, ADInstruments, Australia). The hearts were perfused at a constant pressure (80 mmHg) with a K/H containing NaCl 125, KCl 4.3, KH
2PO
4 1.1, MgCl
2. 6H
2O 1.3, CaCl
2. 2 H
2O 2.4, NaHCO
3 25, and glucose 13.32(in mmol/l). The perfusate was gassed with carbogen (5% CO
2/95% O
2) to set the pH in 7.38-7.56 at 37°C.
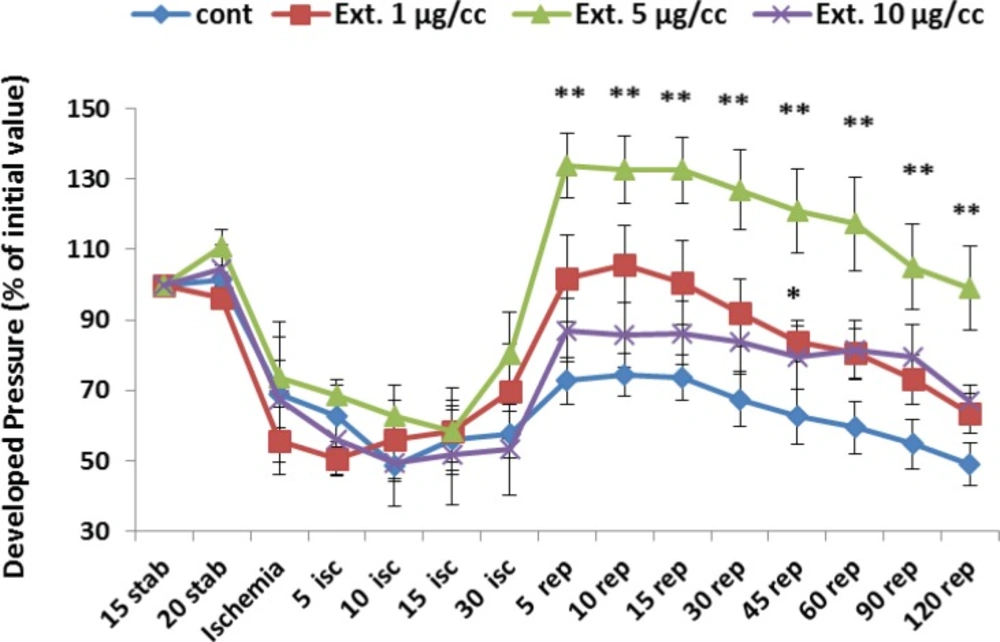
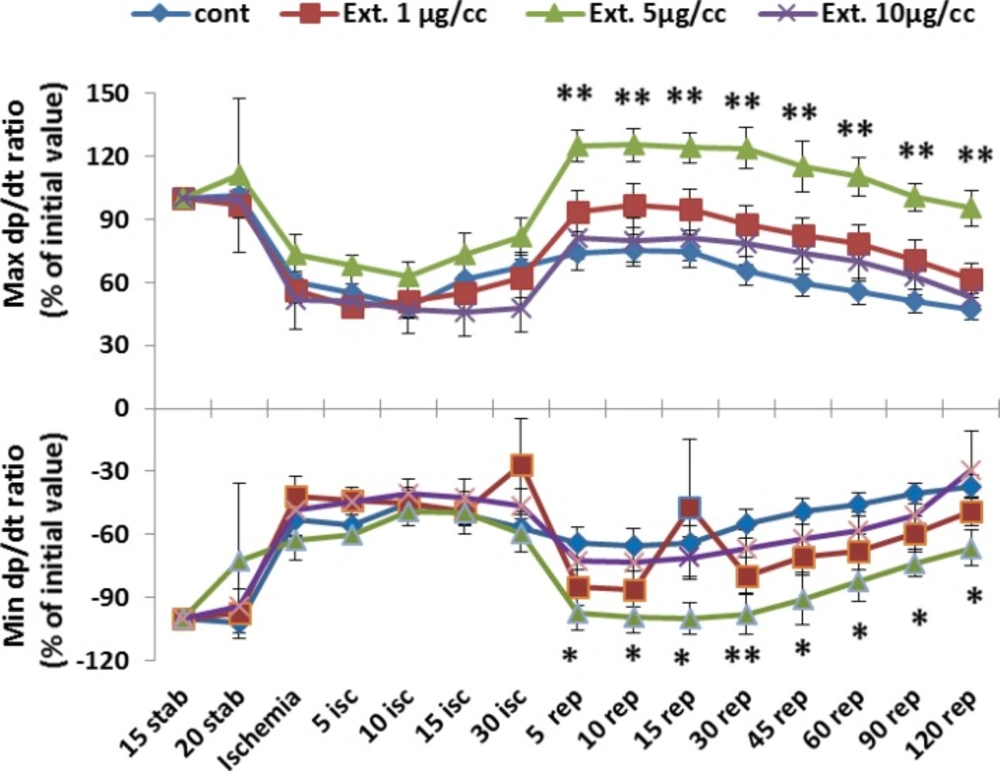
When the harvested heart was mounted to the apparatus, the suture by 6.0 silk surgical is put in place around the left anterior descending artery (LAD) and formed to make a snare. During ischemia, the snare is tightened around LAD and loosed during reperfusion. To measure left ventricular contractility, a latex balloon attached to a pressure transducer (MLT844 physiological pressure, ADInstruments, Australia) was inserted into the left ventricular cavity via the mitral valve after removing the atrial appendage.
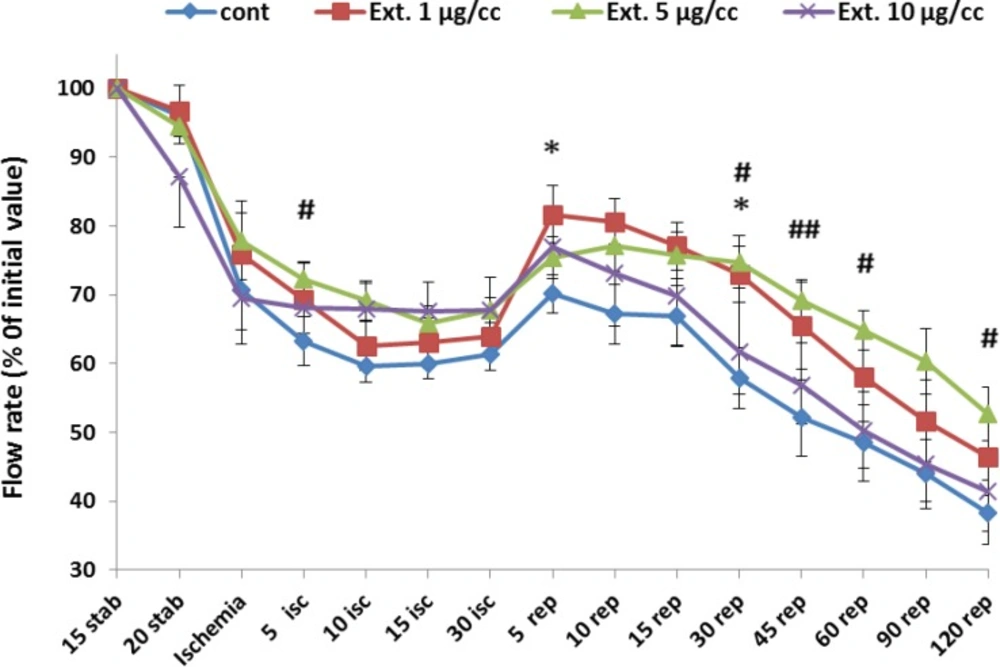
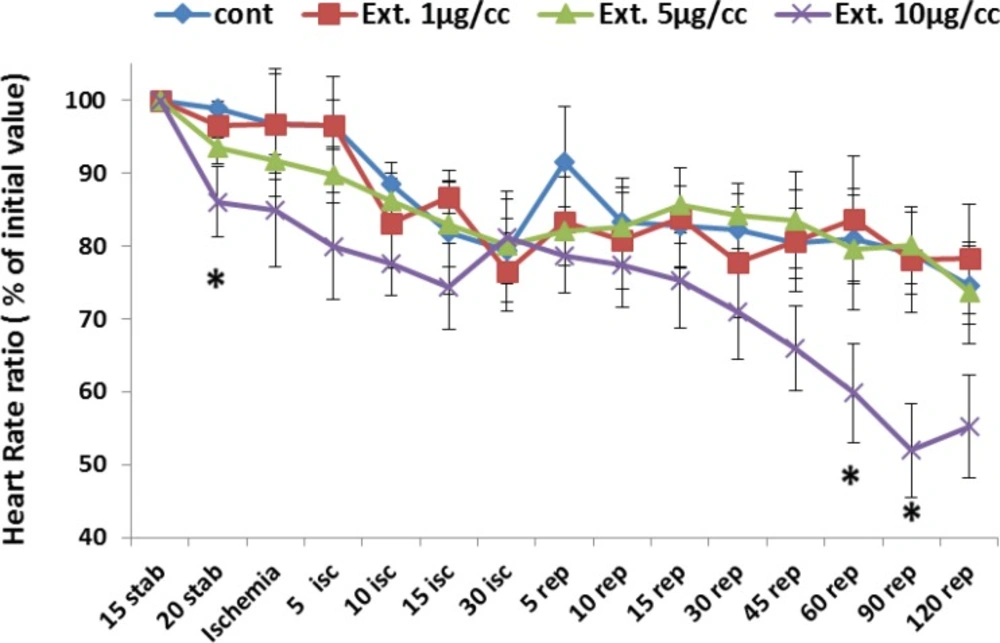
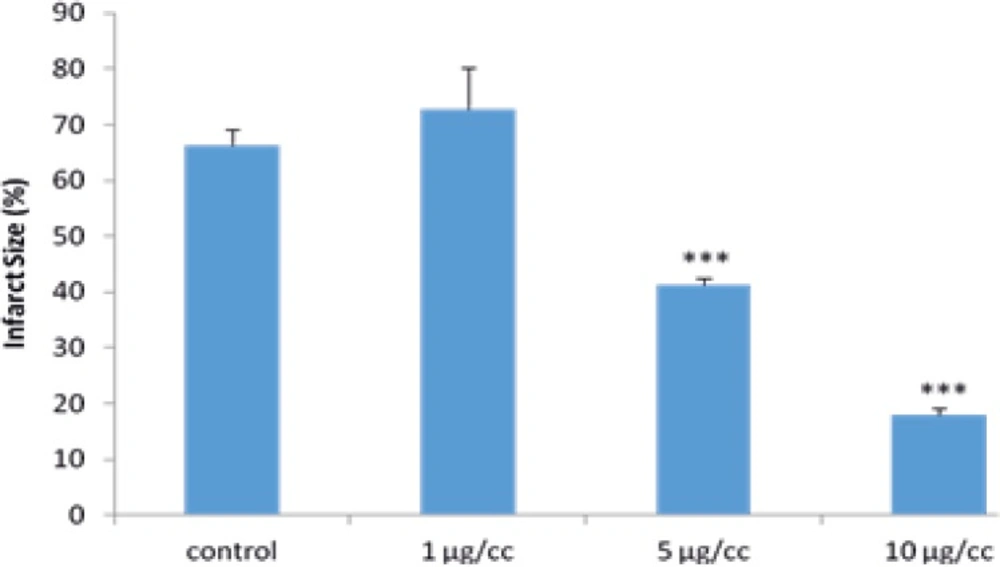
After stabilization period (15 min) with infusion by K/H, time was set to zero and K/H without or with extract (1, 5, and 10 µg/cc in separate groups) was infused 5 min before occlusion and maintained for duration of the experiment.
Measurement of myocardial infarct size
According to Bell
et al (
26) study with some modification, to determine the infarct size double staining strategy was used. At the end of 120 min reperfusion period, the ligature around the LAD artery re-tied. The cannulated heart was detached and perfused slowly by 1 mL Evans blue dye (0.25% w/v) via aortic cannula. Then the heart was stored at -20 °C. For second staining the frozen heart was sliced from apex to base (into 1-2 mm sliced). The slices incubated with 1% (w/v) triphenyltetrazolium chloride (TTC) solution in phosphate buffer for 15 min at 37 °C to dye the non–infarcted region. At the end, the slices were fixed in 10% formalin overnight. This procedure resulted in the normally perfused tissue being stained blue, non-infarcted and non-perfused tissue stained brick red, infarcted tissue remaining unstained and appeared pale. Digitally photographed sliced were imported to Image J software (Wayne Rasband, National Institute of Health, USA) and infarct size was computed.
Statistical analysis
Except for the incidence of ventricular tachycardia (VT) and ventricular fibrillation (VF) that indicated as percentage, all results expressed as mean± SEM. To compare the number of VT, ventricular ectopic beats (VEBs), duration of VT and VF between groups and the percentage of infarct size and all hemodynamic factors, the Mann-Whitney non-parametric U-test were employed. Analyzing the incidence of VT and VF was accomplished by Fisher test. Differences were considered significant at a level of P< 0.05.