Cell lines & drugs
Human prostate cancer cell lines LNCaP (androgen receptor-positive; androgen-dependent) and PC-3 (androgen receptor-negative; androgen-resistant) were obtained from the National Cell bank of Iran (NCBI) and cultured in RPMI 1640 medium supplemented by 10% fetal bovine serum (FBS), penicillin G (100 IU/mL) and streptomycin (100 µg/mL). The cells were maintained at 37 °C in a humidified atmosphere in the presence of 5% CO2. All studies were done with cells at 70 to 80% confluence. Paclitaxel and noscapine were purchased from Sigma-Aldrich Co., USA .The drugs were dissolved in dimethyl sulfoxide (DMSO) and stored at −20 °C as a stock solution. The final concentration of DMSO in culture medium was 0.1% which was always nontoxic.
Cell treatment
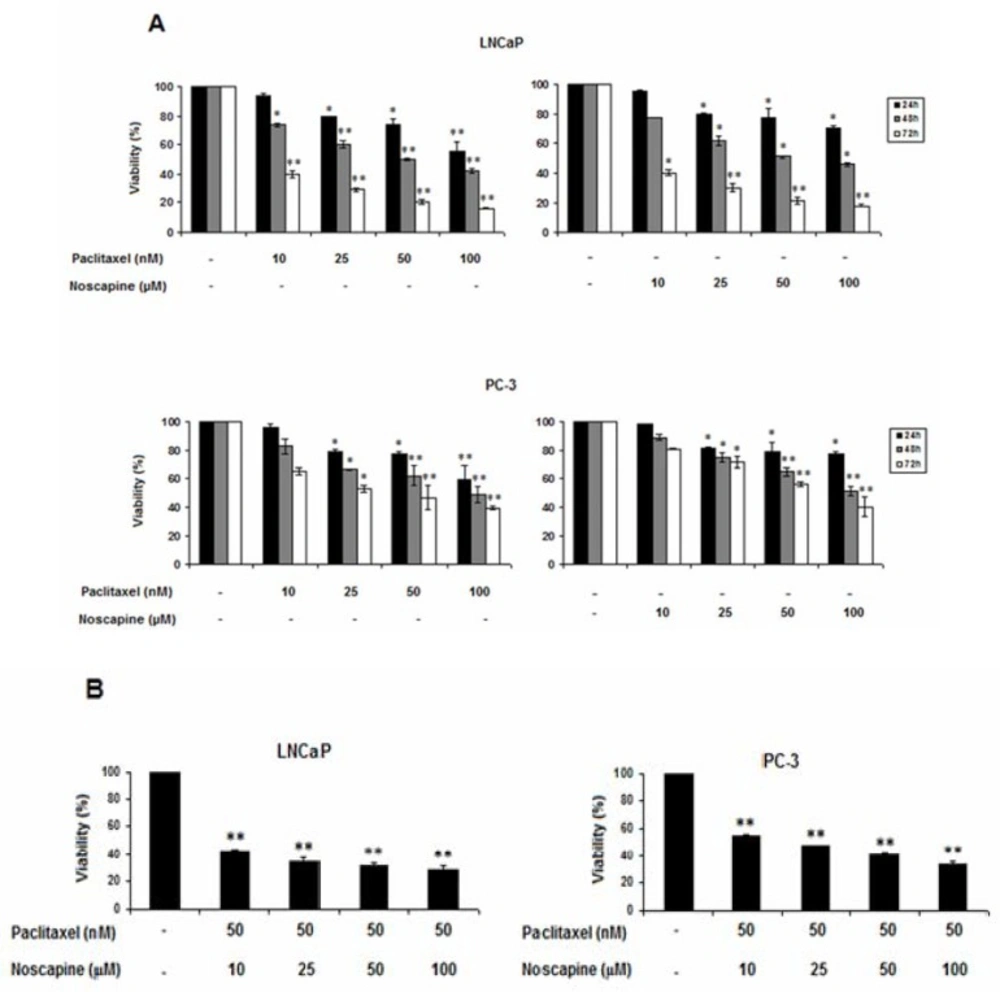
LNCaP and PC-3 cell lines were seeded in 96-well plates, at a density of 2×10⁴ cells/well. After 24 h the cells were treated with various dilutions of paclitaxel (10, 25, 50 and 100 nM) or noscapine (10, 25, 50 and 100 μM) from stock solutions in DMSO for 24, 48, and 72 h.
In another set of experiments, the cells were treated with 50 nM Paclitaxel in combination with different concentrations of noscapine (10, 25, 50 and 100 μM) for 48 h, and untreated cells were served as control.
Cell viability assay
LNCaP and PC-3 cells viability was assessed by Cell proliferation kit I (MTT[3-(4,5-dimethylthiazol-2-yl)-2, 5-diphenyltetrazolium bromide]) Roche, GmbH, Germany) according to the manufacturer’s protocol. Briefly, 2×10⁴ cells were plated in 96-well plates and exposed to serial concentrations of paclitaxel (10, 25, 50 and 100 nM) or noscapine (10, 25, 50 and 100 μM) for 24, 48, and 72 h. A separate study was done to find out the growth inhibitory effects of various concentration of noscapine (10, 25, 50 and 100 μM) on IC50 value (50 nM) of paclitaxel on LNCaP and PC-3 cells after 48 h. Each experiment was carried out at least in triplicate. All experiments were done at least in triplicate wells and the assays were repeated independently three times.
The viability assay is based on the cleavage of yellow tetrazolium salt to purple formazan crystals by metabolic active cells (
24). After the treatment periods, 10 µL of yellow MTT solution (final concentration 0.5 mg/mL) was added to each well and incbated at 37 °C in 5% CO
2 for 4 h the purple formazan salt crystals were dissolved by adding solubilization solution. The absorbance of the samples was measured at 570 nm using a microplate (ELISA) reader (Stat fax 2100, USA). Cell viability calculated as the ratio of absorbance of treated groups divided into the absorbance of control group, multiplied by 100 to achieve a viability percent.
Cell death assay
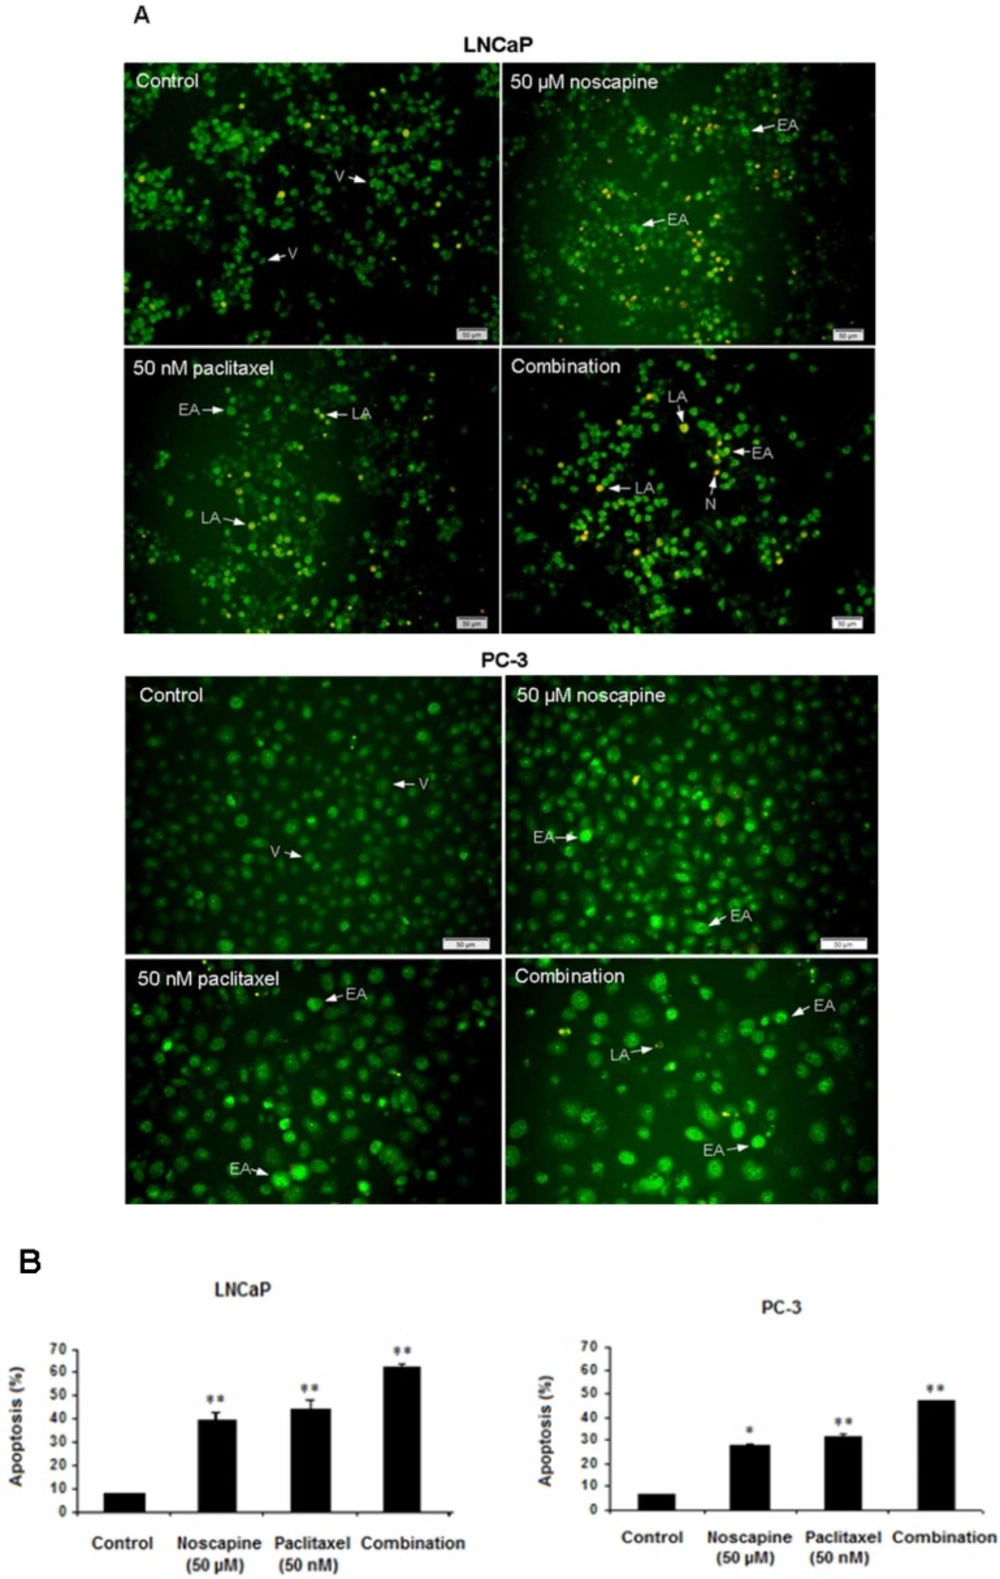
LNCaP and PC-3 cells were treated with 50 nM paclitaxel, or 50 μM noscapine or combination for 48 h, and untreated cells were used as control. Treatments-induced apoptosis was carried by AO/EB (acridine orange/ ethidium bromide) double staining assay as previously described (
25). Acridine orange is taken up by both viable and nonviable cells and emits green fluorescence if interrelated into double stranded nucleic acid (DNA). Ethidium bromide is taken up only by nonviable cells and emits red fluorescence by intercalation into DNA. We distinguished four types of cells according to the fluorescence emission and the morphological aspect of chromatin condensation in the stained nuclei.
Viable cells have uniform bright green nuclei with organized structure. Early apoptotic cells (which still have intact membranes but have started to undergo DNA cleavage) have green nuclei, but perinuclear chromatin condensation is visible as bright green patches or fragments. Late apoptotic cells have orange to red nuclei with condensed or fragmented chromatin. Necrotic cells have a uniformly orange to red nuclei with condensed structure. The amount of 100 µL of dye mixture (100 µg/mL AO and 100 µg/mL EB in PBS) was added to cells in 96-well plate. The cells were viewed under a fluorescence microscope (Olympus, IX71). A minimum of 200 cells were counted in each sample.
RNA isolation and RT-PCR (reverse transcription polymerase chain reaction)
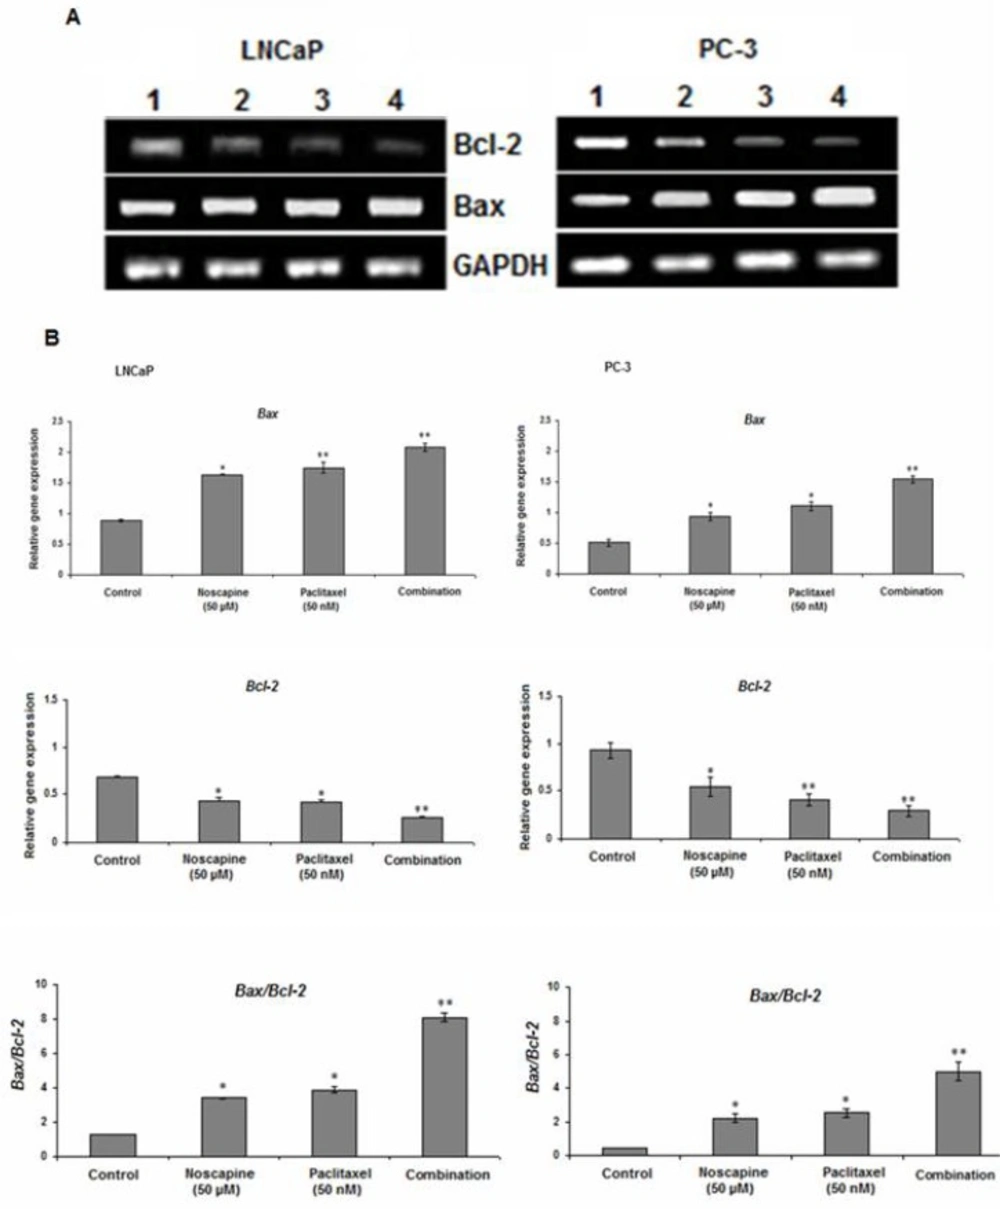
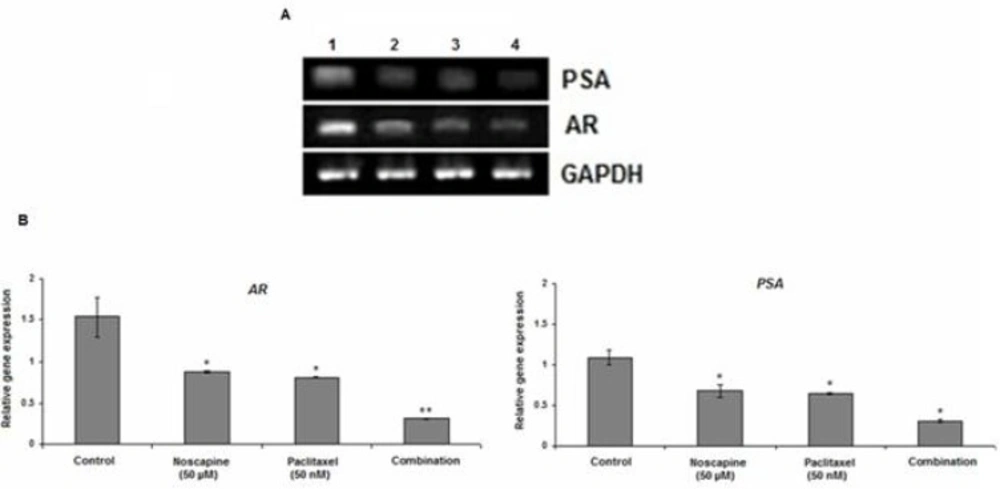
LNCaP and PC-3 cells were treated with 50 nM paclitaxel or 50 μM noscapine and combination for 48. Untreated cells were used as control. The mRNA expression of Bax and Bcl-2 was determined by Relative RT-PCR. The cells were harvested by trypsinization, washed three times, and pelleted by centrifugation. Total RNA was extracted using RNA purification kit (Jena Bioscience, GmbH, Germany). cDNA synthesis was performed by 0.5 μg of total RNA with AccuPower® RocketScriptTM RT PreMix kit (Bioneer, Korea) with oligo dT and random hexamer primers in a volume of 20 µL. PCR was performed using oligonucleotide specific primers for Bax, Bcl-2, AR, PSA.GAPDH (glyceraldehyde-3-phosphate dehydrogenase) was used as an internal control. Amplification was performed by using the following primers:
Bax forward primer 5´-GGGGACGAACTGGACAGTAA-3´, Reverse primer 5´-CAGTTGAAGTTGCCGTCAGA-3´ (GenBank accession no. NM_004324.3);
Bcl-2 forward primer 5´-ATGTGTGTGGAGAGCGTCAA-3´, reverse primer 5´ -ACAGTTCCACAAAGGCATCC-3´(GenBank accession no. NM_000633.2 (;
AR forward primer 5´- CCTGGCTTCCGCAACTTACAC-3´, reverse primer 5´- GGACTTGTGCATGCGGTACTCA-3´(GenBank accession no. NM_001011645.2);
PSA forward primer 5´- ACCAGAGGAGTTCTTGACCCCAAA-3´, reverse primer 5´- CCCCAGAATCACCCGAGCAG-3´ (GenBank accession no. NM_001648.2).
GAPDH forward primer 5´-CAGCCTCAAGATCATCAGCA-3´, reverse primer 5´- TGTGGTCATGAGTCCTTCCA-3´ (GenBank accession no. NM_002046.4).
PCR reactions were carried out in total volumes of 20 µL using PCR PreMix kit (Bioneer, Korea) according to the manufacturer’s instructions with an AG PCR system (Eppendorf, Hamburg, Germany). The cycling conditions were as follows: initial denaturation at 94 ºC for 10 min, followed by 30 cycles of denaturation at 94 ºC for 1 min, 59 ºC (GAPDH), 60 ºC (Bax and Bcl-2), 66 ºC (PSA), 67 ºC (AR) annealing for 1 min and extension at 72 ºC for 1 min, with a final extension at 72 ºC for 10 min, following a 4 °C incubation for 10 min.
Relative RT-PCR analysis
The mRNA expression of Bax, Bcl-2, PSA, and AR was quantified against the housekeeping gene (GAPDH). The PCR products were visualized by electrophoresis on 1.5% agarose gels followed by ethidium bromide staining (1 µg/mL) and photographed on an ultraviolet transilluminator (UVIdoc; Uvitec, Cambridge, UK). Gel images were analyzed using the Uvitec program. Relative RT–PCR values were presented as a ratio of the density of bands divided by density of GAPDH bands. Each experiment was repeated at least three times.
Statistical analysis
Results were obtained through at least three separate experiments. One-way ANOVA test was performed to determine the significance of differences among groups using SPSS statistical software (version 16.0 SPSS Inc.). All data are shown as means ± SEM. and values of P<0.05 were considered significant.