Characterization of dextran-spermine
Reductive-amination technique was performed to conjugate spermine to oxidized dextran and resulting polycation was assessed via TNBS, H-NMR and elemental analysis methods. The primary amine content of dextran-spermine conjugate in borate buffer was 0.83 mmol/g which is comparable with those reported in literature (
28,
29).
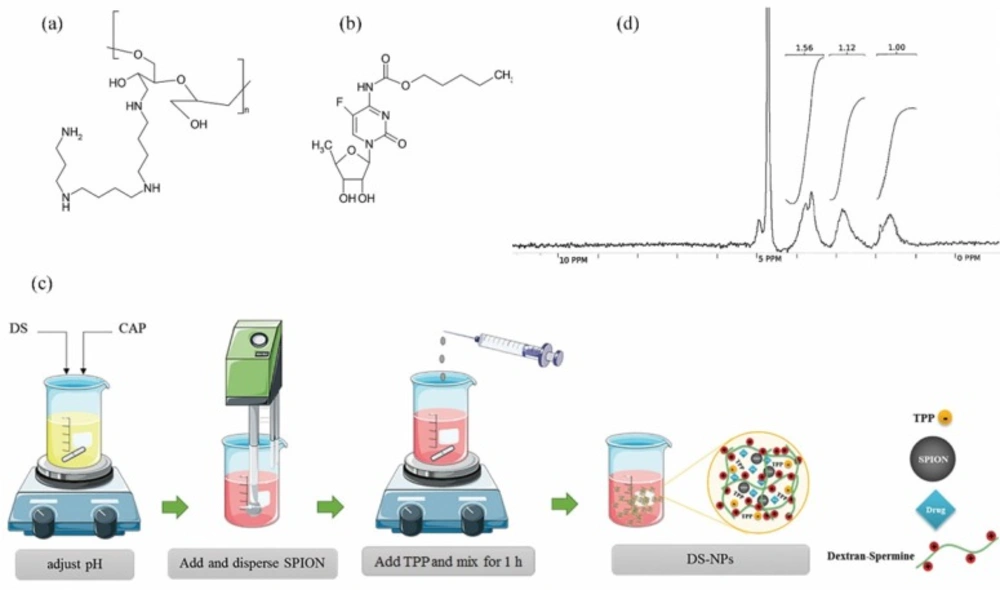
Elemental analysis was carried out for qualitative and quantitative determination of the amine group coupling to oxidized dextran. Only carbon (40.73%) and hydrogen (5.67%) atoms exist in pure oxidized dextran structure. So, the nitrogen is integrated in the dextran structure by conjugating the spermine to the oxidized dextran. Nitrogen proportion for DS was estimated to be 7.38% compare to 10.84% reported in literature (
29). The H-NMR spectra were as follow: 1.63 (m, 4H, dextran-CH
2NH (CH
2)
3NHCH
2CH
2CH
2CH
2NH(CH
2)
3NH
2), 1.77 (m, 4H, dextran-CH
2NHCH
2CH
2CH
2NH (CH
2)
4NHCH
2CH
2CH
2NH
2), 2.79 (m,12H, dextran-CH
2NHCH
2CH
2CH
2NHCH
2 (CH
2)
2CH
2NHCH
2CH
2CH
2NH
2), 3.10-4.22 (m, sugar hydrogens) and 4.71 (m, 1H, anomeric hydrogens of sugars) and the H-NMR image is shown in
Figure 1d.
Chemical structure of dextran-spermine (a) and capecitabine (b); schematic diagram for preparation of capecitabine loaded magnetic dextran-spermine nanoparticles (DS-NPs) (c) and H-NMR spectra of synthesized dextran-spermine (d
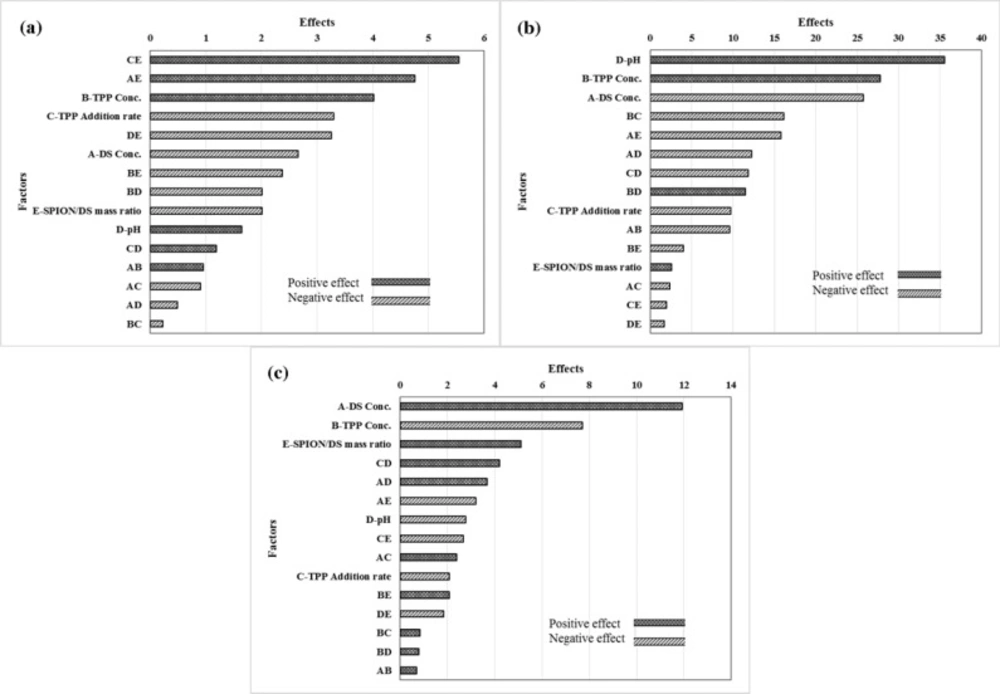
Pareto chart of the effective factors on the entrapment efficiency of capecitabine in cationic polymeric nanoparticles (a); Pareto chart of the factors affecting in particle size of capecitabine loaded cationic polymeric nanoparticles (b); Pareto chart of the factors affecting in zeta potential of capecitabine loaded cationic polymeric nanoparticles (c
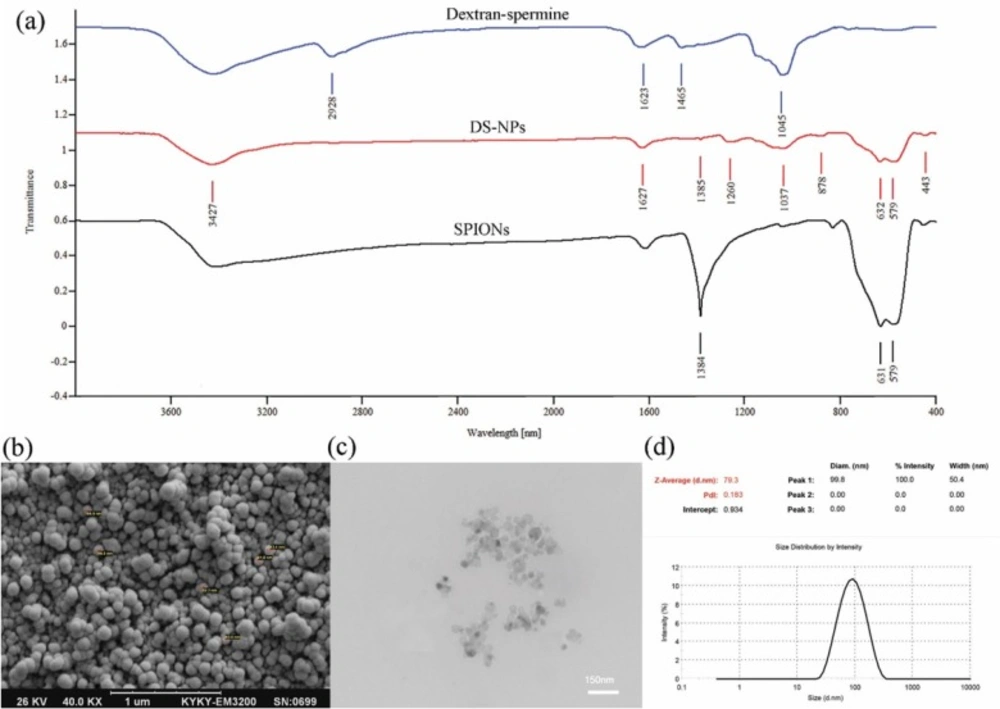
FT-IR spectra of dextran-spermine, DS-NPs and SPIONs (a); SEM (b) and TEM (c) images of capecitabine loaded DS-NPs; Size and the polydispersity of DS-NPs measured by DLS (d
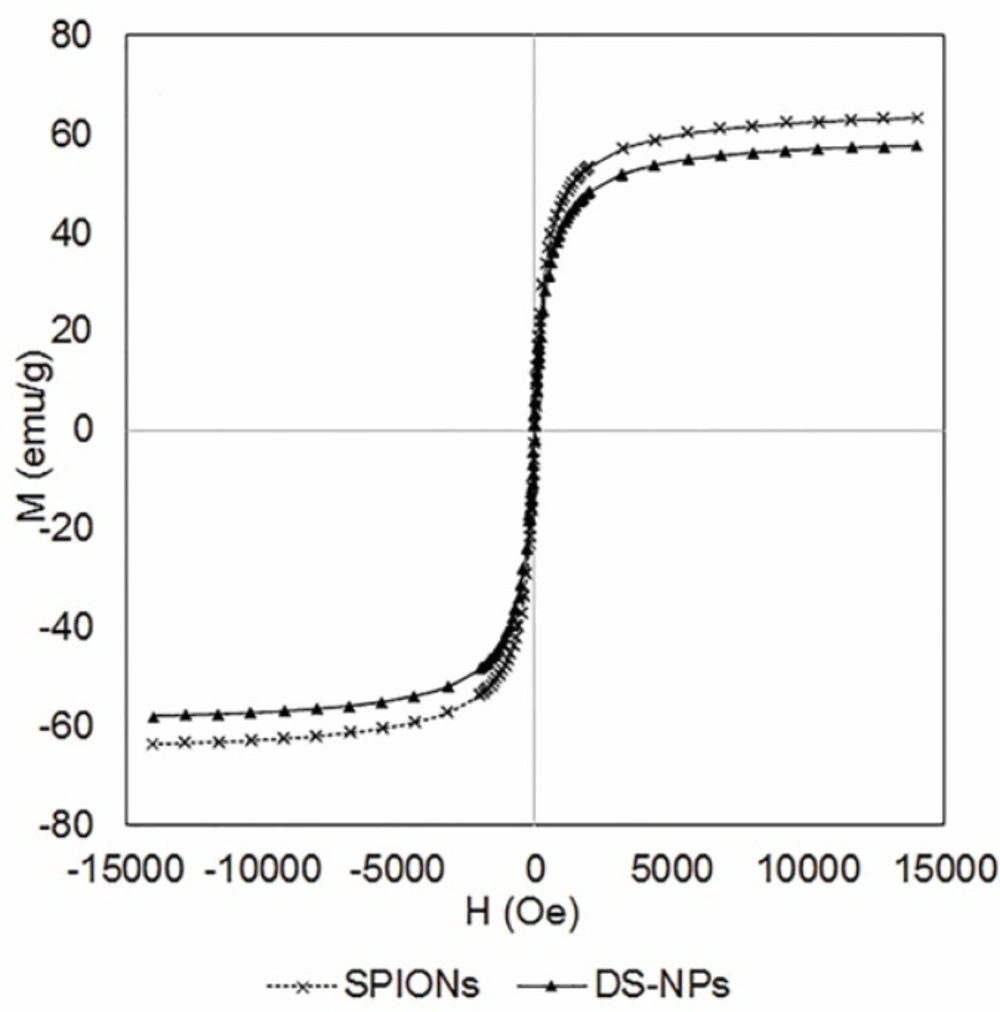
The magnetic behavior (VSM) of SPIONs and DS-NPs (300 K
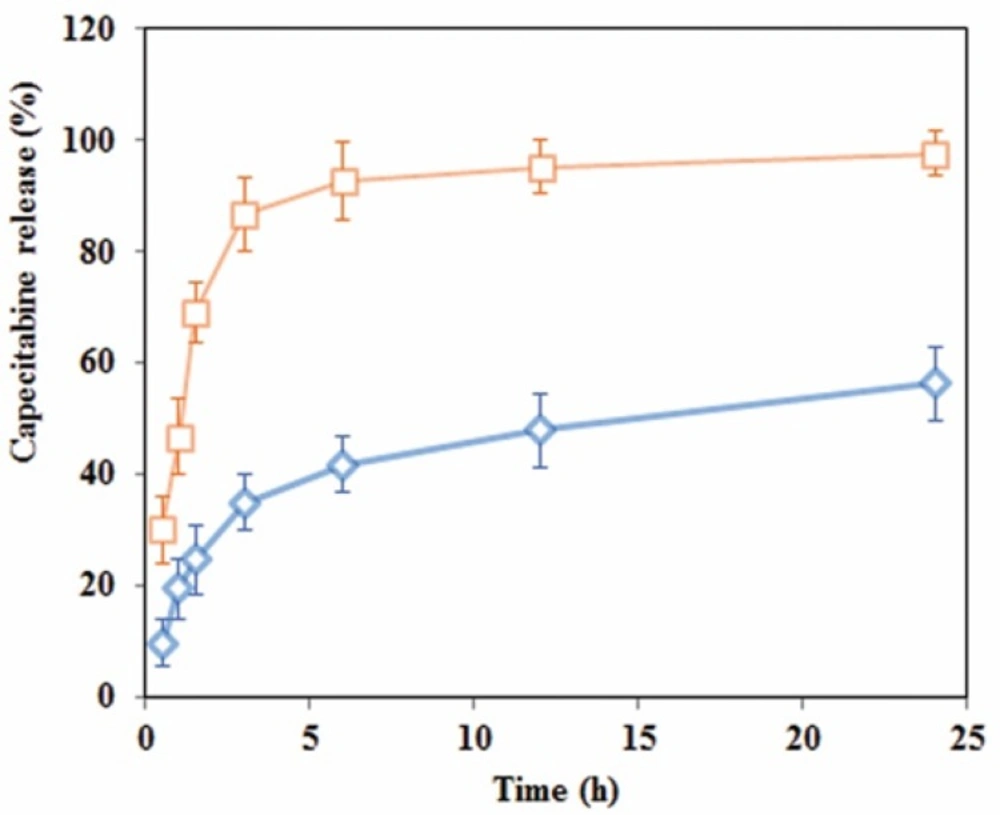
Release profile of capecitabine from cationic dextran-spermine nanoparticles in two: (□) acidic (pH 4.8) and (◊) neutral (pH 7.4) media
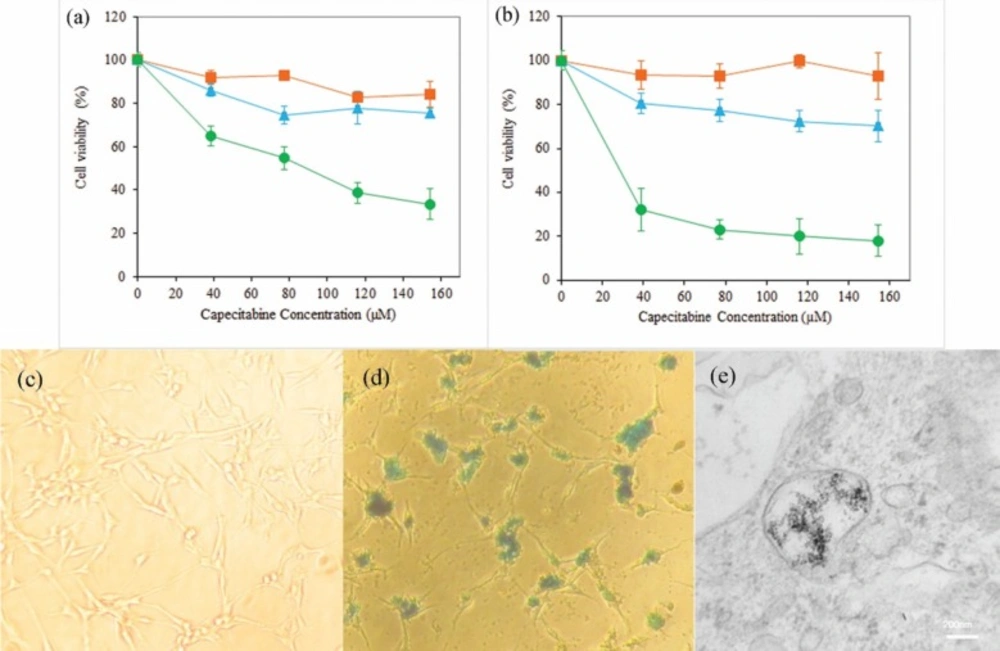
Viability of U87MG cells determined by MTT assay after incubation with neat DS-NPs (▪), free capecitabine (▲) and capecitabine loaded DS-NPs (●) at different concentrations of capecitabine (0-160 µM) for 24 h (a) and 48 h (b) (n = 3); Prussian blue staining images of U87MG cells after 14 h incubation with control group (c) and capecitabine loaded DS-NPs (d) at concentration of 0.1 µg/mL; TEM image of U87MG cells fixed after incubation with DS-NPs (e
| Factors | Units | Levels
|
|---|
| Low (-1) | High (+1) |
|---|
| A- Dextran-spermine Conc. (DS) | mg/mL | 2.00 | 4.00 |
| B- TPP Conc. (TPP) | mg/mL | 0.50 | 1.00 |
| C- TPP Addition rate (Rate) | mL/min | 35.00 | 60.00 |
| D- pH (pH) | - | 3.00 | 5.00 |
| E- SPION/DS mass ratio (SPION/DS) | - | 0.50 | 0.75 |
A- Dextran-spermine concentration (DS); B- Tri-polyphosphate concentration (TPP); C- Tri-polyphosphate addition rate (Rate); D- pH of dextran-spermine solution (pH); E- Super paramagnetic iron oxide nanoparticle/dextran-spermine mass ratio (SPION/DS).
| Std order | Factors | Responses |
|---|
| DS(mg/mL) | TPP(mg/mL) | rate(mL/min) | pH- | SPION/DS- | PS (nm) | ZP(mV) | EE (%) |
|---|
| S1 | - - - - + | 2.00 | 0.50 | 35.00 | 3.00 | 0.75 | 76 | +37.90 | 13.23 |
| S2 | + - - - - | 4.00 | 0.50 | 35.00 | 3.00 | 0.50 | 64 | +35.50 | 12.92 |
| S3 | - + - - - | 2.00 | 1.00 | 35.00 | 3.00 | 0.50 | 96 | +15.00 | 27.13 |
| S4 | + + - - + | 4.00 | 1.00 | 35.00 | 3.00 | 0.75 | 77 | +33.30 | 20.15 |
| S5 | - - + - - | 2.00 | 0.50 | 60.00 | 3.00 | 0.50 | 72 | +20.30 | 10.55 |
| S6 | + - + - + | 4.00 | 0.50 | 60.00 | 3.00 | 0.75 | 72 | +32.40 | 15.70 |
| S7 | - + + - + | 2.00 | 1.00 | 60.00 | 3.00 | 0.75 | 100 | +19.40 | 17.89 |
| S8 | + + + - - | 4.00 | 1.00 | 60.00 | 3.00 | 0.50 | 76 | +24.40 | 11.35 |
| S9 | - - - + - | 2.00 | 0.50 | 35.00 | 5.00 | 0.50 | 99 | +17.50 | 26.12 |
| S10 | + - - + + | 4.00 | 0.50 | 35.00 | 5.00 | 0.75 | 80 | +33.90 | 14.49 |
| S11 | - + - + + | 2.00 | 1.00 | 35.00 | 5.00 | 0.75 | 183 | +18.20 | 11.37 |
| S12 | + + - + - | 4.00 | 1.00 | 35.00 | 5.00 | 0.50 | 139 | +24.10 | 23.28 |
| S13 | - - + + + | 2.00 | 0.50 | 60.00 | 5.00 | 0.75 | 117 | +20.80 | 17.04 |
| S14 | + - + + - | 4.00 | 0.50 | 60.00 | 5.00 | 0.50 | 83 | +39.60 | 9.38 |
| S15 | - + + + - | 2.00 | 1.00 | 60.00 | 5.00 | 0.50 | 135 | +10.20 | 22.80 |
| S16 | + + + + + | 4.00 | 1.00 | 60.00 | 5.00 | 0.75 | 80 | +31.60 | 17.59 |
| S17 | 0 0 0 0 0 | 3.00 | 0.75 | 47.50 | 4.00 | 0.63 | 90 | +32.80 | 11.19 |
| S18 | 0 0 0 0 0 | 3.00 | 0.75 | 47.50 | 4.00 | 0.63 | 89 | +29.67 | 17.98 |
| S19 | 0 0 0 0 0 | 3.00 | 0.75 | 47.50 | 4.00 | 0.63 | 96 | +25.78 | 16.97 |
A- Dextran-spermine concentration (DS); B- tripolyphosphate concentration (TPP); C- tripolyphosphate addition rate (Rate); D- pH of dextran-spermine solution (pH); E- Super paramagnetic iron oxide nanoparticle/dextran-spermine mass ratio (SPION/DS); Particle size (PS); Zeta potential (ZP); Entrapment efficiency (EE).
| Dependent Factors | P-value | R2 | Adj. R2 | Lack of Fit |
|---|
| EE (%) | 0.0059 | 0.91 | 0.79 | Insignificant (P-value > 0.1) |
| PS (nm) | 0.0002 | 0.99 | 0.96 | Insignificant (P-value > 0.1) |
| ZP (mV) | 0.0019 | 0.94 | 0.84 | Insignificant (P-value > 0.1) |
EE: Entrapment efficiency; PS: Particle size; ZP: Zeta potential.
| EE (%) | PS (nm) | ZP (mV) |
|---|
| Predicted | 23.43 | 73 | +22.5 |
| Experimental | 26.09 | 79 | +22.8 |
| Absolute relative deviation | 11.35% | 8.22% | 1.33% |
EE: Entrapment Efficiency; PS: Particle Size; ZP: Zeta Potential.
Effect of process factors on the entrapment efficiency of capecitabine loaded DS-NPs
Based on fractional factorial design, 19 experiments were conducted as shown in
Table 2 and for each response, the analysis of variance (ANOVA) was implemented with significant probability of 0.05. The goodness of fit to experimental data with statistical model was tested by the high coefficient of determination, R
2 (
Table 3), and the randomness of the residuals.
The entrapment efficiency of the capecitabine in DS-NPs as a function of the effective factors is given by Equation (4) as follow:
Entrapment Efficiency (%) = 48.4 - 13.2 × DS + 47.9 × TPP - 1.2 × Rate + 12.0 × pH - 68.6 × SPION/DS + 19.0 × DS × SPION/DS - 4.0 × TPP × pH - 38.1 × TPP × SPION/DS + 1.8 × Rate × SPION/DS - 13.1 × pH × SPION/DS (4)
As presented in
Figure 2a, the positive effects mean that when the amount of factor increases in the studied range, the response increased and this increment is favorable for the response, while negative effects indicates that the response will be decreased by decreasing the amount of factor in the studied range, and this decrement is desirable. The degrees of the effects specify the relative influences of the factors in the response. The
P-value of each term of the factors, denotes the probability of error which is required in accepting the practical outcomes. In consequence, the smaller
P-value, the corresponding coefficient term is the more significant. The effects of factors, containing main and binary interactions of the factors, on entrapment efficiency of capecitabine in the magnetic dextran-spermine nanoparticles, are illustrated in
Figure 2a.
TPP concentration and pH of the dextran-spermine solution have positive effect on the entrapment efficiency in the considered range. So, high entrapment efficiency of capecitabine will be achieved at higher levels of TPP concentration and pH of DS solution. The decrease in the entrapment efficiency with the increase in DS concentration from 2.0 to 4.0 mg/mL, can be related to the increases in solution viscosity with increasing DS concentration. It has been reported that drug molecule movement within polymer molecular chains will be obstructed due to high viscosity related with increased polymer concentration, and prevented entrapment of drug (
30,
31).
As illustrated in
Figure 2a, capecitabine entrapment efficiency improved through increasing TPP concentration. One clarification is that high TPP concentration (pH 8.9) at constant DS concentration, may cause a growth in pH value of the mixture, with a subsequent rise of totally negative charge transport by the capecitabine molecules (with an isoelectric point of 2.43), which in turn augments the electrostatic interactions between DS and capecitabine molecules (
23). It is noticeable that the entrapment efficiency increased by increasing the pH of DS, as shown in
Figure 2a. It can be related to more negative charge at pH values greater than capecitabine isoelectric point and consequently, increased ionic interaction of DS with TPP and capecitabine (
24).
Effect of process factors on particle size of capecitabine loaded DS-NPs
The effects of main and binary interactions of factors on the particle size are shown in
Figure 2b. The particle size decreased by increasing DS concentration and the rate of TPP addition due to more available sites for particles nucleation and accelerated cross linking of activated amine groups in DS by phosphate ions for particle formation.
TPP concentration is another factor that affects the formation and characteristics of DS-NPs throughout ionic gelation process. It has been reported that the particle size of chitosan nanoparticles decreased by decreasing TPP concentration (
32).
We observed that the turbidity of the nanoparticles suspension increased by increasing of TPP concentration. Aggregates of chitosan nanoparticles with large size were formed when TPP concentration was high (
30). From theoretical point of view, fast gelation of the cationic polysaccharide polymers upon contact with TPP as a cross linker, is due to inter- and intra-molecular linkage between amino groups of DS and phosphate groups of TPP. At low concentration of TPP, it may be consumed mainly by intra-molecular cross-linking with DS molecules to form smaller nanoparticles. But at high concentration of TPP, the accessible molecules of TPP increases with consequent intermolecular interactions of them with DS molecules of adjacent nanoparticles that lead to formation of larger nanoparticles.
The formation of DS-NPs by ionic gelation was pH dependent and nanoparticles with smaller size and higher zeta potential were formed at low pH values. The particle size of nanoparticles was increased by increasing the pH value from 4.0 to 6.0.
The same trend for chitosan nanoparticles formation was also described by Shu and Zhu (
33). At lower pH values, a higher zeta potential and stronger linkage between TPP and NH
3+ is due to higher protonation of –NH
2 moiety that resulted compact nanoparticles with small particle size. In addition, the strong repulsion between nanoparticles with higher zeta potential prevented their aggregation. At higher pH values, larger nanoparticles would be formed due to the relatively weak interactions between DS and TPP molecules (
34).
The dependence of DS-NPs size on effective factors can be described by the following statistical Equation (P-value < 0.05):
Particle size (nm) = -327.6 + 70.0 × DS + 143.8 × TPP + 3.7 × Rate + 41.4 × pH + 199.8 × SPION/DS - 19.2 × DS × TPP - 0.1 × DS × Rate - 6.1 × DS × pH - 63.2 × DS × SPION/DS - 2.6 × TPP × Rate + 22.9 × TPP × pH - 0.5 × Rate × pH (5)
Effect of process factors on zeta potential of capecitabine loaded DS-NPs
Figure 2c shows the pareto chart of factors that are effective on the zeta potential of DS-NPs. In the studied range, the zeta potential of capecitabine loaded DS-NPs improved with DS concentration. As described earlier, the interaction between protonated amine group of DS (-NH
3+) with poly anionic phosphate groups of TPP is responsible for formation of DS-NPs by ionic gelation. The zeta potential of DS-NPs is regulated by the poly anionic phosphate groups of TPP via the degree of neutralization of -NH
3+. As a result, in the greater DS concentration, there are more available -NH
3+ in dextran-spermine solution to be neutralized and leads to higher zeta potential of DS-NPs. Hu
et al., have reported the linear relation between the chitosan concentration and zeta potential of the nanoparticles (
35).
The zeta potential of DS-NPs decreased by increasing the TPP concentration from 0.5 to 1.0 mg/mL due to neutralization of cations on the surface of particles by poly anionic phosphate groups of TPP throughout the linking or accumulation of the nanoparticles.
One of the factors that had positive effect on zeta potential is the SPION/DS mass ratio. The SPION used in preparation of the nanoparticles, had positive surface charge and it is reasonable to assume the increase of zeta potential of DS-NPs by increase of SPION content in the reaction mixture with possible presence on the surface of polymeric nanoparticles. The statistical relation (P-value < 0.05) to describe the dependence of zeta potential on the effective factors is given by:
Zeta Potential (mV) = 50.6 + 2.1 × DS - 36.3 × TPP - 0.5 × Rate - 14.9 × pH + 74.8 × SPION/DS + 0.1 × DS × Rate + 1.8 × DS × pH - 12.9 × DS × SPION/DS + 33.4 × TPP × SPION/DS + 0.2 × Rate × pH - 0.9 × Rate × SPION/DS - 7.4 × pH × SPION/DS (6)
Optimum formulation for preparation of drug loaded DS-NPs
To find the optimum condition for preparation of capecitabine loaded dextran-spermine, the optimization was based on the criterion of desirability functions for the three responses: Entrapment efficiency of capecitabine and zeta potential and particle size of DS-NPs. The best formulation in the studied range, was found to be at 2 mg/mL DS concentration, 0.75 mg/mL TPP concentration at an addition rate of 35 mL/min, pH 3 of polymer solution and SPION/DS mass ratio of 0.5. The capecitabine loaded DS-NPs were prepared at optimum condition and the corresponding experimental results were fitted to the fractional factorial model. The investigational outcomes in
Table 4 indicates that model computations agreed with the experimental results.
FT-IR spectroscopy
To evaluate the interactions among capecitabine, SPIONs and dextran-spermine, the FT-IR spectra of SPIONs, capecitabine loaded magnetic dextran-spermine nanoparticles and dextran-spermine polymer are displayed in
Figure 3a. The FT-IR spectrum of SPIONs displays the peak situated at 1384 cm
-1 which can be allocated to C-H bending vibration mode and the representative peak at 579-630 cm
-1 corresponds to the stretching vibration mode of Fe
2O
3 (
36). The bending mode of H-O-H adsorbed at the SPIONs surface can be directed as a weak band around 1615 cm
-1. The strength of absorption peaks of 580 and 631 cm
-1 for SPIONs were significantly reduced by entrapment in dextran-spermine. Moreover, there was no peak in dextran-spermine spectrum in the range of 650-400 cm
-1 due to the entrapment of SPIONs in dextran-spermine matrix, as an indication of effective loading of SPIONs in the dextran-spermine polymeric network.
Shape and morphology of nanoparticles
The size and surface morphology of DS-NPs were determined by dynamic light scattering (DLS), SEM, and TEM images. SEM (
Figure 3b) and TEM (
Figure 3c) images show that DS-NPs with a size of 79 nm, were spherical and evenly distributed. Additionally, the DS-NPs size determined by TEM and SEM agreed well with DLS results, as shown in
Figure 3d. Also, the size of neat DS-NPs (68 nm) is smaller than capecitabine loaded DS-NPs (79 nm) and it is agreed well with result reported by Mohammad-Taheri
et al. (
22).
Magnetization property of DS-NPs
The magnetic properties of DS-NPs were assessed by VSM under a magnetic field to approve their potential applications as theranostic system for MR imaging and drug delivery.
Figure 4 indicates that DS-NPs have super paramagnetism property without magnetic hysteresis at 300 K and its saturation magnetization value was 57.8 emu/g at 1.5T, which is lower than that of SPIONs (63.3 emu/g). It can be due to the thick polymeric shells surrounding the SPIONs. Shen
et al. have reported similar result by functionalizing RGD to polymeric magnetic nanoparticles (
12). However, DS-NPs have considerably higher saturation magnetization values as compared to those reported by other researchers,
e.g. 29.1 emu/g (
37), 27 emu/g (
12) and 14 emu/g (
38) that means they would be more appropriate for clinical applications.
In-vitro release of capecitabine
Drug release experimentations were performed in the buffer medium with neutral and acidic pH to mimic drug release profile in cancerous cell microenvironment via an HPLC technique. The calibration curve was constructed in a range of 0.06-1.2 mg/mL (R
2 = 0.99) and accuracy and precision data were determined accordingly. The capecitabine release profile at pHs 4.8 and 7.4 are shown in
Figure 5. As shown in this Figure, 98% of entrapped capecitabine in DS-NPs released within 3 h in acetate buffer at pH 4.8, while entrapped capecitabine release in neutral media within 24 h was 56% without burst effect.
Faster drug release at acidic medium, can be attributed to expanded structure of swollen network made of cationic DS polymer (
39). The release kinetic of capecitabine from DS-NPs was analyzed by an empirical Equation, known as Korsmeyer-Peppas relation (Equation (7)) (
40) as follow:
Where M
t/M
∞ is the fractional drug release at time t, k is a constant related to diffusion coefficient of drug and geometry of the release device. The exponent of n is a factor that describes the release mechanism. n value of n = 0.5 stands for Fickian diffusion and 0.5 < n < 1.0 is an indicative anomalous diffusion due to polymer chain relaxation and n = 1 describes case II transport due to constant rate of swelling or erosion front (
41). However, the mechanism of drug release is more sophisticated to be described with such a simple empirical relation. In this study, the value of n = 0.42 at neutral medium (R
2 = 0.90) shows that the drug release controlled by Fickian diffusion mechanism, and at acidic medium, a value of n = 0.61
(R
2 = 0.96) indicates that a combination of diffusion, swelling and polymer chain cleavage degradation may be responsible for drug release from DS-NPs. Acidic environment or pH of living cells and tissues is one of the main factors that affects cell cycle progression, cell proliferation, and differentiation (
42). It has long been proved that as compared with normal tissues, tumors of both animal and human have acidic microenvironment, due to elevated anaerobic along with aerobic glycolysis in tumors (
43). As shown in
Figure 5, drug release from DS-NPs at neutral environment had a sustained release behavior, while at acidic environment, a burst release occurred. Thus, it can be concluded that this kind of nanocarriers are promising candidates for antineoplastic drugs delivery to tumor sites. It is expected that the drug will be released slowly till the nanocarriers reach to the targeted site (tumor site) where the drug will be released upon its exposure to the acidic environment of tumor.
In-vitro cell investigation
The cytotoxicity of neat and capecitabine-loaded DS-NPs and free drug were evaluated by MTT test on the U87MG glioblastoma cell line.
Figures 6a and 6b display that neat nanoparticles and free drug did not have significant toxicity on these cells, and the capecitabine loaded DS-NPs were more toxic. Capecitabine is a hydrophilic anticancer drug that penetrates into cells by membrane transporters (
44) and more capecitabine is required to have toxicity effect on these cells due to low potency of capecitabine. Nanoparticles can be taken up by cells via a clathrin mediated endocytosis route (
45,
46). Hence, nanoparticles play a facilitator role for drug delivery into the cells. In addition, tumor cells have strong negative charge on their surface because of the presence of sialic acid, human chorionic gonadotropin and RNA residues with negative charge on them (
47,
48). Accordingly, cationic nanoparticles interact electro statically with membrane of the cancerous cells and can be internalized more effectively into U87MG cell. Capecitabine release from positively charged DS-NPs that are attached or penetrated into the cells, provides more drug for membrane passage followed by accumulation in the interior of the cells. Both mechanism can be responsible for cytotoxicity of capecitabine loaded magnetic DS-NPs.
Effective uptake of anticancer drug carriers by cancer cells is important and the usefulness of magnetic NPs along with their biomedical fortune within cells extremely depend on their surface charges. For that reason, the cellular internalization of capecitabine and SPIONs loaded DS-NPs by human glioblastoma U87MG cells was investigated using Prussian blue staining to detect the distribution of intracellular iron.
Figures 6c and 6d show the images of Prussian blue staining of DS-NPs that were freely taken up by U87MG cells as specified by blue points in the cytoplasm or round the nuclei. To extra confirmation of particles internalization, the TEM images of U87MG cells, incubated with DS-NPs, were taken.
Figure 6e obviously indicates the uptake nanoparticles and presence of numerous vesicles comprising clusters of nanoparticles in the cytoplasm.
The process of nanoparticles uptake, can be attributed to their adsorption to the surface of cancerous cells follow by generation of vesicles containing nanoparticles and consequent internalization of them by endocytosis (
49).