Animals
Male wistar rats (250-300 g) were housed in an air-conditioned room with controlled temperature of 25 ± 2◦C and maintained on a 12:12 h light cycle with free access to food and water. All experimental procedures were conducted according to the ethical standards and protocols approved by the Committee of Animal Experimentation of Shahid Beheshti University of Medical Sciences, Tehran, Iran. All efforts were made to minimize the number of animals and their suffering.
Experimental design
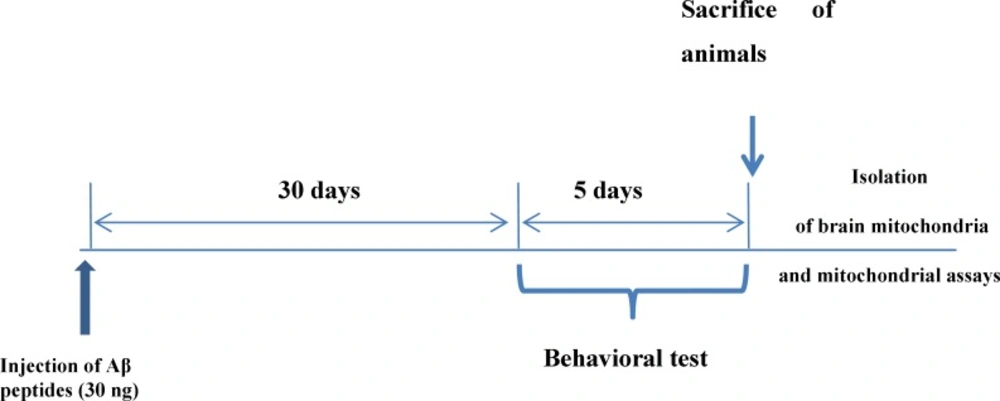
Male wistar rats were divided into two groups, comprising 10 animals each, as follows: group A includes untreated control rats, Group B (disease model) include amyloid-β (Aβ) peptide treated rats whom were injected with single dose of amyloid-β (Aβ) peptide (30 ng, by stereotaxic method) in each hemisphere of the brain.
Behavioral test
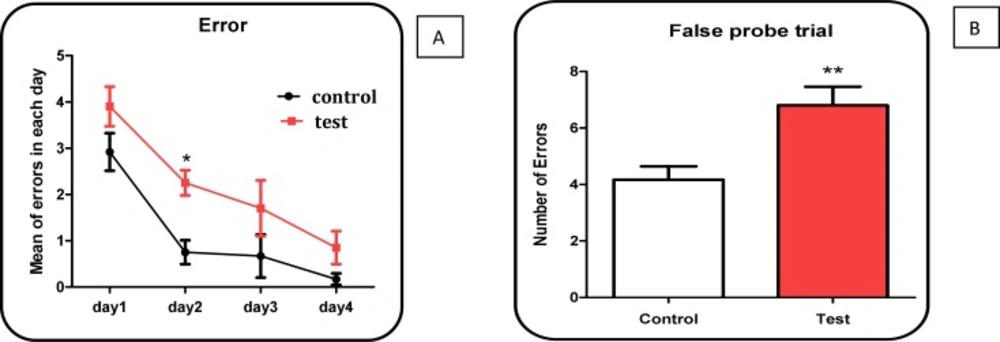
Morris water maze
30 days after injection of Aβ peptides, behavioral testing was performed. This test measures spatial reference memory. In this test a mouse or a rat is placed into a circular tank containing water, and has to find an escape platform in a fixed place just beneath the surface. The escape platform is not visible to the animal because the water has been rendered opaque. After swimming around for a certain time, the animal will eventually come across the hidden platform and climb onto it to escape from the water. When placed again in the water on subsequent occasions, the animal will generally find the platform with increasing rapidity, indicating that it has learned the position of the platform. There are different ways to perform the test and also many parameters to assess memory, including path length and time to find the platform (
11-
12).
Mitochondrial preparation
After significant appearance of behavioral dysfunction by probe trial test in Aβ peptides treated test group rats, all animals in both test and control groups were sacrificed by cervical decapitation. Then, mitochondria were prepared from wistar rat’s brain using differential centrifugation (
13-
14). The brain was removed and minced with small scissors in a cold mannitol (225 mM) solution (mitochondria isolation buffer). The minced brain was gently homogenized in a glass homogenizer with a Teflon pestle and then centrifuged at 1500 × g for 10 min at 4 °C for the removal of nuclei, unbroken cells, and other non-subcellular tissues and the pellet was discarded. The supernatant was subjected to a further centrifugation at 12,000×g for 10 min and the superior layer was carefully discarded. The mitochondrial pellet was washed by gently suspending in the isolation medium (0.225 M D-mannitol, 75 mM sucrose, and 0.2 mM EDTA, pH=7.4) and centrifuged again at 12,000×g for 10 min. Final mitochondrial pellets were suspended in Tris buffer containing (0.05 M Tris-HCl, 0.25 M sucrose, 20 Mm KCl, 2.0 mM MgCl
2, and 1.0 mM Na
2HPO
4, pH of 7.4) at 4 °C, except for the mitochondria used to assess ROS production, MMP and swelling, which were suspended in respiration buffer (0.32 mM sucrose,10 mM Tris, 20 mM Mops, 50 μM EGTA, 0.5 mM MgCl
2, 0.1 mM KH
2PO
4 and 5 mM sodium succinate), MMP assay buffer (220 mM sucrose, 68 mM D-mannitol, 10 mM KCl,5 mM KH
2PO
4, 2 mM MgCl
2, 50 μM EGTA, 5 mM sodium succinate, 10 mM HEPES, 2 μM Rotenone) and swelling buffer (70 mM sucrose, 230 mM mannitol, 3 mM HEPES, 2 mM tris-phosphate, 5 mM succinate and 1 μM of rotenone). In our study the brains of each rat was homogenized and studied separately.
Mitochondria were prepared fresh for each experiment and used within 4 h of isolation and all steps were strictly operated on ice to guarantee the isolation of high-quality mitochondrial preparation.
Protein Concentration
Mitochondrial protein concentration was determined by the Coomassie blue protein binding method (Bradford, 1976) using BSA as the standard (
15). For the normalization process in all the following mitochondrial assays, the mitochondrial samples (0.5 mg mitochondrial protein/ml) were used.
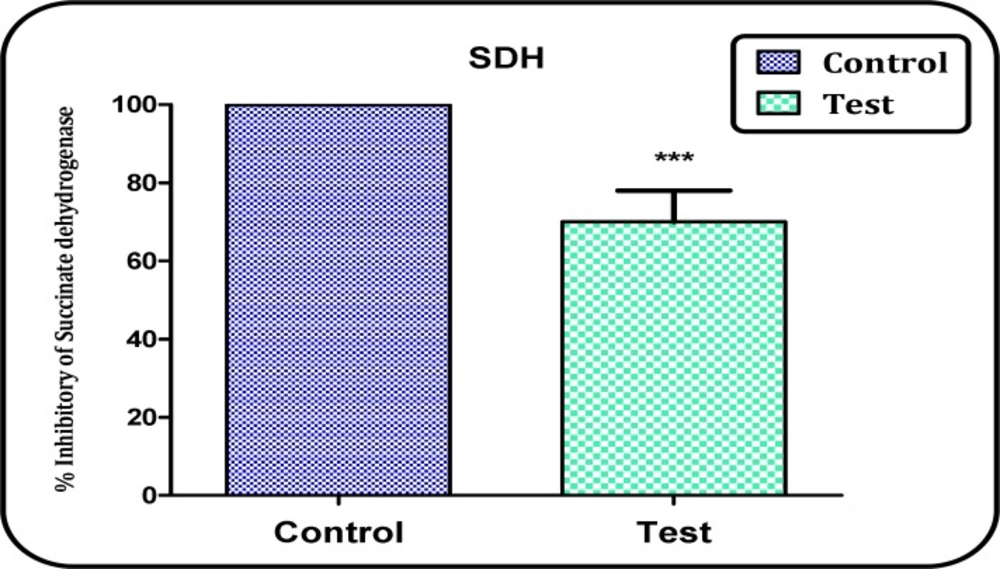
Determination of complex II activity through the MTT assay
The activity of mitochondrial complex II (succinate dehydrogenase) was assayed through the measurement of MTT reduction and the absorbance at 570 nm was measured with an ELISA reader (Tecan, Rainbow Thermo, Austria) (
16).
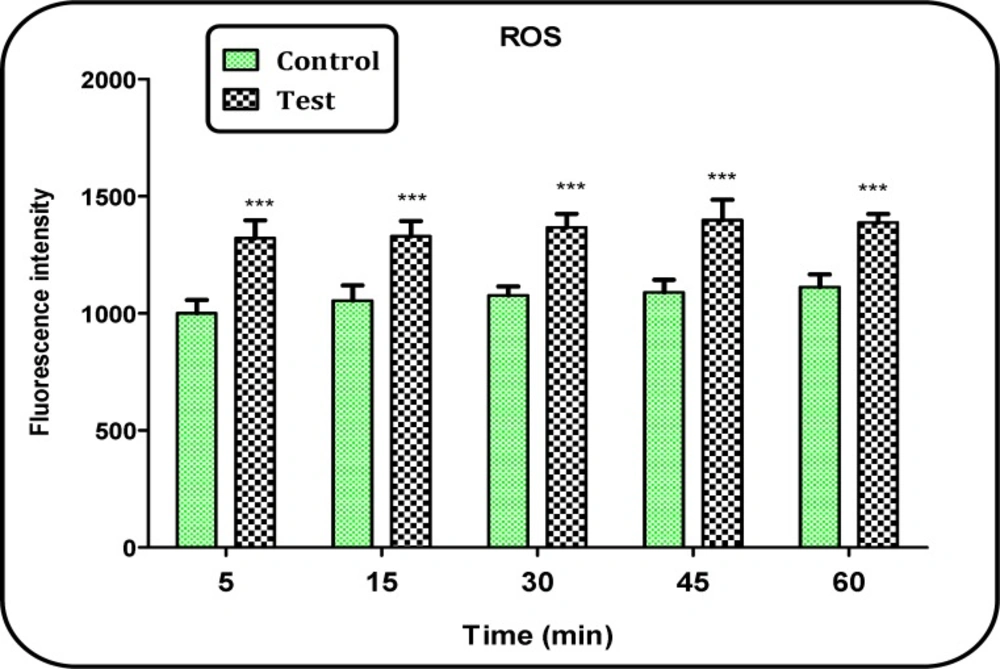
Determination of mitochondrial ROS level
The mitochondrial ROS measurement was performed using the fluorescent probe DCFH. Briefly, isolated brain mitochondria were placed in respiration buffer. Following this step, DCFH was added (final concentration, 10 μM) to mitochondria and then incubated for 10 min. Then, the fluorescence intensity of DCF was measured using Shimadzu RF-5000U fluorescence spectrophotometer at the λEx = 488 nm and λEm = 527 nm (
17).
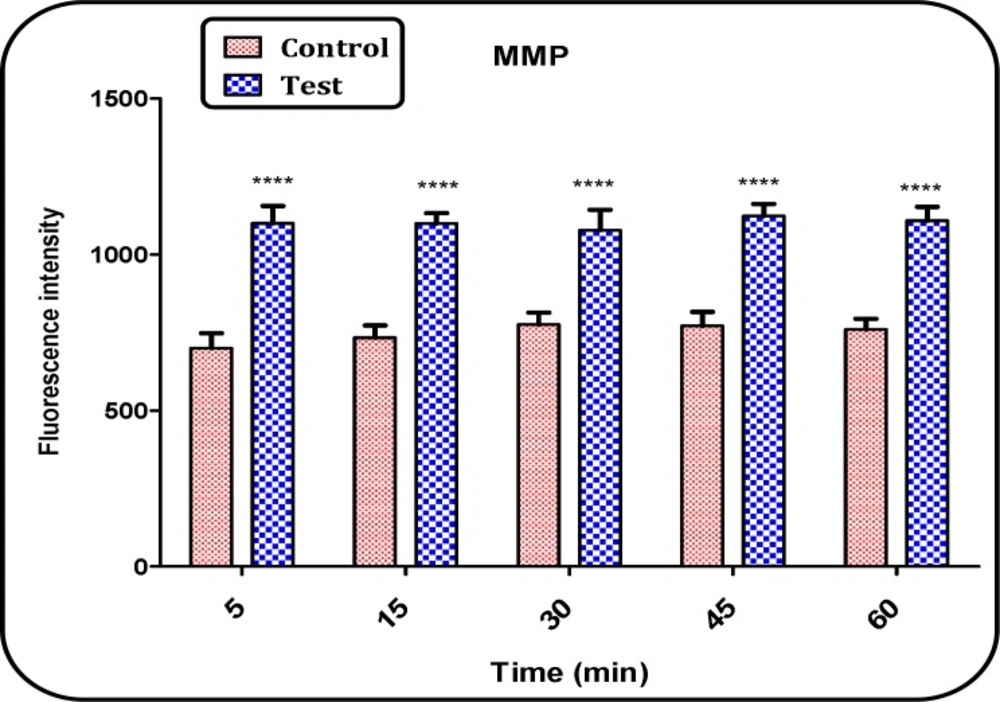
Determination of the MMP
Mitochondrial uptake of the cationic fuorescent dye, rhodamine 123 (Rh123), has been used for the estimation of mitochondrial membrane potential (
18). The mitochondrial fractions (0.5 mg protein/ml) were incubated with 10 µM of Rh123 in MMP assay buffer. Then, the fluorescence was monitored using Shimadzu RF-5000U fuorescence spectrophotometer at the λEx=490 nm and λEm=535 nm (
19).
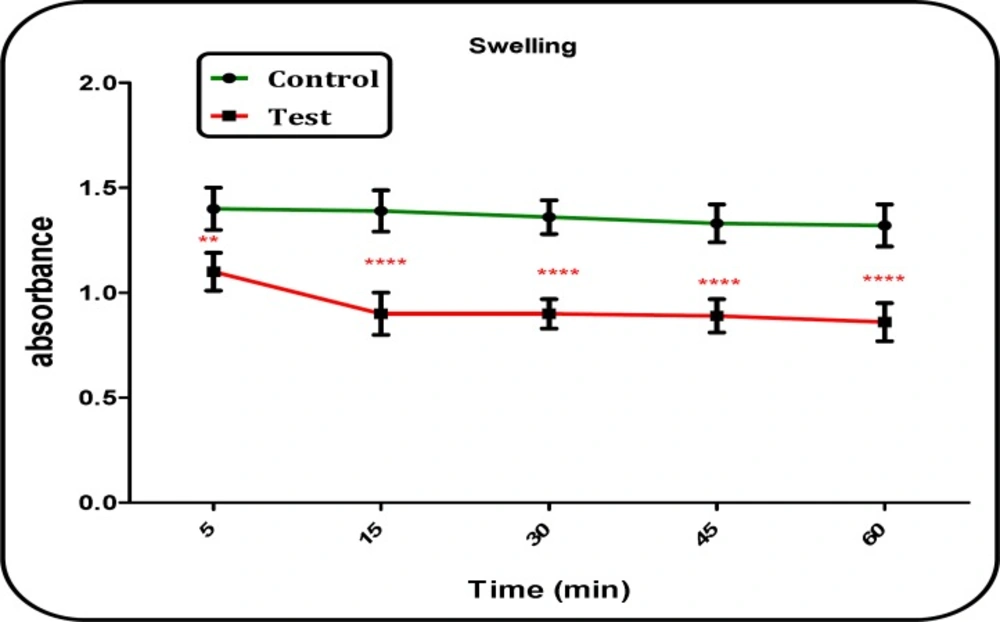
Determination of mitochondrial swelling
Determination of mitochondrial swelling after the isolated mitochondria (0.5 mg protein/mL) was estimated through changes in light scattering as monitored spectrophotometrically at 540 nm (30 °C). Firstly, isolated mitochondria were suspended in swelling buffer. In the next step, the absorbance was measured at 549 nm at 10 min time intervals with an ELISA reader (Tecan, Rainbow Thermo and Austria). A decrease in absorbance indicates an increase in mitochondrial swelling (
13).
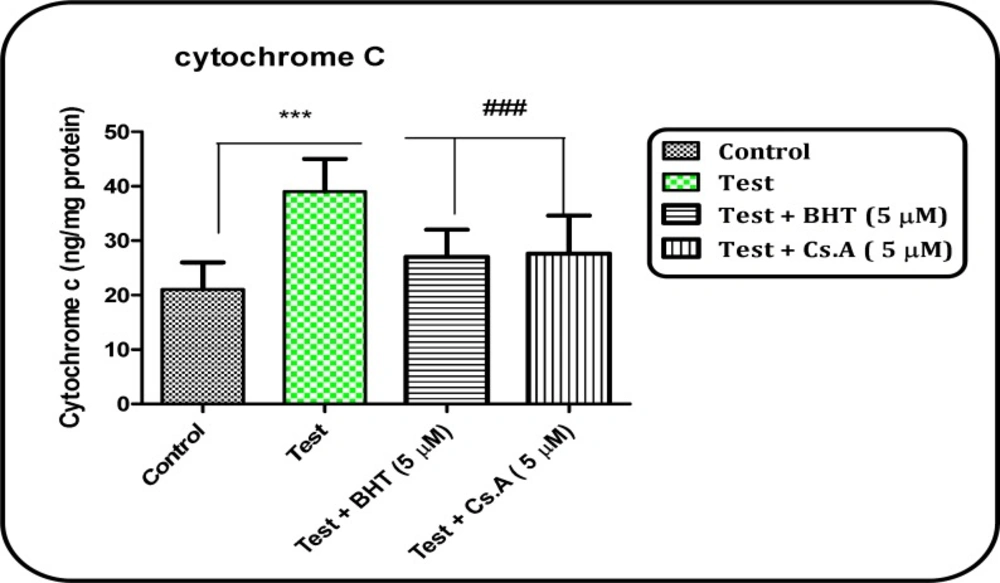
Release of cytochrome c assay
The concentration of cytochrome c was determined by using the Quantikine rat/mouse cytochrome c immunoassay kit provided by R&D Systems, Inc. (Minneapolis, MN). Briefly, a monoclonal antibody specific for rat/mouse cytochrome c was pre-coated onto the microplate. Seventy-five ml conjugate (containing monoclonal antibody specific for cytochrome c conjugated to horseradish peroxidase) and 50 ml standard and positive control were added to each well of the microplate. One microgram protein from each supernatant fraction was added to the sample wells. All the standards, controls, and samples were added to the microplate in duplicate. After 2 h incubation, substrate solution (100 mL) was added to each well and incubated for 30 min. After incubation, 100 mL of stop solution was added to each well, and the optical density of each well was determined by the aforementioned microplate spectrophotometer set at 450 nm.
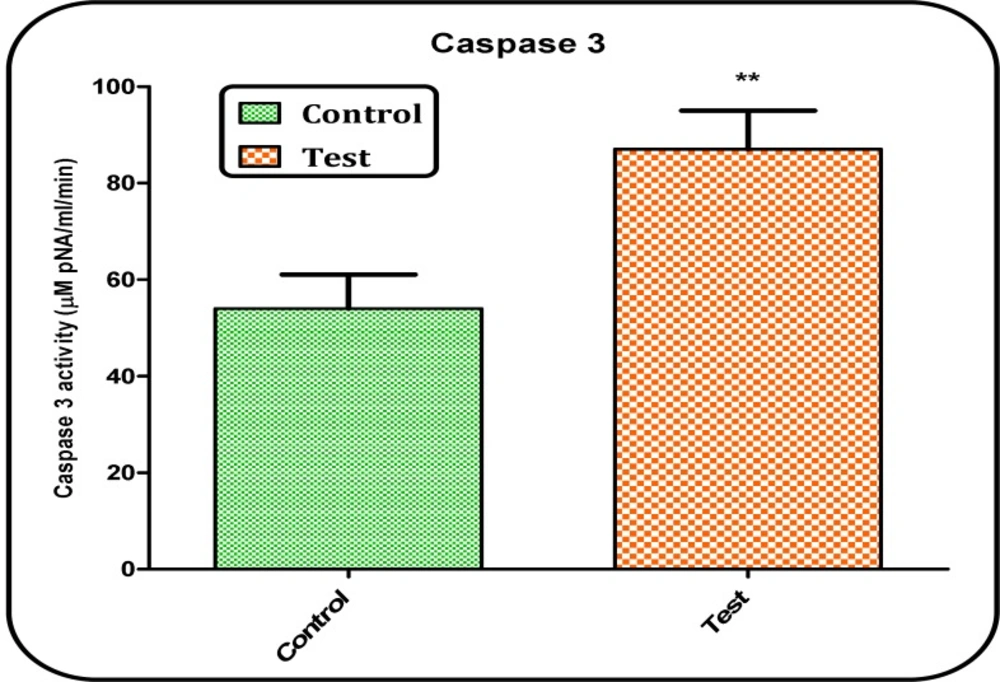
Determination of caspase-3 activity
Caspase-3 activity was determined in cell lysate of hepatocytes from different treatments using “Sigma’s caspase-3 assay kit (CASP-3-C)” (
20). In brief, this colorimetric assay is based on the hydrolysis of substrate peptide, Ac-DEVD-
pNA, through caspase-3. The released moiety (
p-nitroaniline) has a high absorbance at 405 nm. The concentration of the
p-nitroaniline (μM) released from the substrate is calculated from the absorbance values at 405 nm or from a calibration curve prepared with defined
p-nitro aniline solutions (
21).
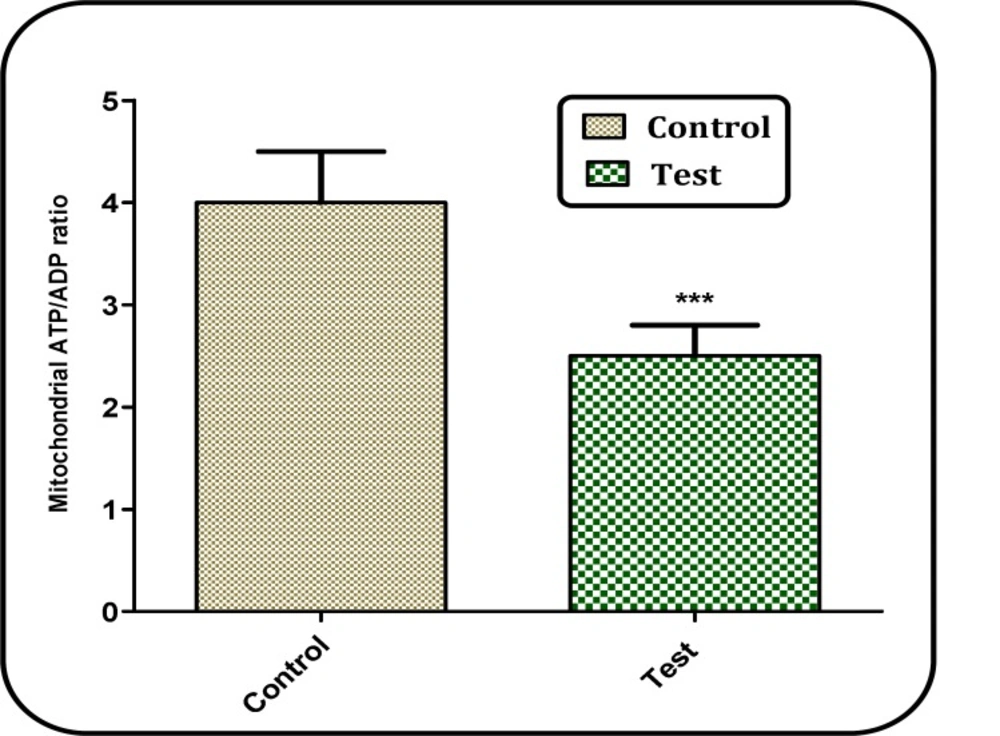
Assay of ATP/ADP ratio
The ATP/ADP ratio level was measured by luciferase enzyme as described by Tafreshi et al. (
22). Bioluminescence intensity was measured using Sirius tube luminometer (Berthold Detection System, Germany). The method was based on the measurement of time to the disappearance of emission; even under conditions of visual process control, this method made it possible to determine ATP contents in the range of 10–150 μg. Currently, the mechanism of this reaction has been studied in sufficient detail. It is based on the oxidation of D-luciferin in the presence of ATP and oxygen catalyzed by firefly luciferase. The emission spectrum in the region of 470–700 nm is asymmetric with a maximum at 562 nm. The emission intensity is proportional to the concentration of ATP.
Statistical analysis
Results are presented as mean ± SD. Assays were performed in triplicate and the mean was used for statistical analysis. Statistical significance was determined using the student t-test or one-way ANOVA test, followed by the post-hoc Tukey test when appropriate. Statistical significance was set at P < 0.05.