
Introduction
Customer relationship management (CRM) denotes that managerial efforts to business processes and technologies that designed to understand the customers of a firm (1). Recently, the rapid changes in IT have been accompanied by the issue of CRM, as well as data mining techniques within various industries, which have become the focal point of challenges in marketing strategy and implementation (2). The effective and efficient utilization of IT is a method for implementing a successful CRM strategy to understand customer needs, satisfy customers demands, mine for valuable customer information, identify target and potential customers, realize the maximum customer value, increase customer loyalty, and finally maximize profits (3). Precise evaluation of customer profitability is a crucial element for the success of CRM (4). In recent years, there has been a growing interest in application of CRM in healthcare industry by administrators. European public healthcare systems are implementing market-driven reforms such as managerial decentralization, the separation of purchasers and providers, the use of prospective payment systems, mostly performance-based, and the implementation of policies that allow patients to choose their hospital to improve the efficiency and quality of their services (5,6). These cause some kind of competition among hospitals. It is expected that patients will choose the hospitals with the best quality or, at least, will try to avoid ‘bad’ hospitals, and that ‘good’ hospitals will be rewarded with more resources (7). In the healthcare sphere, the difficulties of measuring health outcomes makes the evaluation of efficiency a controversial topic so health outcomes are usually replaced by output data (8). Patient satisfaction has become an important perspective in the measurement of health service outcome (9).
Understanding more about high-value and potential patients, including the hospital departments and services that they utilize, will help hospitals appropriately design resource allocation strategies for health care services (2). For discovering all groups of patients, customer lifetime value (CLV) is an effective method that defines customers based on their characteristic, preference and activities. CLV referred to the profitability attributed to a customer during the time that the customer will stay with a company. CLV is applied in the literature as segmentation tools of customers in different industries (10, 11, 12, 13, 14, and 15). In this research, RFM technique is used to calculate CLV of the customers to segment them in a public sector hospital in Tehran. The main goal of the segmentation is who are the target customers and whose contributions are more significant in the patients of the hospital. In this study, adopted RFM analysis named RFML (Recency, Frequency, Monetary and Length) prescribes a segmentation of patients in the hospital by using a clustering–classification model. We used Two-step method to predict optimum K number of clusters, then K-means algorithm to cluster the patients. Also two approaches are examined for classification. In the first the output of clustering (cluster number of each patient) is used as decision attribute for Decision tree algorithm. And second, LTV value calculated by weighted RFML model categorized all customers into K categories. These categories are considered as decision attribute for Decision tree algorithm. We believe, greater LTV value shows more loyal patient. Two-step and K-means algorithms are used to identify all segments of patients, and decision tree algorithm to detect hidden knowledge rules and health care shopping behaviors by characteristics and behavioral information of patients. This result helps to examine the best marketing strategies for health care services. Proposed model are examined on an empirical study in a big public sector hospital in Iran. 768,864 data records are extracted of Hospital Information System (HIS) from 2009 to 2012. The main idea of this paper is, there is contrast between patient and customer loyalty. Three purposes involved to decrease that: 1) only, outpatient data are used 2) long time period is considered to monitor patients’ behavior (four years, from 2009 to 2012) that causes, 3) too many data records of patients (768,864 data records of 234,690 patients) for evaluation.
Background
Customer relationship management (CRM)
CRM is a philosophy that anticipates customer needs with the purpose of providing the target customers with the right product, at the right time, in the right place (16). Enterprises that succeed in correctly assessing customer value can offer customized services to diverse customers, perform effective customer relationship management and, simultaneously, also increase enterprise revenues (17). Under the concept of CRM, customers are not equal and, thus, it is unreasonable for the company to provide the same incentive offers to all customers. Instead, companies can select only those customers who meet certain profitability criteria based on their individual needs or purchasing behaviors (18). CRM framework can be classified into operational and analytical (17, 19, 20). Operational CRM refers to the automation of business processes, whereas analytical CRM refers to the analysis of customer characteristics and behaviors so as to support the organization’s customer management strategies. As such, analytical CRM could help an organization to better discriminate and more effectively allocate resources to the most profitable group of customers (21).
CLV, RFM , wRFM and eRFM definitions
Customer lifetime value (CLV) is typically used to identify profitable customers and to develop strategies to target customers (22). Generally, RFM (Recency, Frequency, and Monetary) method has been used to measure CLV or loyalty (23-25). Hughes proposed RFM analytic model in 1994 (26). Three variables of the model are (27):
1) Recency of the last purchase (R): refers to the interval between the time that the latest consuming behavior happens and present. The shorter the interval is, the bigger R is.
2) Frequency of the purchases (F): refers to the number of transactions in a particular period, for example, two times of one year, two times of one quarter or two times of one month. The many the frequency is, the bigger F is.
3) Monetary value of the purchases (M): refers to consumption money amount in a particular period. The much the monetary is, the bigger M is.
Wu & Lin (28) in their research showed the bigger value of R and F is, the more likely the corresponding customers are to produce a new trade with enterprises. Moreover, the bigger M is, the more likely the corresponding customers are to buy products or services with enterprises again. Liu and Shih (25) proposed a weighted RFM based method (wRFM) that is
Cj= WRRcj+ WFFcj+ WMMcj, where WR, WF, WM are the relative importance of the RFM variables. wRFM integrates analytic hierarchy process method (AHP) and data mining to recommend products based on customer lifetime value. The wRFM based method employs association rule mining to identify recommendation rules from customer groups that are clustered according to weighted RFM values. There are two opposing views about weights of the three variables of RFM in the literature that they are identical or not. But some research indicated that recency, frequency and monetary are different in the importance due to the characteristic of the industry (29, 30). eRFM refers to adopting or extended model of RFM depends on the industries. Decision makers can effectively identify valuable customers and then develop effective marketing strategy by adopting RFM model (27). Recent studies suggest that the predictability of RFM models can be improved via adding additional variables when predicting customer behaviors (31, 32). Table 1 shows the recent researches of customer segmentation with RFM method and data mining techniques.
Data mining tools
Data mining tools are a popular means of analyzing customer data within the analytical CRM framework. Many organizations have collected and stored a wealth of data of their customers. However, the inability to discover valuable information hidden in the data prevents the organizations from transforming these data into valuable and useful knowledge (33).
Table1The recent researches of RFM method and data mining techniques in different industries
| RFM/eRFM/ | goal | Research field | Data mining technique | literatures |
|---|---|---|---|---|
| WRFM | product recommendations to each customer group | Marketing in a business | Clustering(k-means) and association rules | Duen-Ren Liu and et al.(2005) |
| RFM | find out the characteristic of customer in order to strengthen CRM | electronic industry | Clustering (K-means) and classification(rough set theory-LEM2) | Ching-Hsue Cheng and et al. (2009) |
| RFM | Sequential pattern mining to discover customers’ purchasing patterns over time. | on-line retailers of electronic commerce | Sequential Pattern mining | Yen-Liang Chen and et al. (2010) |
| RFM_ WRFM | Cluster analysis to assess the customer loyalty | SAPCO Company | Clustering (K-means) | M. Seyed Hosseini and et al.(2010) |
| RFM_CRFM (C: count ) | Estimating customer lifetime value | a health and beauty company | Clustering (K-means) | M. Khajvand and et al. (2011) |
| GRFM (G: group refers to the customers’ purchase patterns | discover better customer | computer products | Clustering(PICC- Purchased items Constrained Clustering) | Hui-Chu Chang and et al.(2011) |
| RFM_RFMDR (D: discount and price, R: return times) | mine association rules of customer values | Online shopping | association rules (Supervised Apriori algorithm) | Wen-Yu Chiang and et al.(2011) |
| RFM | Identifying patients in target customer segments | hospital | Clustering (K-means) and classification(rough set theory) | You-Shyang Chen and et al.(2012) |
| LRFM (L: length, refers to the first and the last visit dates) | market segmentation of a children’s | dental clinic | Clustering((SOM) technique) | Jo-Ting Wei and et al.(2012) |
| WRFM | discover sequential patterns | applying the synthetic data generation algorithm | PrefixSpan algorithm (the conventional sequential pattern mining method) | Ya-Han Hu (2012) |
Data mining tools could help these organizations to discover the hidden knowledge in the enormous amount of data (21). In general, data mining has two major functions: the first one is to predict future tendency from an established model; the other is to locate unknown models from data. Models include: association, classification, estimation, prediction, affinity grouping, clustering, description and profiling (34). Lee (35) used Decision Tree and Association Rule tools to integrate the concepts of sequential pattern mining to extract features of Asthma attacks and predict chronic disease attacks. Abdelfattah (36) with data mining and serum examination and radioactive treatment, predicted whether Type C pneumonia pathologically changed to cirrhosis. Huang and Chen (37) used various data mining technologies to help machines learn to distinguish types of glaucoma. Lin (34) with Two-stage cluster analysis (Ward’s method and K-means) and decision tree analysis on 501 abnormal diagnoses in an emergency department found that nursing personnel make more frequent triage diagnoses than physicians do. The study of Yeh (38) analyzed dialysis patients' biochemical data to develop a decision support system to predict hospitalization of Hemodialysis patients and to suggest immediate treatments to avoid hospitalization. The research of Yang (39) used classification and decision tree to analyze the prediction model of patients’ demand in the Emergency department from real treatment situations. Also, many studies used data mining techniques to segment customers to identify potential and loyal customer in all industries. In the follow we explore some data mining models that used in the paper.
Classification
Decision tree application
Classification is one of the most common learning models in data mining (40, 41, 42). It aims at building a model to predict future customer behaviors through classifying database records into a number of predefined classes based on certain criteria (40, 17, 43, 44). Decision tree is an important technique is used extensively in classification. The advantages of decision tree theory include:
1) Can produce understandable rules;
2) Perform tasks without much computing
3) Can handle continuous and categorical variables
4) Can learn which attributes are important for classification (43).
Decision tree algorithm has been used in several studies for the purpose of customer database segmentation (45, 46). A CHAID decision tree subsequently splits customers into subgroups based on the chi-square statistic, identifying which variable splits the data best and whether further splitting induces a statistically significant improvement (47). Input of the classification algorithms is a table of objects with attributes which contain values for each object. One attribute is chosen to be the decision attribute, and then the remaining attributes are the condition attributes. This research calculated decision attribute with two approaches. Section 3 will explain this in detail.
Clustering: K-means application
Clustering is the process of grouping a set of physical or abstract objects into groups of similar objects (27). A cluster is a collection of data objects that are similar to one another within the same cluster and are dissimilar to the objects in other clusters (48). It is different to classification in that clusters are unknown at the time the algorithm starts. K-Means is one of the well-known algorithms for clustering which is very sensitive to the choice of a starting point for partitioning the items into K initial clusters (31).
Research framework
constraints in the health care industry
A patient is considered as a customer in health care industry in the literatures. This means a health care organization is equal to a business. So health care services marketing is an important concern of decision makers and stockholders. However there are some differences between patient going to a hospital and a customer going to a shop for buying goods or services. The major differences are:
1- Customer needs considered as permanent needs such as food and other things that need for living and comfort. But patient needs considered as case based temporary needs that may occur suddenly.
2- There is negative value of customer life time value in health care industry. Because patients preferred to improve as soon as possible. In other words short customer life is preferable. This is in contrast with traditional customer life time value.
3- Most of time patients are referred to the special hospital for various reasons such as: doctor prescription or order, lack of adequate equipment for specific disease or hospitalization and emergency department or triage referring and etc.
These differences are obstacles to behave patient as customer in marketing strategies in health care services but many researchers don’t assist them. This paper tried to minimum this conflict, therefore considers three conditions for analyzing patients information. First, only outpatient data (from emergency departments and medical clinics) are extracted. Second, a longer period is considered for extracted data from HIS (from 2009 to 2012) that finally, causes the large data records of patients for evaluating (768,864). In these circumstances we can see to a patient as a customer but even may be the cases that didn’t satisfy the conditions which the long period time and large data decrease this contrast.
Table 2Descriptive statistics of the model variables
| Field | Min | Max | Mean | Std. Dev | Variance | Median | Mode | Valid |
|---|---|---|---|---|---|---|---|---|
| Recency | 1 | 1511 | 924.806 | 394.597 | 155706.876 | 972 | 1506 | 234674 |
| Frequency | 1 | 50 | 2.612 | 3.933 | 15.468 | 1 | 1 | 234674 |
| Monetary | 1000 | 62272600 | 440167.1 | 1776964.302 | 3.1576E+12 | 72400 | 34000 | 234674 |
| Length | 0 | 1507 | 136.054 | 297.359 | 88422.609 | 0 | 0 | 234674 |
Empirical study
Shohadaye Tajrish Educational Hospital (ST Hospital) founded in 1966 on Tehran, Iran has more than twenty specialist clinics and four hundred beds considered as a big public sector hospital. Data records are extracted from hospital information system (HIS). Due to the nature of treatment industry and contrast between customer loyalty and patient loyalty, we select outpatient data records (emergency departments and medical clinics) to analyze patients’ behavior to detect all kind of the hospital customers and level of the loyalty. The time period taken in this study is four years. Period of time has long been considered as possible to increase transparency of patient behavior. The number of total outpatient transactions is 768,864 from September 2008 to October 2012. The study collects the data set of 234,690 patients who visited these emergency clinics in four years period.
Weighted RFML
The RFM model has been applied to various industries but it is rarely used in the context of the health care industry (2). Some researches try to develop RFM model and add some parameters to these three parameters (49) to extend the model for adapting to the industry. This study adopts L variable (length: time between first and last patient hospital admission) to custom RFM concept for hospitals. Added attribute make the balance among other attributes in the patient behaviors. For example, low frequency in a long time period didn’t show lower loyalty in the health care services, so length attribute compensate this. The descriptive statistics for R, F, M and L are presented in Table 2. If the first and the last visit dates are identical, the length is coded as 0. For the recency, the larger recency value is, the more recent the patient visits. Analytic hierarchy process (AHP) was used to determine the relative importance or weights of the RFML variables, WR, WF, WM and WL. We used questioner and interview to determine efficient factors on patient loyalty that add to RFM model and weights of the extended model from administrative managers and medical directors of ST Hospital (Churn and Expected value are two proposed variables that eliminated and Length variable added). According to the assessments, the relative weights of the RFML variables are 4.5, 8.3, 8.2 and 4.9 respectively (scale is 1-10).
Structure of the model
Structure of the model is shown as flowchart in Figure 1.
Step 1. Data records collection (initial data): The study selected data fields or attributes based on the RFML model from outpatient datasets of the HIS. These required features of the patients include: ID, age, gender, date of referring or admission, type of used services and the amount paid. In the first, datasets of ST Hospital are preprocessed to extract the customer transactions. 768,864 data records that belonged to 234,690 patients are collected. Each record contains information about each patient admission or transaction.
Step 2. Data records preparation (ready data): Data preprocessing is an inevitable step in knowledge discovery process. This step first, eliminates records which include noisy, inaccurate and missing values. In this case more than 150,000 records are deleted. These records include incorrect values such patient referrals with zero payment or invalid date and etc. Second, some features of data records are transformed into a format to be ready for next step. For example date of admission transformed to the number. Finally, RFML variables are calculated based on all transactions of each patient that make a table with 234,690 records. Also according to the assessments obtained by the AHP, the relative weights of the RFML variables are determined.
Step 4. Data normalization.
We normalize R, F, M and L variables to be consistent in terms of numerical unit. So they are standardized to the interval [0, 1]. The equations for normalization are shown below (2):
V= Vi / Max (Vi) that V={R, F, M, L}
Step 5. Determination of the cluster number (K)
Despite the classification algorithms, the segments are unknown in the clustering algorithm. But the number of segments must be defined by user in some algorithms such K-means. In this study Two step method is used to predict the optimum K or number of clusters. Two step algorithm don’t need the exact number of clusters which was defined by user while it finds the optimum number of cluster in a range which defined by user (49). Here, the proposed optimum cluster number is 5.
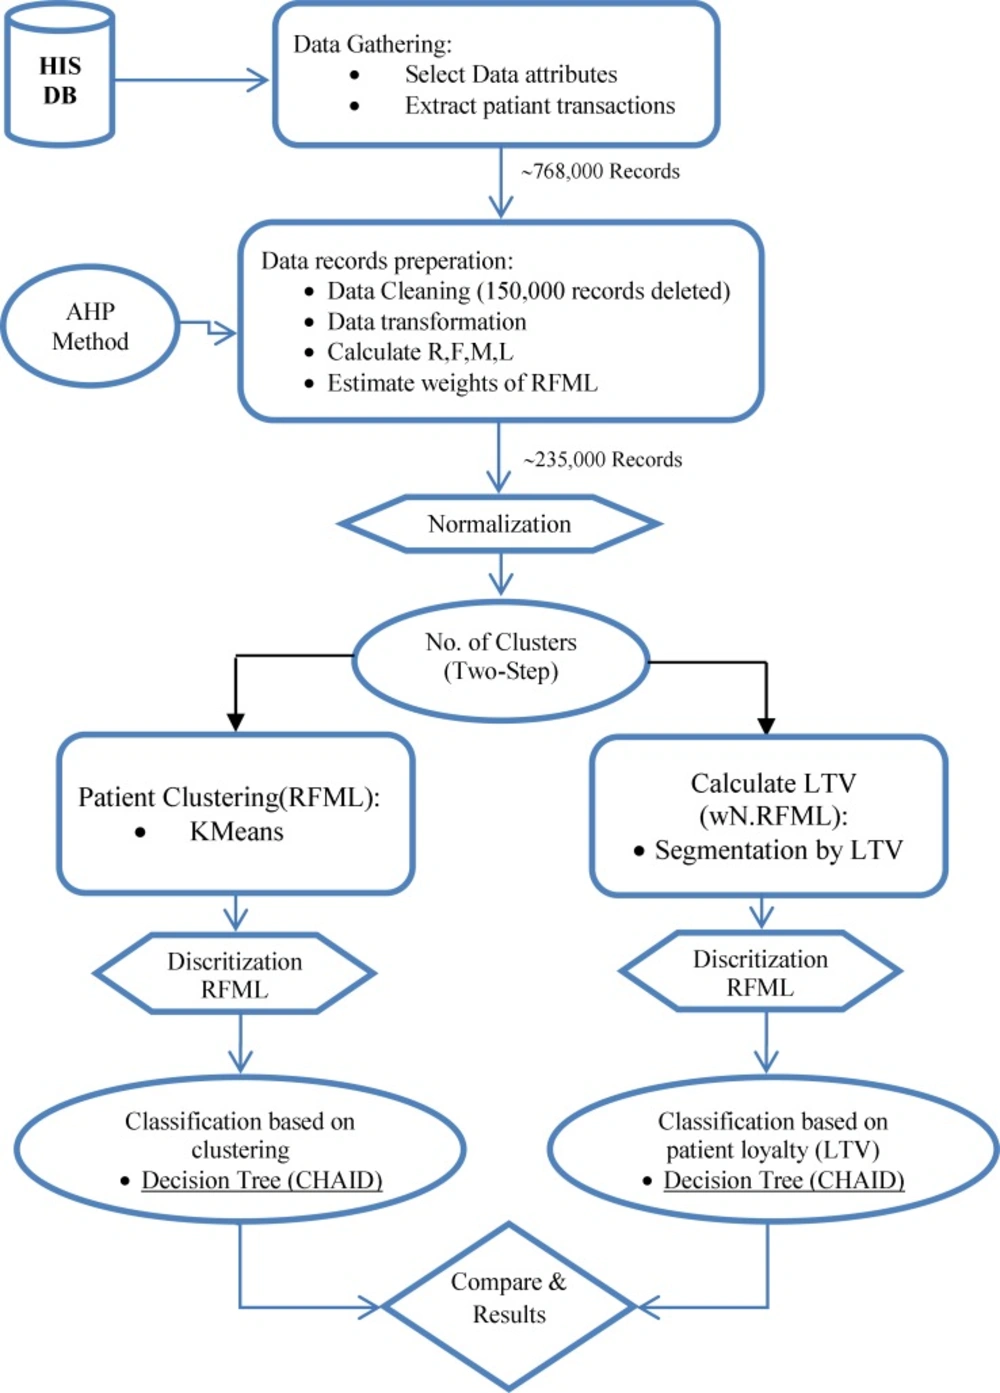
Figure 1
Flowchart of the proposed classification model
Step 5-1. Patient Clustering
The general purpose of clustering attempts to maximize the inter-cluster distance (to ensure the clusters are well separated) while minimizing the intra-cluster distance (to ensure compactness of the clusters) (2).
According to quantitative value of normalized R, F, M and L attributes for each patient, data partitioned into 5 clusters using the K-means algorithm (based on two ways: non weighted and weighted parameters). Table 3 shows the result of this clustering (for better understanding, principle value of variables are shown). Also importance of RFML variables in 5 clusters is shown in figure 2. In addition to find all segments of the customers and identify profitable patients, there is main reason for performing this step. The output of running K-means algorithm is a column which identifies each patient is belonged to which segment. This is the value that will be used as decision attribute for classification algorithm in the step 5-1-2.
Table 3Descriptive statistics of five clusters
| | | Frequency | Length | Monetary | Recency | ||||||
|---|---|---|---|---|---|---|---|---|---|---|---|
| Total N | % | Mean | Standard Deviation | Mean | Standard Deviation | Mean | Standard Deviation | Mean | Standard Deviation | ||
| Kmeans | cluster-1 | 96609 | 41.17 | 1.58 | 1.43 | 21.08 | 66.82 | 225826.7 | 1190472 | 523.2 | 220.83 |
| cluster-2 | 3396 | 1.45 | 25.84 | 8.66 | 1134.49 | 254.3 | 3957069 | 5407150 | 1407.77 | 118.36 | |
| cluster-3 | 99675 | 42.47 | 1.67 | 1.47 | 18.47 | 49.11 | 377182.2 | 1639632 | 1191.51 | 187.53 | |
| cluster-4 | 14060 | 5.99 | 6.87 | 3.91 | 987.44 | 188.3 | 842459.5 | 1780686 | 1345.89 | 133.05 | |
| cluster-5 | 20934 | 8.92 | 5.23 | 3.95 | 492.73 | 149.13 | 888509.2 | 2576546 | 1147.11 | 222.46 | |
| Total | 234674 | 100 | 2.61 | 3.93 | 136.05 | 297.36 | 440167.1 | 1776964 | 924.81 | 394.6 | |
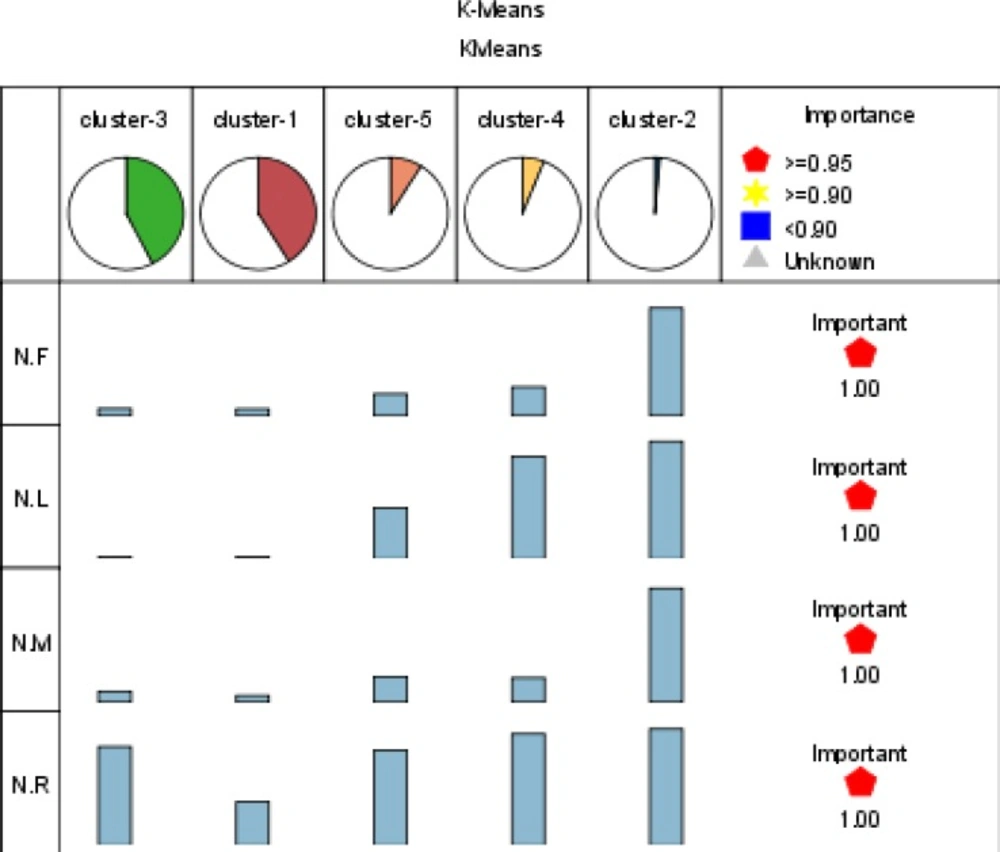
Figure 2
Importance of RFML variables in 5 clusters
Step 5-2. Estimation of CLV
The proposed optimum K is used to categorize all patients by customer value or CLV to K segments. The output of this segmentation will be used as decision field for classification. In the first, CLV is calculated based on weighted RFML method for each customer by equation 3. Relative importance of the variables is 4.5, 8.3, 8.2 and 4.9 respectively.
CLVCi= NRci*WR + NFci*WF+ NMci*WM+ NLci*WL (equation 3)
Table 4Discrete values of continuous attributes in RFML model
| variables | Range | Discrete value |
|---|---|---|
| Recency_TILE5 | [1-543), [543-826), [826-1097), [1097-1323), [1323-1511] | R1, R2, R3, R4, R5 |
| Frequency_TILE5 | [1-2), [2-3), [3-4), [4-5), [5-50] | F1, F2, F3, F4, F5 |
| Monetary_TILE5 | [1000-34100), [34100-51002), [51002-111101), [111101-410300), [410300-62272600] | M1, M2, M3, M4, M5 |
| Length_TILE5 | [0-1), [1-2), [2-3), [3-167), [167-1507] | L1, L2, L3, L4, L5 |
Second, patients are categorized into 5 segments (K optimum number of Two step algorithm) based on CLV of each patient. Now we have loyalty attribute for each patient that show customer class based on CLV value. Finally, this attribute is considered as decision field for classification in the step 5-2-2.
Step5-1-1 & Step 5-2-1. Data discretization
For improving the classification accuracy and solving the challenge of generating a large number of decision rules in the segmentation models, attributes are granulated (2). Applying discritization to data decrease further processing time of many method as well as increase quality of results (50). Continuous attributes in pervious step are granulated using Binning method. The Binning discretization based on the tiles method (equal count) is implemented to discretize all continuous attributes. Binning method can be useful for create categorical inputs to increase performance of classification method and data privacy. Table 4 shows discrete values of continuous attributes in RFML model.
Step5-1-2 classification by clusters (approach 1)
Decision tree algorithm (CHAID) is used to generate the decision rules set from the experimental dataset for classifying ST hospital patients. Practically, a classification model is first built on a training set. Afterwards, the model is validated using previously unseen data, the test set (51). The experimental dataset is randomly divided into two groups, data serving as a training set and the remaining serving as a testing set. The generated rules sets supports the ‘if-then’ rules set as the knowledge-based system to determine the decision- making strategy and intelligently offer explanatory power (2). In the first, all classification algorithms needed condition attributes and decision attribute. These attributes are chosen based on health care experimental knowledge and expert point of view. In this case, decision field is cluster number of patient that determined in the step 5-1. And discretized recency, frequency, monetary and length are condition fields for running CHAID method. Efficacy of the input variables is shown in Figure 2.
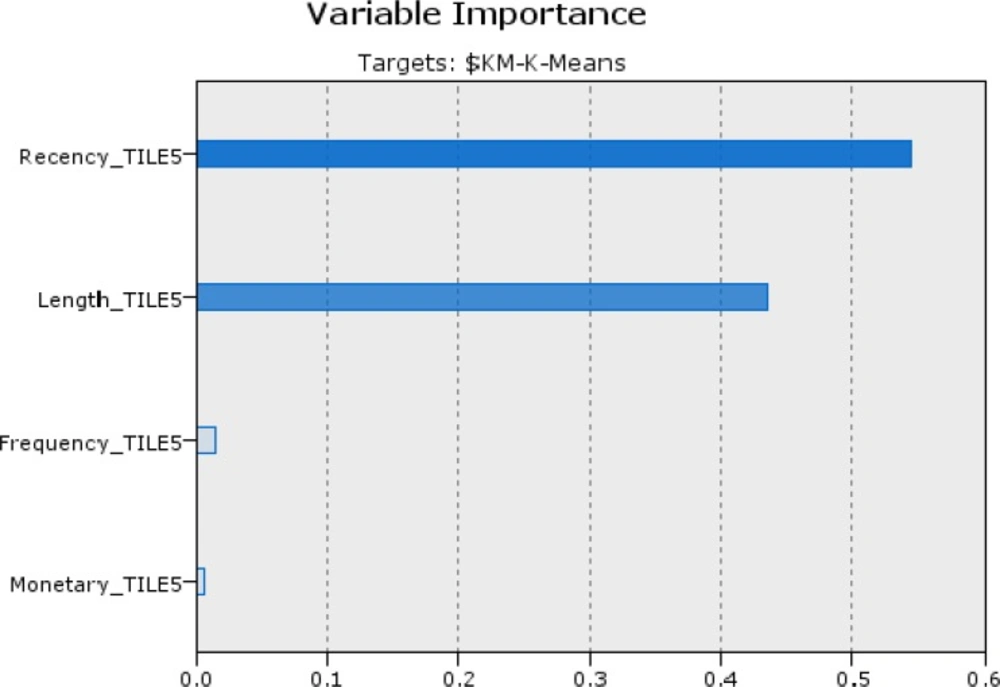
Figure 2.
Importance degree of the variables in ascending order is: R=0.5449, L=0.4345, M=0.0148 and F=0.0058 in the classification by clusters method
Step 5-2-2 classification by CLV (approach 2)
In the approach, customers are classified with CHAID algorithm based on CLV categories as decision field (step 5-2). Figure 3 shows the degree of impact and importance of the variables in the classification by CLV method. In the following we compare the result of two approaches of classification.
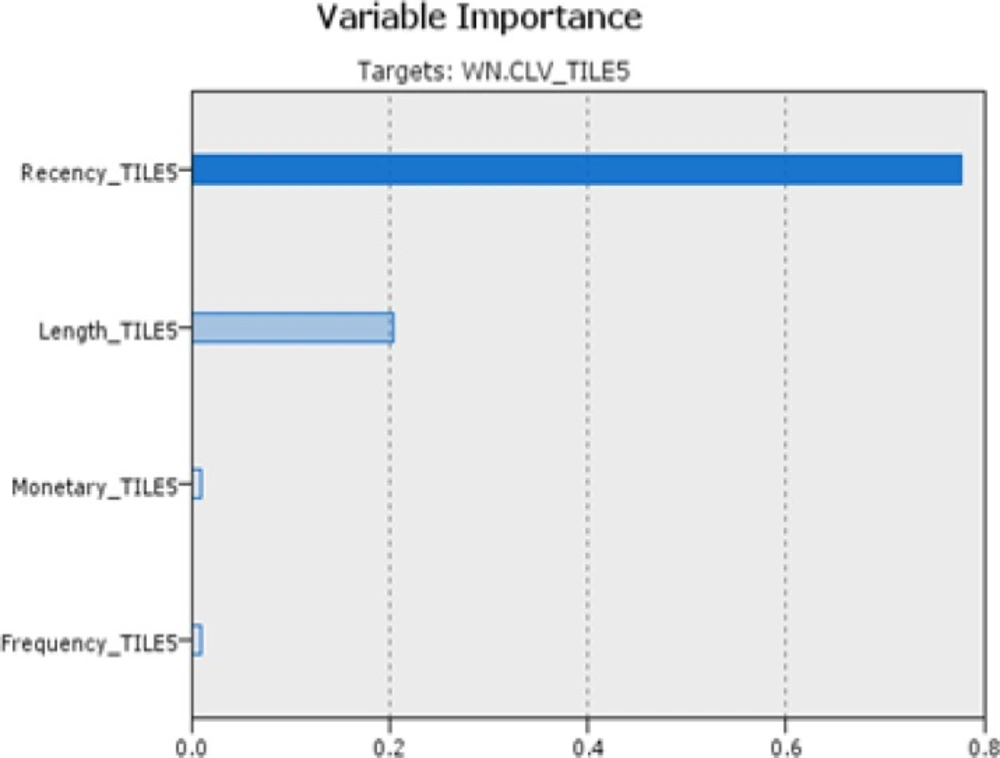
Figure 3
Efficacy of the variables in ascending order is: R=0.7766, L=0.2046, M=0.0096 and F=0.0092 in the classification by CLV
Step 8. Compare & extract rules
Order of variables importance in the both methods is the same. This shows recency and length respectively have the greatest impact on identify target customers in health care services. Results of output fields of two approaches by comparing actual and predicted class (coincidence matrix and performance evaluation) displayed the first approach, classification by k-means, has more accuracy (89.69%) than classification by CLV (80.98%). This experiment was examined by C5 and neural network algorithms for evaluations. Performance evaluations results are shown in table 5. As can be seen, Decision tree by CHAID algorithm performed better other methods in accuracy. In the following, outcomes of extracted rules of selected approach were analyzed.
Table 5Comparison of the models accuracy and other algorithms
| method | Accuracy (%) |
|---|---|
| Classification by clustering (decision tree - CHAID) | 89.69% |
| Classification by CLV(decision tree- CHAID) | 80.98% |
| Decision tree-C5 | 89.58% |
| Neural network | 89.31% |
Findings
clustering analysis
Table 3 shows descriptive statistics of 5 clusters including, number of patients, percentages, average and standard deviation of all parameters (R, F, M and L). The results indicate meaningful relations among attributes in the clusters. Cluster 2 has the best customers with high value in all attributes. These profitable customers are 1.45% of all patients (234, 674) who indicate loyal patients of the hospital. This is a fact that greater contributions and revenue can be achieved by fewer target customers (according Paretto rule). Length and recency factors indicate these patients were active during the total period that considered in this study (four years) and also have maximum number of usage (in average 25). Cluster 1 has the customers with lowest value of all attributes and considerable numbers (41.17%). These patients have one time referrals in average and more than three years have been inactive that means customer churn. Other clusters (3, 4 and 5) show the patients that may be return again and have readmission (because of recently admission), so the hospital managers must be establish better relationship to improve satisfaction of these customers.
Table 6Extracted rules from classification model based on k-means clustering
Extract and interpret the rules
CHAID method based on importance degree of input variables creates a decision tree. Decision tree in this experiment has depth of 4 that Recency_TILE5, Length_TILE5, Frequency_TILE5 and Monetary_TILE5 variables are entered respectively (with 0.54, 0.43, 0.01 and 0.01 importance). Table 6 shows extracted rules from ST hospital dataset by CHAID algorithm based on k-means clustering. As follows from this table there are meaningful relations among recent lookup of patient (recency), time duration that patient refer to the hospital for services (length), the number of times for visiting (frequency) and total fees paid by patient (monetary). The analytic results of treated patients within four years on ST hospital show interesting knowledge as described below. It should be noted the time period considered in the study is 4 years.
- All patients that last visit were about 947 days ago (about 3 years ago- first year of the considered period time of this study) definitely fall in cluster 1 or churn customers. The number of churn customers are considerable (41.17%). But the hospital loses them and must spend a lot of money for acquisition of this market segment. Hospital management should try to compensate this by improving quality of the services and strong customer relationship to cause less churn rate from now.
- Patients that last visit were about 1.5 years ago (second year of the considered period time of this study) with low and medium monetary (<M5), despite the low value of frequency and length attributes can be valuable customers as low value patients. The number of this segment is considerable (42.47%). Due to temporary needs of people to health care services this market segment may return and use the hospital services when they need. Due to the large number of this patients and likelihood of readmission, the administrators can guarantee significant profitability in the future by spending money to build a strong relationship with these customers.
- Patients that last visit were about 6-7 month ago with long time activation (L5), upward monetary (>=M4) and minimum number of visit 4 times (F>=F4) are very high value customers. This segment is profitable following of loyal customers but the number is more than loyal patients (6% of all customers). The hospital management should operate on these patients has become loyal customers by introduce new, free and supplementary services.
- Patients that last visit were about 1 year ago with long term activation (L5) and frequency more than 2 times (>=F3) are high value customers. The result shows monetary of this patient are significant.
- Ranking of all segment based on meaning rules extracted from decision algorithm (CHAID) are: loyal segment, very high value, high value, medium value and churn group in ascending order that the number of each segment are: 1.45%, 5.99%, 8.92%, 42.47% and 41.17% respectively. The administrators should adopt appropriate strategies to suit each group in order to further profit for the hospital.
conclusion and suggestion for marketing development
Nowadays, health care industry like other industries should interact with patients as customers and implement strong marketing strategies for equation and retention of them. There are some differences between patient and customer needs and requirements which must be considered for assessment them. This research develops a classification method based on weighted eRFM (RFML) with clustering and customer life time value (CLV) as two approaches. The results show classification based on clustering (k-means) has more accuracy than CLV method. The outcomes of the study identify all patients’ classes of ST hospital and behavior of them. More revenue of the hospital generated from less than 1.5% all customers as loyal patients, so the managers should adopt special and custom relations to hold and retention of the profitable market. A large number of patients placed in churn group (41.17%) that shows such shortcoming or low quality of hospital services. Also the result shows there is a significant group (42.47%) that recently visited with medium monetary and low frequency and length attributes who is a new opportunity for the hospital. The hospital administrators should establish excellent relationship and implement marketing strategies to improve satisfaction of this new market. This article highlighted the role of Customer Relationship Management in the hospitals and proposed a classification model for identifying all kind of patients to improve marketing strategies. Further research will focus on the effective factors and reasons on choosing hospital by patients with aim of services quality improvement.
