Chemicals
Dulbecco’s Modified Eagle’s Medium (DMEM) and fetal bovine serum (FBS) were purchased from Gibco-BRL (Rockville, IN, USA). Anti-Bcl-2 (1:1000), anti-Bax (1:1000), anti- GAPDH and anti-rabbit IgG horseradish peroxidase (HRP) (1:10000) antibodies were purchased from Cell Signaling Technology (Beverly, MA, USA). All other chemicals were from Merck (Darmstadt, Germany) and Sigma-Aldrich (St Louis, MO, USA). ECL advance western blotting detection kit was prepared from General Electric Health Care Life Sciences (Buckinghamshire, UK).
Plant material and extracts preparation
C. nobile aerial parts were purchased from herbal medicine stores in Tehran, capital of Iran in 2012. It was characterized by herbarium department of Faculty of Pharmacy, Tehran University of Medical Sciences. 20 g of plant powder was extracted sequentially by solvents with different polarities including hexane, chloroform, ethyl acetate and methanol using a maceration method. The process was repeated 3 times with the same plant material but using fresh solvents. After maceration, the extracts were filtered and evaporated to dryness on a rotary evaporator under reduced pressure below 40 ºC. All the extracts were stored at 4 ºC until used for experiments. Yields were 2.66, 2.53, 1.36 and 5.53% for hexane, chloroform, ethyl acetate and methanol fractions, respectively.
Cell culture
MCF-7 (human breast adenocarcinoma), K562 (human erythroleukemia) and SKMEL-3 (human melanoma) cell lines were obtained from the national cell bank of Pasture Institute of Iran (NCBI). Cells were cultured in DMEM with 10% (v/v) FBS, (100 U⁄mL) penicillin and (100 µg ⁄mL) streptomycin under the conditions of 5% CO2 at 37 ºC.
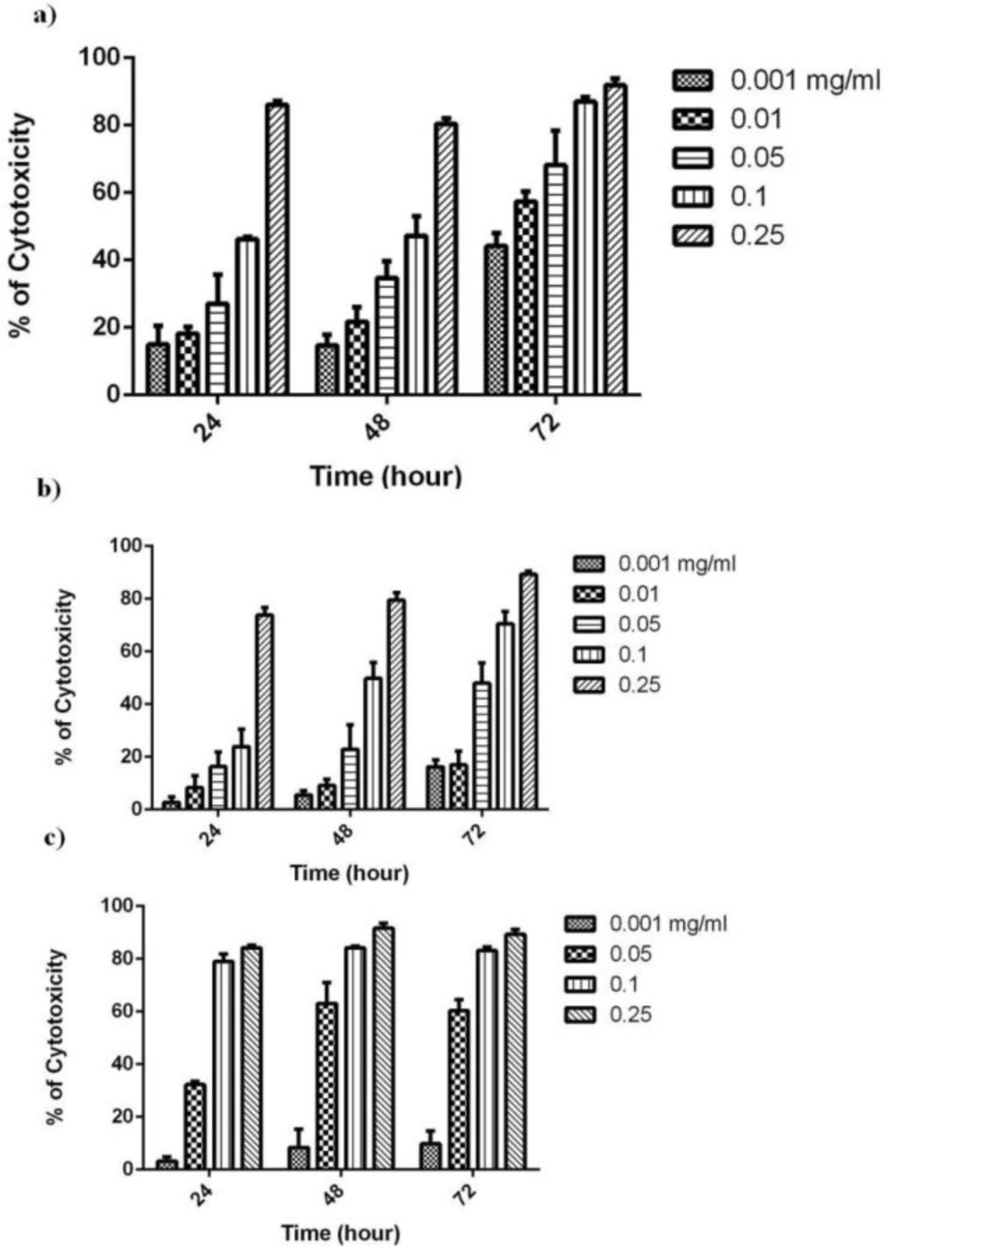
MTT cytotoxicity assay
The effect of ethyl acetate fraction of Chamaemelum nobile on the cytotoxicity of MCF-7, K562 and SK-MEL3 cell lines was determined by MTT assay. The cell proliferation test is based on the ability of the mitochondrial succinate-tertrazolium reductase system to convert yellow tetrazolium salt, MTT (3-(4,5-dimethylthiazol-2-yl)-2,5 diphenyltetrazolium bromide) to purple formazan dye. The cells were added to make 6-8 × 10³ cells/well in a 96-well plate including 200 µL of complete culture medium and incubated for 24 h at 37 °C in 5% CO2. Afterwards, cells were exposed to different concentrations of ethyl acetate fraction (0.001- 0.25 mg/mL) and incubated for 24, 48 and 72 h. The solvent DMSO treated cells served as control. Afterincubation at 37 ºC in a humidified incubator, cells were treated with MTT (5 mg/mL) reagent for 4 h at 37 ºC and then, the medium was removed by aspiration and 200 µL of DMSO was added per well. The absorbance at 545 nm was measured using ELISA Microplate Reader (Star Fax-2100, ST. Louis, USA) .The number of viable cells was proportional to the extent of formazan production. Cell viability was measured as the percentage of absorbance compared with control. The 50% inhibitory concentration (IC50) value, the concentration of extract required to inhibit 50% cell growth, was determined from concentration-response curves following a 24, 48 and 72 h exposure times. All experiments were conducted with 3 replicates.
Flowcytometry analysis
Cell cycle phase distribution was determined by analytical DNA flowcytometry. MCF-7 cells were incubated for 72 h with 0.001 mg/mL (1/2 IC50) of ethyl acetate fraction. Cells were harvested and adjusted to 106 cells/plate in 6-well plates and stained with Propidium Iodide (PI) reagent at 37 ºC for 15 min in the dark. PARTEC flowcytometer (Partec GmbH, Munster, Germany) with Flowjo software was used to analyze DNA content using UV light. The percentage of cells in the various phases was determined, and statistical analysis of data from flowcytometry experiments was carried out.
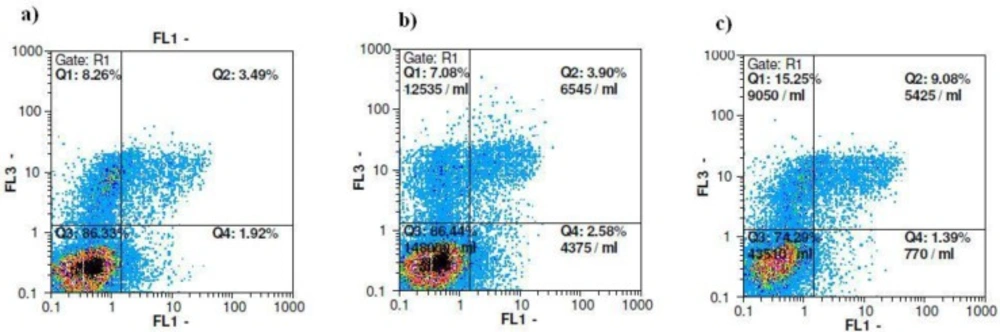
Identification of apoptosis by annexin-V/PI staining
Following treatment, 106 cells were washed in PBS and resuspended in 100 µL of annexin-V-FLUOS labeling solution containing 2 µL annexin-V-FLUOS labeling agent, 2 µL Propidium Iodide (PI) solution and 1 mL incubation buffer to achieve a concentration of 106 cells/mL. Following incubation at 37 ºC for 15 minutes, cells were analyzed by flowcytometry. Annexin-V binds to cells expressing phosphatidyl serine on the outer layer of the cell membrane, and PI stains the cellular DNA of those with a compromised cell membrane. This allows for the discrimination of live cells (unstained with either fluorochrome or PI) from apoptotic (stained with annexin-V) and necrotic cells (stained with PI).
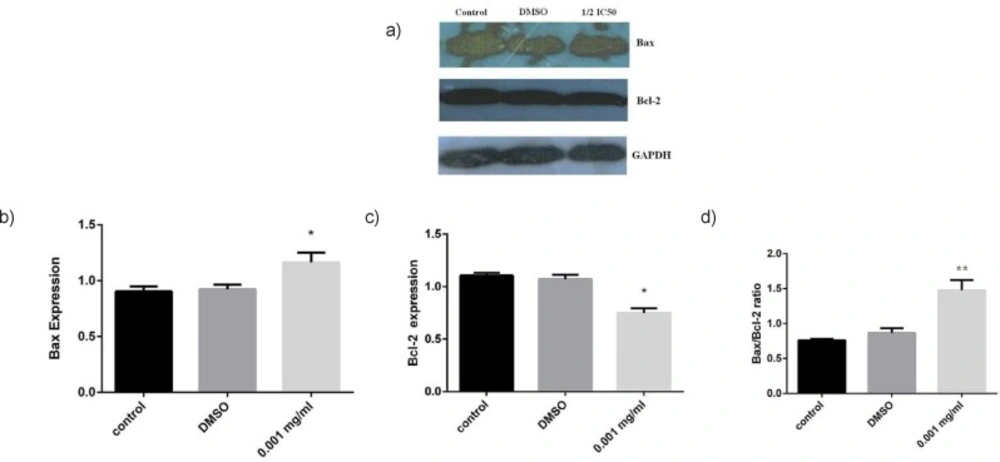
Western blot analysis
MCF-7 cells were treated with ethyl acetate fraction at 1/2 IC50 concentration for 72 h. Proteins were extracted from distinctively treated cells, collected and lysed in lysis buffer (Tris 62.5 mM (pH 6.8), DTT 50 mM, SDS 10%, glycerol) in the presence of protease inhibitors. Then, equal amounts of protein were heated to 95 ºC, separated in 12% SDS- polyacrylamide gels and transferred to PVDF membranes. The membrane was then blocked for 2 h in TBST (50mmol/L Tris-Cl, pH 7.6, 150 mmol/L NaCl and 0.1% Tween 20) containing 1% (w/v) casein, and then incubated with primary antibodies overnight, followed by incubation with HRP conjugated goat anti-rabbit IgG for 2 h. Blots were then developed using ECL advance western blotting detection kit. The signals from each protein band were normalized against the GAPDH (Glyceraldehyde Phosphate Dehydrogenase) content using the polyclonal anti-GAPDH antibody. The expression level of control was designated value “1”, and thereby the expression ratios of the treatments were expressed in relation to the control.
Statistical analysis
IC50 values were calculated by non-linear regression analysis with Graph Pad Prism 6.0. Results were expressed as the mean ± SE of at least triplicate determinations, and statistical comparisons were based on ANOVA followed by the Tukey’s post test. P < 0.05 was considered to be significant.