Snake venom collection
Extraction of venom from the snake’s venomous gland was performed in the Department of Venomous Animals and Antivenom Production, Razi Vaccine and Serum Research Institute, Karaj-Iran by allowing the snake to bite into parafilm stretched over a glass cup. Extracted venom was centrifuged for 10 min at 500
g. The venom was frozen in a −80 °C deep freezer for 4 h and then lyophilized. Working concentrations of venom were prepared freshly by diluting the lyophilized venom in culture media on the days of experiments (
14). This study was approved by the ethics committee of Shahid Beheshti University of medical sciences and Razi Vaccine and Serum Research Institute.
Cell lines and cell culture
human breast cancer (MCF-7), Human hepatocellular carcinoma (HepG2) and human prostate carcinoma (DU145) cell lines as well as a normal cell line (normal dog kidney cell line; MDCK) were obtained from National Cell bank of Iran (NCBI) affiliated to Pasteur Institute of Iran. Cells were cultured in RPMI1640 (Gibco, Paisley, UK) supplemented with 10% fetal bovine serum (Gibco, Paisley, UK) and penicillin/streptomycin (100 unit/mL) under the humidified atmosphere of 5% CO
2 and 95% air at 37 °C (
15).
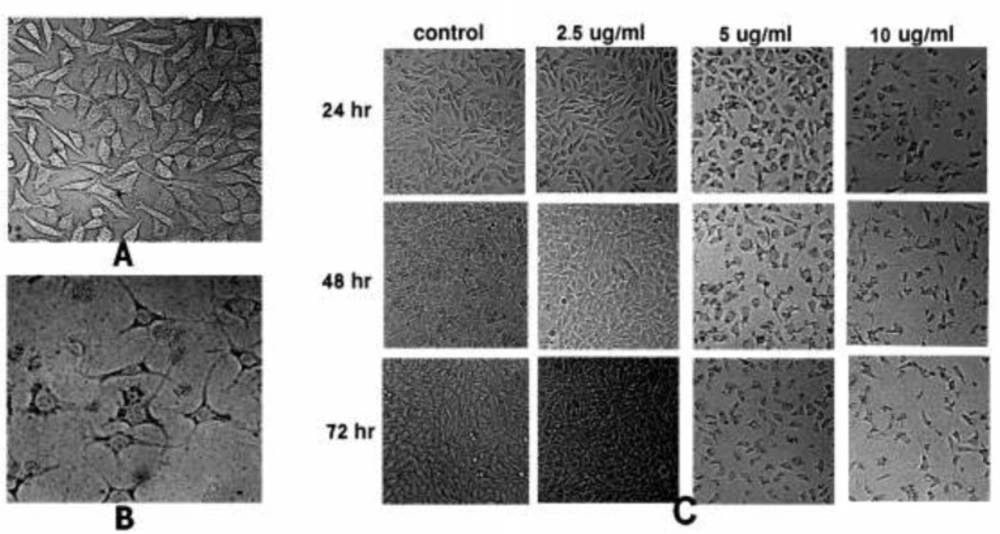
Cell Morphology Analysis
The cells were treated with different concentrations of SVT for 24, 48 and 72 h and morphological alterations were investigated using a normal inverted light microscopy (Euromex, Holland) equipped with a digital camera (Moticam Pro 2828, China).
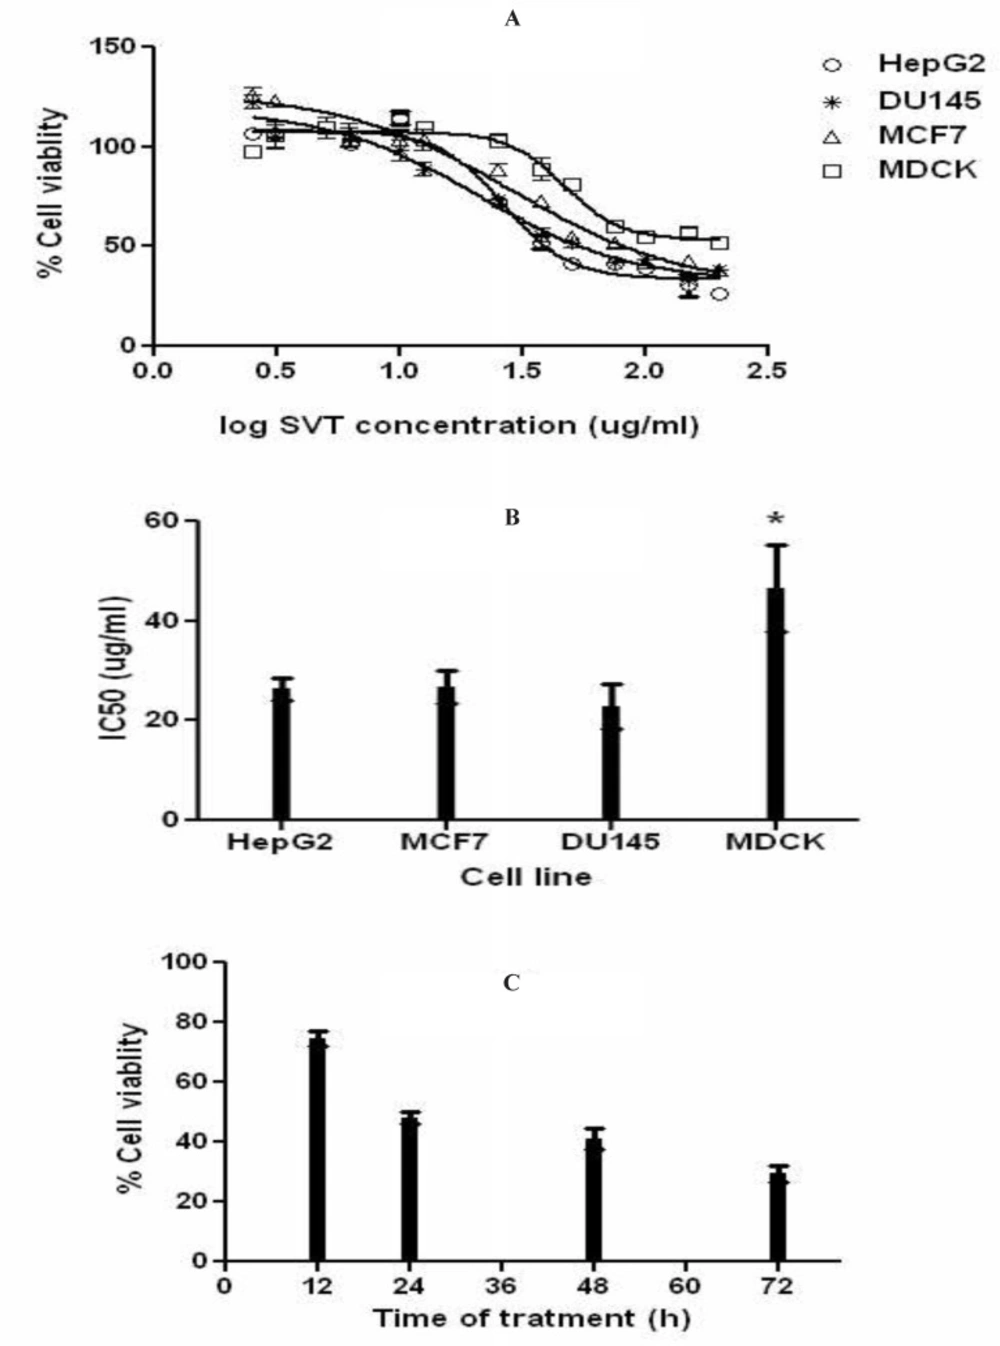
Cell proliferation assays
The half maximal inhibitory concentration (IC
50) values of venom on different cell lines were evaluated using MTT (3-(4, 5-dimethylthiazol-2-yl)-2, 5-diphenyltetrazolium bromide) assay. The cells were grown (10
4 cells/well) in 96-well plates for 24 h at 75% confluency. Cells were then treated with different concentrations of SVT for 24, 48 and 72 h. At the end of treatment, cells were exposed to MTT (5 mg/mL) and incubated at 37 °C for 4 h. After the removal of supernatant, 100 µL of DMSO was added to each well and the plates were left incubated for 10 min to solubilize the formazan crystals. Absorbance for each well of plates was measured using a microplate reader (BioTek-EL808, United States) at a test wavelength of 595 nm and a reference wavelength of 690 nm. The optical density (O.D.) was calculated as absorbance at the reference wavelength minus that of the test wavelength (
16).
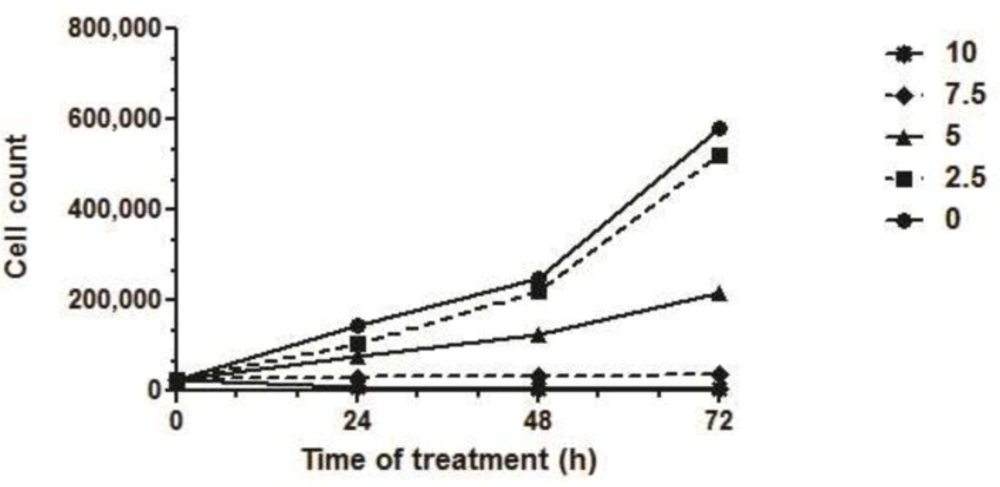
Trypan blue exclusion assay
To study the cytotoxic effects of SVT and determine viable cell numbers, the cells were seeded in 12-well plates (3×10
4 cells/well). The cells were treated with different concentrations of venom for 24, 48 and 72 h. At the end of treating time, the cells were harvested by trypsinization and stained with 0.2% trypan blue and then were counted using a hemacytometer under the light microscopy. Trypan blue penetrated cells were considered dead, whereas trypan blue excluded cells were considered to be viable. Each assay was carried out for triplicate and the concentration of the SVT which causes 50% reduction in viable cell count (IC
50) were calculated by dividing number of viable cells in treated group to the number of viable cells in control (untreated) group (
17).
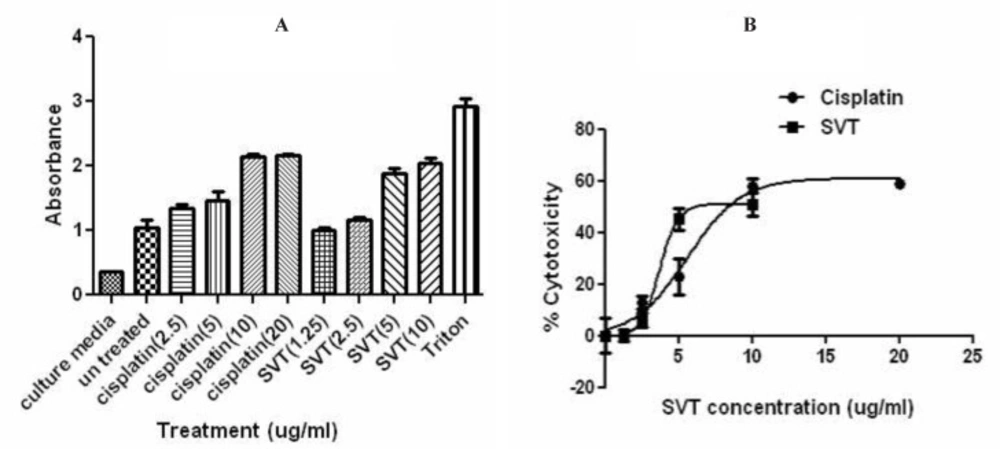
Lactate dehydrogenase (LDH) release assay
Cytolysis was assessed by determining the release of the cytosolic enzyme lactate dehydrogenase. Briefly, Cells were seeded in 96-well plates at the density of 1×10⁴ cells/well in culture medium. following overnight incubation, the medium was replaced with serum free medium and cells were exposed to various concentrations of venom. Some wells were exposed to the different concentrations of cisplatin as a positive control. Cells were incubated for 24 h and LDH activity was measured in the supernatants using the in-vitro toxicology assay kit (Cytotoxicity Detection Kit, Cat. No.1644793, Roche, United States) according to manufacturer’s instructions. Spectrophotometric absorbance of the colored formazan was determined using the microplate reader at 490 nm wavelength and 690 nm reference wave length. Reference controls for 0% (low control) and 100% (high control) cytolysis consisted of medium of untreated cells and medium from cells incubated with 0.1% (v/v) of Triton X-100, respectively. All assays were repeated in triplicate.
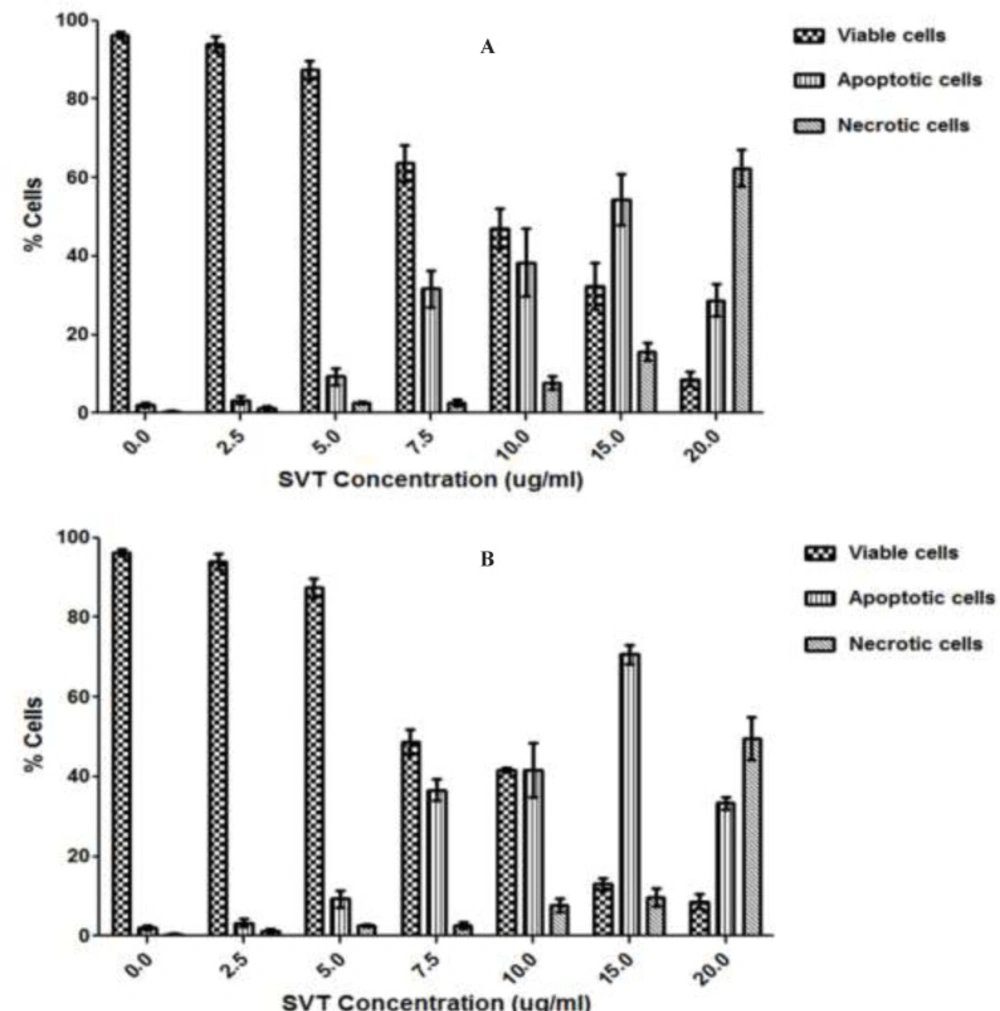
Fluorescence microscopic analysis of cell death
To further investigate on the mode of cell death caused by this venom, apoptotic and necrotic cells were determined using acridine orange/ethidium bromide double staining method as described by Niknafs and Shirazi in 1998. Acridine orange is taken up by both viable and nonviable cells and emits green fluorescence. Ethidium bromide is taken up only by nonviable necrotic cells and emits red fluorescence due to the dye intercalation into DNA. Briefly, after the exposure time, cells were harvested by trypsinization, centrifuged at 700g, washed with PBS and treated with ethidium bromide (EtBr) and acridine orange (AO) solution (both 25µg/mL in PBS) and finally observed under a Moticam Pro 2828 fluorescence microscope (
18).
Treated cells were quantitated according to the following descriptions: (A) normal nuclei (bright green chromatin with organized structure), (B) early apoptotic (bright green chromatin that is highly condensed or fragmented), (C) late apoptotic (bright orange chromatin that is highly condensed or fragmented) and (D) necrotic (Deep saturated red cells). At least 200 cells from randomly selected fields were counted and quantitated for each data point. The apoptotic index (percentage of apoptotic cells) was calculated as the number of apoptotic cells/total cells counted multiplied by 100 (
19).
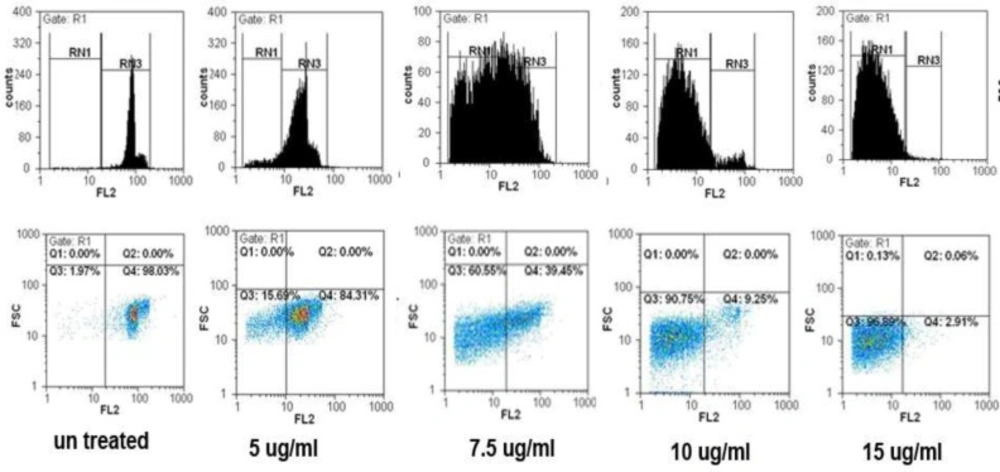
Flow cytometric analysis of apoptosis
Propidium iodide (PI) stained cells flow cytometry was carried out to quantify the apoptotic cells (
20). Briefly, Cells were seeded in 25 T flask, and treated with various concentrations of SVT for 24 and 48 h. Cells were then harvested by trypsinization, collected by centrifugation (700
g for 10 min at 4 °C), washed twice with ice-cold PBS and collected again by centrifugation. Cells were then fixed in 70% (v/v) ethanol at 4 °C for 30 min. After fixation, cells were centrifuged and resuspended in 1 mL buffer (100 µg /mL RNase A, 500 µg/mL propidium iodide in PBS) at 37 °C for 30 min. Cells were detected using a flow cytometry (Partec-CyFlow space) using 620 nm filter for PI detection, and analyzed by software program (Partec-FloMax, USA). The cell cycle distribution and proportion of the sub-G1 group (apoptosis) were determined and analyzed.
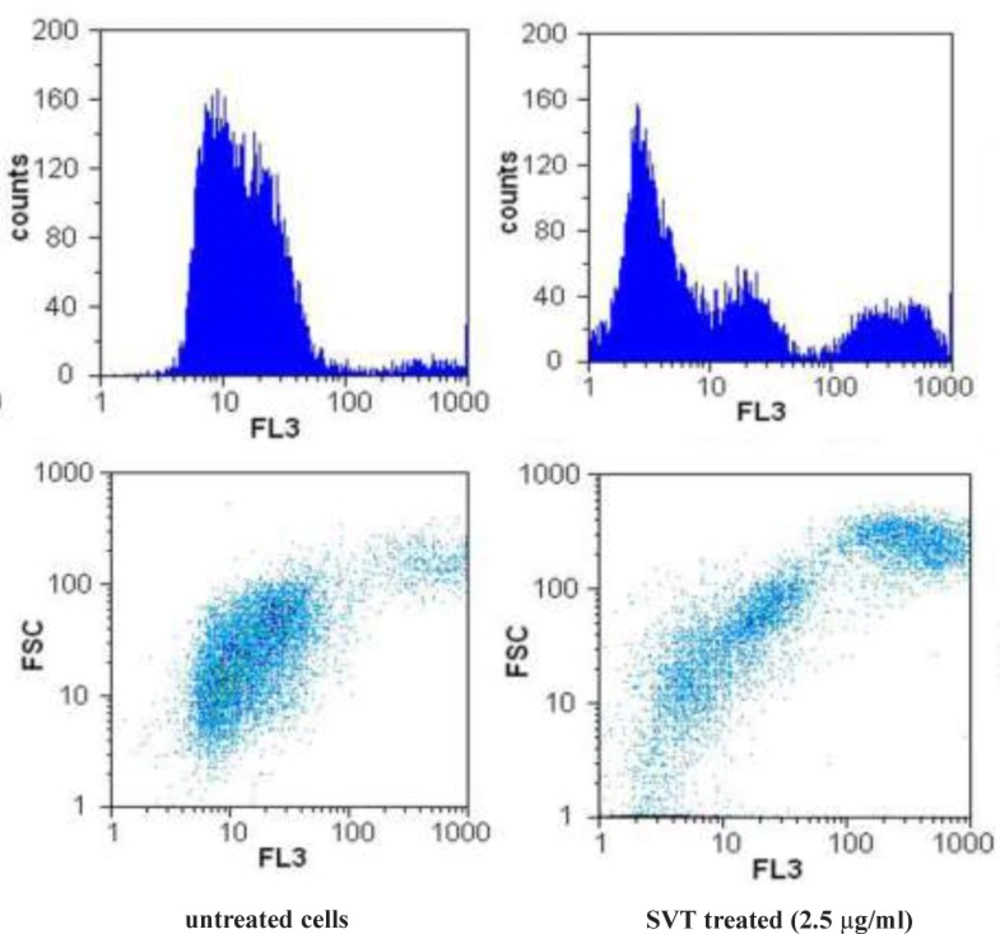
Flow cytometric detection of mitochondrial membrane potential
Changes in mitochondrial membrane potential were studied with the use of Rhodamine123 (Rh123). Approximately 5x10
5 HepG2 cells/mL in 12-well plates were treated with 2.5 µg/mL of SVT for 24 h. At the end of treatment, cells were washed twice with PBS, incubated with Rhodamine 123 (0.5 µM) in the culture medium for 30 min at 37°C and then analyzed using a flow cytometry as described previously (
21).
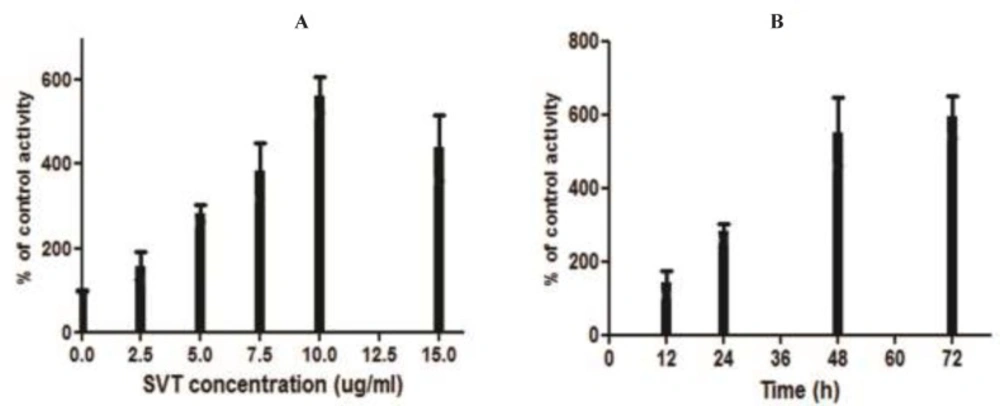
Caspase-3 activity assay
Caspase-3 activity in the treated and control cells, was measured using a caspase-3 colorimetric assay kit (Sigma, St Louis, MO, USA) according to the manufacturer's instructions. The kits utilize synthetic tetrapeptides labeled with p-nitroanilide. Briefly, 1×10⁶ cells were treated with different concentration of SVT (0, 2.5, 5, 7.5, 10 and 15 µg/mL) for 24 h. In addition, 1×10⁶ cells were treated with 5 µg/mL SVT for 12, 24, 48 and 72 h. Then the cells were lysed in the supplied lysis buffer. The supernatant was collected and incubated with the supplied reaction buffer containing dithiothreitol and substrates at 37°C. The reaction was measured by changes in absorbance at 405 nm using a microplate reader (BioTek-EL808, United States). The result of control groups were set as 100% activity and test groups were compared to this value.
Statistical analysis
The data were expressed as mean±standard deviation (SD) of three independent experiments. Wherever appropriate, the data were subjected to statistical analysis by non-parametric linear regression, Student’s t-test and one-way analysis of variance (ANOVA) followed by Dunnett’s method for multiple comparisons test. A value of p<0.05 was considered significant. All statistical analyses were performed using GraphPad Prism® version 5.00 for Windows (GraphPad® Software, San Diego, CA).