Design and Optimization of a New Voltammetric Method for Determination of Isoniazid by Using PEDOT Modified Gold Electrode in Pharmaceuticls

authors:

avatar Fatma Demirkaya-Miloglu a , * , avatar Tuba Oznuluer b , avatar Buket Ozdurak b , avatar Elmas Miloglu a

Ataturk University, Faculty of Pharmacy, Department of Analytical Chemistry, 25240 Erzurum/TURKEY.
Ataturk University, Faculty of Chemistry, Department of AnalyticalChemistry, 25240 Erzurum/TURKEY.

how to cite: Demirkaya-Miloglu F, Oznuluer T, Ozdurak B, Miloglu E. Design and Optimization of a New Voltammetric Method for Determination of Isoniazid by Using PEDOT Modified Gold Electrode in Pharmaceuticls. Iran J Pharm Res. 2016;15(Suppl):e125107. https://doi.org/10.22037/ijpr.2016.1807.

Abstract

Isoniazid (INH) was studied with regard to its electrochemical treatment on a strongly alkaline solution of a poly (3,4-ethylenedioxythiophene)-modified gold electrode, using both cyclic voltammetric and controlled potential techniques. Electrocatalytic performance measurements of this composite electrode toward oxidation of INH exhibited an increase of 4-folds in oxidation peak densities compared to the bare gold electrode. Central composite design method was used to obtain optimum experimental conditions, and used critical parameters (pH (A), scan rate (mV/s, B) and temperature (C, C) to assess the effects on amperometric response. Optimum experimental conditions were achieved by using a pH of 9.2 with a scan rate of 260 mV/s and a temperature of 30 C. Under these circumstances, a good linear relationship was observed between peak current densities and INH concentration in the range of 0.05-2 μM, with correlation coefficient of 0.9998. Furthermore, the method was very sensitive (limit of quantitation, 0.0043 μM), accurate (relative error, -5.65 to 4.03) and precise (relative standard deviation %, ≤ 7.97). The method was also applied to determine INH in pharmaceutical formulations, and statistically compared the results with the official method using the two one-sided equivalence test; the results were in good agreement with those obtained by the official and reported methods.

Introduction

Infectious diseases are fatal enemies of the global population. Mycobacterium tuberculosis produces the bacterial disease tuberculosis (TB), which is usually transmitted from person-to-person by breathing infected air during close contact. In recent years, the number of individuals suffering from TB has been on the increase, largely due to HIV infection, immigration, increased trade, and globalization (1, 2). However, although TB is found in every country of the world, in 2012, the largest number of new cases occurred in Asia, accounting for 60% of new cases globally. Isoniazid (pyridine-4-carboxilic acid hydrazide or isonicotinic acid hydrazide; INH) is one of the most commonly used drugs for the treatment of TB, because it is highly active against Mycobacterium strains and inexpensive, and is associated with insignificant side effects (3). INH may be applied to treat latent tuberculosis, to prevent the TB infection from becoming active, and active TB is usually treated with a great success , along with INH in combination with one or more of several other agents, including rifampin, ethambutol, pyrazinamide, and streptomycin (2, 4). Pharmaceutical active substance analysis is necessary in drug quality control, as well as being a useful tool in therapeutic drug monitoring during TB treatment (5).

A survey of the literature reveals that several analytical methods, such as high-performance liquid chromatography (6-12), gas chromatography (13), UV (13-19), and derivative spectrophotometry methods (20) have been used in the analysis of INH in pharmaceuticals. However, these methods have some disadvantages, in that they use high-cost materials, and have complex experimental protocols, and require sample pretreatment, and are largely time-consuming.

In addition, electrochemical methods, such as potentiometry [21, 22], polarography(23 ) differential-pulse polarography (24,25) , amperometry(3, 26, 27), chronoamperometry (28), differential pulse voltammetry(29), cyclic voltammetry (CV)( 30, 31), and linear sweep voltammetry (5) have also been successfully used in INH analysis. Good sensitivity, precision and accuracy, simplicity, and rapidity are accepted as being the advantages of the electroanalytical techniques. In contrast, their disadvantages are that they require previous accumulation steps, and preclude obtaining a high sampling frequency. To eliminate these problems, researchers should use many different types of polymeric film-modified electrodes, due to their characteristics of good electrocatalysis and stability. Preparation of polymer-modified electrodes provided as electropolymerization have attracted widespread attention in determining various analytes, due to their selectivity, sensitivity, and homogeneity in electrochemical deposition, their strong adherence to the surface of the electrode, and the chemical stability of the films (32). Electrodes chemically modified by polyaniline, polythiophene, or polypyrrole have been used to detect electroactive materials (5). Among the various types of conducting polymers, poly (3,4-ethylenedioxythiophene; PEDOT), which has the advantage of easy electrodeposition onto surface by electrooxidation of its monomer, and such attractive properties as high conductivity (up to 400-600 S/cm), high transparency, and high environmental stability, is one of the most preferred ones (32, 33).

In the same manner, various electrodes based on chemical modifications together with direct detection of INH with bare metallic electrodes (21-25, 29, 31) have been improved to address the aforementioned problems. In these studies, voltammetric behavior of INH was assessed in various media; PEDOT/Pt (5), screen-printed carbon electrode modified with silver hexacyanoferrates (26), mesoporous carbon-modified electrode (27), Fe(tmphen)32+ exchanged Nafion®-modified electrode (30), over oxidized polypyrrole glassy carbon-modified electrode (34), polyamidosulfonic acid glassy carbon-modified electrode (35) in pharmaceuticals. However, to our knowledge, there is no existing studies on electrochemical oxidation and amperometric determination of INH using a PEDOT-modified gold (Au) electrode in pharmaceutical preparations.

There are three main objectives of the present study. The first was to investigate the performance of PEDOT-modified Au electrodes for the electrochemical oxidation of INH in an alkaline solution; the second was to optimize the experimental conditions by applying a response surface methodology, based on central composite design (CDD), which possesses the property of saving time and effort by estimating the optimum conditions with the lowest number of experiments; and the third and last aim was to demonstrate the applicability of the optimized and validated voltammetric method for the determination of INH content in simple and combined pharmaceutical formulations.

Experimental

Apparatus

Electrochemical polymerization and characterization were carried out in a single-compartment, three-electrode Teflon cell, using a BAS 100 W electrochemical analyzer. In all cases, an Ag/AgCl/3M NaCl electrode served as the reference electrode, and a platinum wire was used as the counter electrode. Single crystalline Au(111) electrodes were used as working electrodes during the electrochemical oxidation of INH, and pH measurements were carried out with a laboratory pH-meter. All experiments were conducted at room temperature.

Materials and reagents

All materials and reagents used in the proposed method were of analytical or pharmaceutical grade. 3,4-Ethylenedioxythiophene, INH, lithium per chlorate (LiClO4), potassium dihydrogen phosphate (NaH2PO4), NaCl, and acetonitrile were purchased from Sigma-Aldrich (Germany), and obtained ultrapure water using a Milli-Q water purification system (Barnstead, EASYpure RF, US). All other chemicals and solvents were analytical-grade and bought from commercial sources. INH tablets (Isovit® (100 mg) and INH® (300 mg) were bought from the Turkish drug market, and highly purified nitrogen were used for de-aeration.

Stock and reagent solutions

A stock solution of INH were prepared with phosphate buffer solution (pH 9.2) at a concentration of 1 mM and stored this at 4 C. Several phosphate buffer solutions (pH: 7-11) were arranged from 0.1 M NaH2PO4 or 0.1 M H3PO4 and adjusted these by 0.1 M NaOH, in order to reach the concentration and pH values established by the experimental design, and prepared calibration working solutions (0.05, 0.1, 0.25, 0.5, 0.75, 1, 1.5, and 2 µM) and quality control solutions (0.1, 0.75 and 1.5 µM) on a daily basis, by diluting the stock solution with phosphate buffer solution (0.1M, pH 9.2).

Preparation of PEDOT modified Au-electrode

The elecotrochemical polymerization of the PEDOT was provided as a cyclic voltammetric method in non-aqueous solution, including 0.1 M LiClO4 in acetonitrile, in accordance with the study conducted by Kumar et a. (36). In all cases, the reference electrode was an Ag/AgCl/3M NaCl, and the counter electrode was a platinum wire. Single-crystal Au(111) was prepared in accordance with the method proposed by Demir et al. (37). To obtain (111) facets, the gold electrode (Johnson Matthey, 99.999%) was flamed for 20 s, and, after a short cooling time in air, quenched the electrode in Milli-Q water. The same procedure was repeated at least five times. The produced single crystalline Au(111) electrodes was used as working electrodes during the electrochemical oxidation of INH, and synthesized the polymer by cycling the electrode potential in the range of 0 V and 1.6 mV. The scanning potential rate was 100 mV/s. The modified electrode was rinsed with acetonitrile and distilled water, in order to remove any physically adsorbed monomer that may have remained. Finally, this modified electrode is here after referred to as Au-PEDOT.

Preparation of pharmaceutical formulation

10 tablets for each formulation were accurately weighed and finely powdered, and then added the amount from one tablet to a flask, along with 40 mL phosphate buffer solution (0.1M, pH 9.2). The solution was sonicated for 15 minutes, cooled down to room temperature, and increased the volume to 50 mL. The desired concentrations for measurements were achieved by diluting this stock solution with 0.1 M phosphate buffer solution (pH 9.2).

Software

The experimental design and statistical analysis were calculated by using the Microsoft Excel 2010, SPSS 11.5 software program (SPSS, Chicago, IL, USA), and Design-Expert 8.0 (Stat-Ease Inc., Minneapolis, MN, USA).

Results

Electrochemical behavior of INH on PEDOT modified Au-electrode

Cyclic voltammetric curves (CVs) data were obtained on bare gold electrode and PEDOT-modified gold electrode in phosphate buffer solution (pH: 9.2), containing 1 µM INH, as shown in 
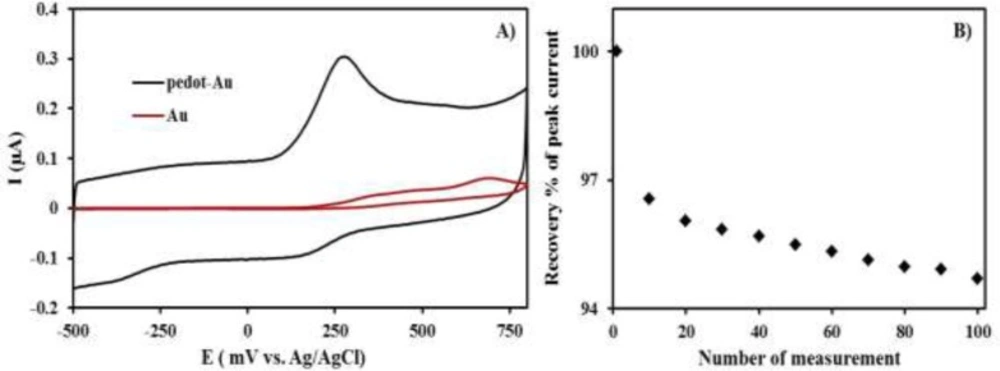
Figure 1. A single oxidation peak was recorded at 0.25 V, in accordance with the CV of INH, in this solution (curve blue). A relatively similar curve was received for the bare gold electrode, in terms of CV in the same solution (curve red), except that the CV had a smaller current and higher INH oxidation potential. As seen in Figure 1A, there is a significant difference in terms of intensity of the peak current densities, and that of the PEDOT-Au electrode was approximately 4-folds higher than that of the bare Au. The higher peak current densities for the PEDOT/Au electrode lead to more favorable oxidation of INH than of the bare Au electrode. Thus, the higher peak currents for INH oxidation on the PEDOT/Au electrode could be more advantageous, because of its property of higher effective surface areas, improved mass transport, and higher catalytic effect due to electronic properties, compared to the other conductive.

A) CVs of bare gold electrode and PEDOT modified gold electrode in an aqueous solution (pH: 9.2) containing 1 µM INH, B) The curve of the stability data for the PEDOT modified Au-electrode

Response stability and reproducibility of the PEDOT modified Au-electrode

Response stability of PEDOT/Au electrode was evaluated by measuring the anodic peak current response at a fixed 1 µM in phosphate buffer solution (pH: 9.2) at the identical surface of PEDOT/Au electrode without renewal for 20, 50 and 100 times in a day. 97%, 96%, and 95% of the initial amperometric response (the mean peak current for 1 µM INH was 0.31 in Figure 1A) was obtained as can be seen in, Figure 1B, respectively, indicating PEDOT/Au has shown good stability under continuous use. In addition to this, renewed surface of PEDOT/Au electrode in phosphate buffer solution (pH: 9.2) was evaluated in terms of its reproducibility. The average peak current for 1 µM isoniazid was 0.307 0.005 (n=6). This data definitely showed that this modified electrode has a remarkable reproducibility. However, PEDOT/Au electrode was prepared only one time. Despite of its high reproducibility, this electrode was used during the whole analysis due to its response stability.

Optimization of Experimental Parameters by Central Composite Design (CCD)

A CCD was performed to optimize and determine of the interaction between selected factors the operating parameters for determining INH levels in pharmaceuticals. Scan rate (mV/s, B), pH (A) and temperature (C, C) are the three significant selected factors necessary to carry out CCD. In order to make a decision regarding the significance of these three parameters, preliminary experiments and knowledge obtained from previous studies were utilized. The range of the three factors were determined as follows: pH (7-11), scan rate (100-300 mV/s), and temperature (30-60 C). The response variable of the CCD was accepted as being the peak current densities of INH. The CCD method was carried out by using eight factorial and six axial runs, and, in addition to these measurements, the model was maintained in six axial runs at center points. In order to carry out rotatability, 1.689 (α = (23)1/4 ∼1.689) value was selected to be the α value of the CCD.

The experimental conditions for CCD and the results of peak current densities are summarized in 
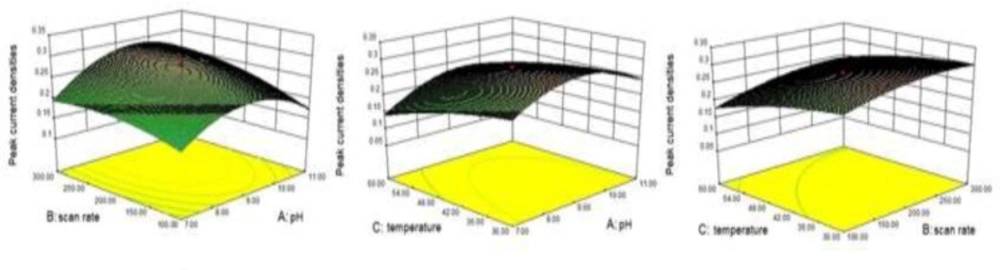
Table 1. Three-dimensional graph were plotted, which is called as response surface, for the experimental results of the obtained peak current densities from CCD

Surface plot for INH peak current densities A) Effect of A and B and their reciprocal interaction B) Effect of A and C and their reciprocal interaction C) Effect of B and C and their reciprocal interaction

(Figure 2), and fitted the experimental data to the response surface in order to obtain the optimum conditions. The following equation was improved for the quadratic regression model in coded terms:

Y = 0.28+ 0.017A +0.027 B -0.035 C+0.014 AB+0.011 AC+0.00625BC- 0.061 A2 - 0.018 B2- 0.013 C2

Table 1

The real values of optimization method parameters against peak current densities of INH defined as response for the central composite design

Experiment A: pHB: Scan Rate (mV/s)C: Temperature (C)IF: Peak Current densities
111.0 10030.00.18
29.03245.00.15
39.020045.00.27
49.036845.00.35
511.030060.00.19
67.030060.00.12
712.320045.00.20
87.010060.00.15
97.010030.00.21
109.020070.20.18
117.030030.00.2
125.620045.00.06
139.020019.80.35
1411.010060.00.12
15-209.020045.00.27-0.28

Where Y is the response factor corresponding to the peak current densities, and A, B, and C represent the three significant factors mentioned above. The p value was 0.0235, in accordance with the statistical parameters obtained from the analysis of variance for the model. This model could consider being significant, due to a p value of < 0.05, and it was claimed that pH and temperature significantly affected the peak current densities of INH. Maximum desirability was observed on the coordinates of a pH of 9.2, a scan rate of 260 mV/s, and a temperature of 30 C. To confirm the point prediction values, experiments (n = 10) were maintained to determine the response peak current densities values, using the conditions recommended by the model. The mean peak current density value of the results was 0.315 ± 0.037, indicated a fairly good agreement with the predicted results.

Validation and Quantitation

The proposed method was validated by evaluating the parameters of specificity, linearity, sensitivity, precision, accuracy, recovery, and stability, in accordance with International Conference on Harmonization Q2B guidance (38).

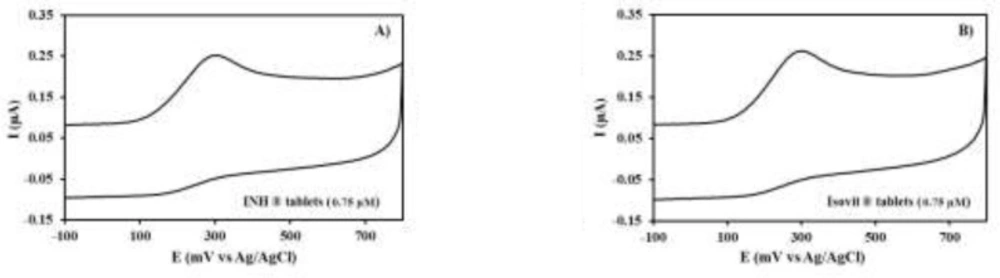
The specificity of the proposed method was clearly evidenced by the identical oxidation peak of INH in standard solution (Figure 3) and drug samples containing the excipients and vitamin B6 (Figure 4). The oxidation peaks of vitamin B6 and drug excipients were not identified at PEDOT/Au electrode under the described experimental conditions.

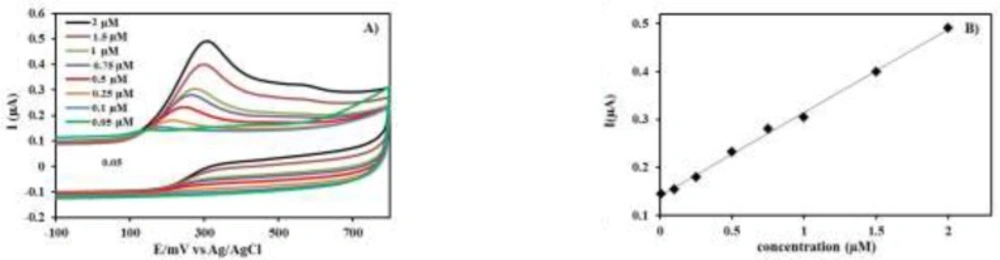
A) CVs as increasing concentration of INH (0.05-2 μM) in phosphate buffer solution (0.1M, pH 9.2) at PEDOT/Au electrode. B) Calibration curve for INH of different concentrations from (0.05-2 μM
CVs of drug solutions (0.75 µM) in phosphate buffer solution (0.1M, pH 9.2) at PEDOT/Au electrode. A) I.N.H tablets B) Isovit tablets

The linearity of method was shown by linear calibration curves obtained by plotting peak current densities of INH versus concentration of INH. Figure 3A exhibits the CVs recorded under increasing concentrations of INH (0.05, 0.1, 0.25, 0.5, 0.75, 1, 1.5, and 2 μM). The obtained calibration curves are also shown (Figure 3B). Linear regression analysis was used to evaluate the linearity, which was calculated by least-squares regression analysis. The average of six calculated linear regression equation was Y= 0.1727 C+ 0.1357. C is the concentration (μM) of INH, and Y is peak current densities of INH (μA). Furthermore, standard deviation of intercept (Sa) and slope (Sb) of regression lines from these six linear regression equations were calculated as 0.00074 and 0.0028, respectively. The correlation coefficient was 0.9998, which definitely represents a good linearity over the working concentration range.

The limit of detection (LOD) and the limit of quantitation (LOQ) were calculated as 3.3 /S and 10 /S, respectively, where σ is the standard deviation of the intercept of the regression line, and S is the slope of the regression line of the calibration curve. The LOD and LOQ were 0.014 μM and 0.043 μM, respectively. The LOD value is sufficient for INH analysis in the pharmaceutical preparations.

In order to assess the precision of the methods, the percent relative standard deviation (RSD %) and the accuracy of method relative error (RE) values were evaluated with intra-day and inter-day measurement at three different concentration levels of INH that are known to be quality control solutions (0.1, 0.75 and 1.5 µM). The RSD % values for intra-day and inter-day precision of proposed methods were ≤ 7.97 %, and the RE values for the intra-day and inter-day accuracy studies of method was between -5.65 and 4.03. These results are shown in Table 2.

Table 2

Precision and accuracy of INH obtained with the proposed method

Added(M)Intra-day
Inter-day
Found SDa(M)RERSD %Found SDa(M)RERSD %
0.10.104 ± 0.0054.035.470.099 ± 0.008-0.797.97
0.750.742 ± 0.020-0.982.720.707 ± 0.047-5.656.66
1.51.493 ± 0.018-0.441.181.517 ± 0.0491.193.23

Whether excipients and other active drug substance (Vitamin B6) interfered the analyte in the tablets or not was determined by recovery test which based on addition of known amounts of pure drug to pre-analyzed formulations of INH. Recovery study (R %) was carried out by spiking known quantities (0.1, 0.75, and 1.5 µM) of standard into the drug solutions, which were prepared from Isovit® and INH® tablets. The analytical recovery was calculated by the following formula:

R % = [Ct-Ce/Ca]x100

where Ct is the total concentration of INH in the added samples, Ce is the concentration of INH to be estimated in pharmaceutical tablets, and Ca is the concentration of standard INH added. The obtained results had good accuracy for reliable electro-analytical analysis of INH, with a mean recovery of 99.8 4.36 % for Isovit® tablets, and 99.1 3.27 % for INH® tablets.

Solution stability of standards and tablet samples were assessed at room temperature and 5C. For this, standards and tablet solutions at 0.1, 0.75 and 1.5 µM were analyzed initially and at different time intervals (6, 24 and 48 h). The standards and sample solutions were stable for at 24 hours at room temperature and at least 48 hours at 5 C.

The developed voltammetric method was applied to analyze the commercially available formulations of Isovit® and INH® tablets (Figure 4). To evaluate the amount of INH present, the samples were analyzed 10 times after preparing the drug as mentioned previously, in the “Experimental Procedure” section. The INH content of pharmaceutical tablets were calculated on the basis of the standard calibration curve and the obtained results expressed as a percentage of drugs related to label claim was shown in Table 3. In addition this, these results were statistically compared with the official USP methods (17, 39), using the two one-sided equivalence test (TOST). The upper and lower acceptable limits for the difference in the amount of the active ingredient at each dosage have been predetermined as -3.0% to 3.0% (40). The critical t value for 18 degrees of freedom, with a set for the TOST at 0.05 was 1.734. The calculated confidence intervals for Isovit® and INH® tablets were -0.619 to 1.438, and -0.747 to 1.432, respectively. Therefore, it was concluded that the results obtained with the proposed method and the USP reference assay were equivalent.

Table 3

Determination of INH in commercial tablets using the proposed voltammetric method and comparison statistically with the Official U.S.P. methods (17, 39) results

DrugLabel claim (mg per tablet)Founda SD(mg)RecoverySD, (%)
Confidience Interval
Proposed MethodaOfficial U.S.P.Methods17,39LowerUpper
Isovit100100.2 ± 1.55100.2 ± 1.5599.82 ± 1.11-0.6191.438
I.N.H300300.5 ± 5.36100.2 ± 1.6899.82 ± 1.11-0.7471.432

Conclusions

In this study, it was observed that PEDOT-Au exhibited relatively higher current densities and a higher number of negative values for INH electrooxidation, compared to the bare Au electrode. In addition, good electrocatalytic activity, fast response toward INH oxidation, and a low detection limit of 0.0043 μM are the other advantages of the modified electrode. Enhancement in the catalytic effect of modified gold may produce the electronic property of PEDOT.

Three factors that have important roles in the peak current densities of INH (pH, scan rate, and temperature) were simultaneously optimized by using a response surface methodology based on the central composite design, which has the advantages as saving time, effort and using less chemicals in estimating the optimum conditions. The validation study supported the selection of the assay conditions by confirming that the method was specific, sensitive, accurate, and precise. In addition, this method does not involve complex procedural steps, and can be easily and directly applied to pharmaceuticals. The results obtained in the present study showed that the voltammetric method, performed by applying the described approach to select optimum conditions, might well be suitable to quantify the drug and to check formulation content uniformity in the pharmaceutical industry.

Acknowledgements

References

  • 1.

    Smith KC, Armitige L, Wanger A. A review of tuberculosis: reflections on the past, present and future of a global epidemic disease. Expert Rev. Anti-Infect. Ther. 2003;1:483-91. [PubMed ID: 15482144].

  • 2.

    World Health Organization. Global Tuberculosis Control Report. Geneva: World Health Organization; 2013. p. 1-292.

  • 3.

    Chen WC, Unnikrishnan B, Chen SM. Electrochemical oxidation and amperometric determination of isoniazid at functionalized multiwalled carbon nanotube modified electrode. Int. J. Electrochem. Sci. 2012;7:9138-49.

  • 4.

    Peloquin CA. Therapeutic drug monitoring in the treatment of tuberculosis. Drugs. 2002;62:2169-83. [PubMed ID: 12381217].

  • 5.

    Atta NF, Galal A, Ahmed RA. Voltammetric behavior and determination of isoniazid using PEDOT electrode in presence of surface active agents. Int. J. Electrochem. Sci. 2011;6:5097-113.

  • 6.

    Chellini PR, Lages EB, Nogueira FHA, Cesar IC, Pianetti GA. Development and validation of a HPLC method for simultaneous determination of rifampicin, isoniazid, pyrazinamide and ethambutol hydrochloride in a pharmaceutical formulation. 24th Symposium on Pharmaceutical and Biomedical Analysis – Recent Developments in Pharmaceutical Analysis. Bologna; 2013. p. 1-47.

  • 7.

    Dhal SK, Sharma R. Development and validation of RP-HPLC method for simultaneous determination of pyridoxine hydrochloride, isoniazid, pyrazinamide and rifampicin in pharmaceutical formulation. Chem. Anal. 2009;54:1487-500.

  • 8.

    Ayyappan J, Umapathi P, Quine SD. Development and validation of a stability indicating high-performance liquid chromatography (HPLC) method for the estimation of isoniazid and its related substances in fixed dose combination of isoniazid and ethambutol hydrochloride tablets. AJPP. 2011;5:1513-21.

  • 9.

    Calleri E, De Lorenzi E, Furlanetto S, Massolini G, Caccialanza G. Validation of a RP-LC method for the simultaneous determination of isoniazid, pyrazinamide and rifampicin in a pharmaceutical formulation. J. Pharm. Biomed. Anal. 2002;29:1089-96. [PubMed ID: 12110394].

  • 10.

    Glass BD, Agatonovic-Kustrin S, Chen YJ, Wisch MH. Optimization of a stability-indicating HPLC method for the simultaneous determination of rifampicin, isoniazid, and pyrazinamide in a fixed-dose combination using artificial neural networks. J. Chromatogr. Sci. 2007;45:38-44. [PubMed ID: 17254382].

  • 11.

    Khuhawar MY, Rind FMA. High performance liquid chromatographic determination of isoniazid, pyrazinamide and rifampicin in pharmaceutical preparations. Pak. J. Pharm. Sci. 1998;11:49-54. [PubMed ID: 16414818].

  • 12.

    Khuhawar MY, Rind FMA, Rajper AD. High-performance liquid chromatographic determination of isoniazid, pyrazinamide, and indomethacin in pharmaceutical preparations. ACTA Chromatographica. 2005;15:269-75.

  • 13.

    Khuhawar M, Zardari L. Capillary gas chromatographic determination of isoniazid in pharmaceutical preparations and blood by precolumn derivatization with trifluoroacetylacetone. J. Food Drug Anal. 2006;14:323-8.

  • 14.

    Benetton SA, Kedor-Hackmann ERM, Santoro MIRM, Borges VM. Visible spectrophotometric and first-derivative UV spectrophotometric determination of rifampicin and isoniazid in pharmaceutical preparations. Talanta. 1998;47:639-43. [PubMed ID: 18967366].

  • 15.

    Pawar PY, Lagad AV, Bahir SN, Rathi R. Simultaneous UV spectrophotometric method for estimation of isoniazid and pyridoxine in tablet dosage form. Der Pharma Chemica. 2012;4:749-54.

  • 16.

    Arifa Begum SK, Basava Raju D, Rama Rao N. Simultaneous estimation of rifampicin and isoniazid in combined dosage form by a simple UV spectrophotometric method. Der Pharmacia Lettre. 2013;5:419-26.

  • 17.

    Barsoum BN, Kamel MS, Diab MMA. Spectrophotometric determination of isoniazid and rifampicin from pharmaceutical preparations and biological fluids. Res. J. Agric. Biol. Sci. 2008;4:471-84.

  • 18.

    Kulkarni RM, Bilehal DC, Nandibewoor ST. Oxidation of isoniazid by quinolinium dichromate in an aqueous acid medium and kinetic determination of isoniazid in pure and pharmaceutical formulations. Anal. Sci. 2004;20:743-7. [PubMed ID: 15116980].

  • 19.

    Yalgudre RS, Gokavi GS. Mechanism of oxidation of the antituberculosis drug isoniazid by bromate in aqueous hydrochloric acid medium. Ind. Eng. Chem. Res. 2012;51:5135-40.

  • 20.

    Rote AR, Sharma AK. Simultaneous spectrophotometric determination of rifampicin, isoniazid and pyrazinamide by first–derivative UV spectrophotometry in combined pharmaceutical dosage forms. Indian J. Pharm. Sci. 1997;59:119-23.

  • 21.

    Magare BK, Farooqui MN, Ubale MB. Potentiometric study on complexes of some antibacterial drugs with Mg (II) and Ca (II) metal ions. Natl. Acad. Sci. Lett. 2008;31:353-5.

  • 22.

    Gajendiran M, Nazer MAK. Potentiometric Back Titration of Isoniazid in Pharmaceutical Dosage Forms Using Copper Based Mercury Film Electrode J. Kor. Chem. Soc. 2011;55:620-5.

  • 23.

    Garg A, Samota S, Singh M, Pandey R. Polarographic study of Cu (II)-Isoniazid complex at DME. Int. J. Chem. Tech. Res. 2011;3:70-4.

  • 24.

    Lomillo MMA, Renedo DO, Martínez MJA. Resolution of ternary mixtures of rifampicin, isoniazid and pyrazinamide by differential pulse polarography and partial least squares method. Anal. Chim. Acta. 2001;449:167-77.

  • 25.

    Asadpour-Zeynali K, Soheili-Azad P. Simultaneous polarographic determination of isoniazid and rifampicin by differential pulse polarography method and support vector regression. Electrochim. Acta. 2010;55:6570-6.

  • 26.

    De-Oliveira PR, Oliveira MM, Zarbin AJG, Junior LHM, Bergamini MF. Flow injection amperometric determination of isoniazid using a screen-printed carbon electrode modified with silver hexacyanoferrates nanoparticles. Sens. Actuators. B. Chem. 2012;171:795-802.

  • 27.

    Yan X, Bo X, Guo L. Electrochemical behaviors and determination of isoniazid at ordered mesoporous carbon modified electrode. Sens. Actuators. B. Chem. 2011;155:837-42.

  • 28.

    Karimi MA, Hatefi-Mehrjardi A, Mazloum-Ardakani M, Behjatmanesh-Ardakani R, Mashhadizadeh MH, Sargazi S. Study of electrocatalytic oxidation of isoniazid drug using Alizarin Red S as a mediator on the glassy carbon electrode. Int. J. Electrochem. Sci. 2010;5:1634-48.

  • 29.

    Xia HY, Hu XY. Determination of isoniazid using a gold electrode by differential pulse voltammetry. Anal. Lett. 2005;38:1405-14.

  • 30.

    Azad UP, Ganesan V. Efficient electrocatalytic oxidation and selective determination of isoniazid by Fe (tmphen) 32+-exchanged Nafion®-modified electrode. J. Solid State Electrochem. 2012;16:2907-11.

  • 31.

    Szlósarczyk M, Piech R, Bator BP, Maślanka A, Opoka W, Krzek J. Voltammetric determination of isoniazid using cyclic renewable mercury film silver based electrode. Pharmaceut. Anal. Acta. 2012;3:1-5.

  • 32.

    Nambiar SR, Aneesh PK, Rao TP. Ultrasensitive voltammetric determination of catechol at a gold atomic cluster/poly (3, 4-ethylenedioxythiophene) nanocomposite electrode. Analyst. 2013;138:5031-8. [PubMed ID: 23826610].

  • 33.

    Snook GA, Peng C, Fray DJ, Chen GZ. Achieving high electrode specific capacitance with materials of low mass specific capacitance: Potentiostatically grown thick micro-nanoporous PEDOT films. Electrochem. Commun. 2007;9:83-8.

  • 34.

    Majidi MR, Jouyban A, Asadpour-Zeynali K. Voltammetric behavior and determination of isoniazid in pharmaceuticals by using overoxidized polypyrrole glassy carbon modified electrode. J. Electroanal. Chem. 2006;589:32-7.

  • 35.

    Yang G, Wang C, Zhang R, Wang C, Qu Q, Hu X. Poly (amidosulfonic acid) modified glassy carbon electrode for determination of isoniazid in pharmaceuticals. Bioelectrochemistry. 2008;73:37-42. [PubMed ID: 18499535].

  • 36.

    Kumar SS, Mathiyarasu J, Phani KL, Jain YK, Yegnaraman V. Determination of Uric Acid in the Presence of Ascorbic Acid Using Poly (3, 4‐ethylenedioxythiophene)‐Modified Electrodes. Electroanalysis. 2005;17:2281-6.

  • 37.

    Demir U, Shannon C. A scanning tunneling microscopy study of electrochemically grown cadmium sulfide monolayers on Au (111). Langmuir. 1994;10:2794-9.

  • 38.

    Guideline, ICH Harmonized Tripartite, Q2B validation of analytical procedures: methodology. 62. Geneva; 1997.

  • 39.

    United States Pharmacopeoia. National Formulary (US-NF), The Official Compenia of Standards. 2007.

  • 40.

    Lung KR, Gorko MA, Llewelyn J, Wiggins N. Statistical method for the determination of equivalence of automated test procedures. J. Autom. Methods. Manag. Chem. 2005;25:123-7.