Electrochemistry of ISPT
The electrochemical behavior of the ISPT was characterized by cyclic voltammetry.
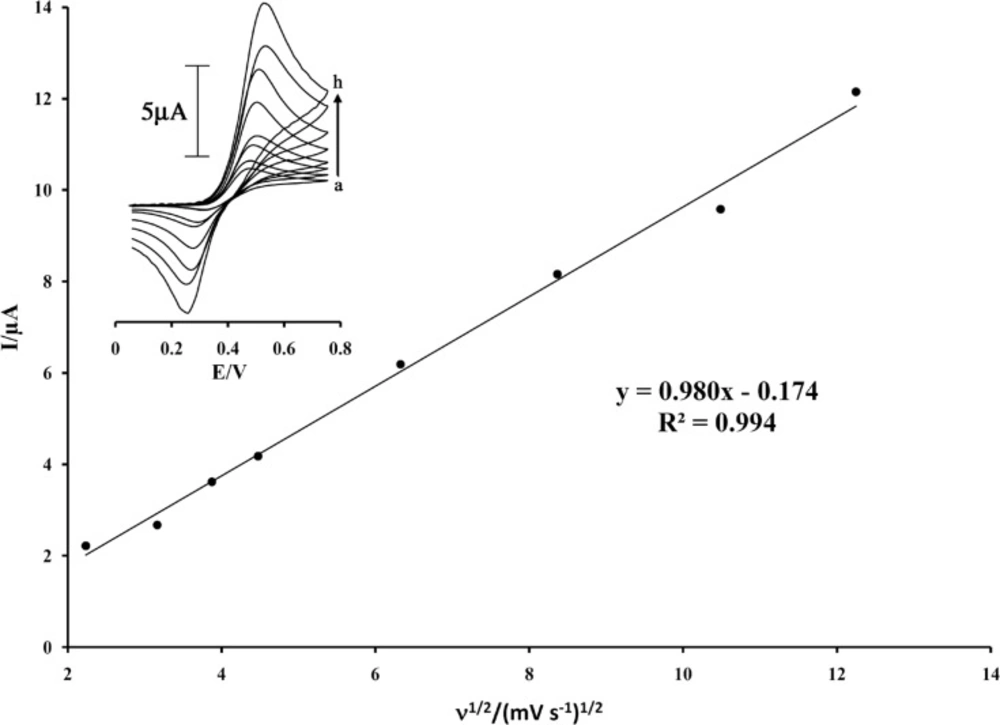
Figure 2 (inset) shows the cyclic voltammograms of ISPT at MWCNTPE in the PBS (pH 4.0) at various scan rates. The experimental results showed well defined and reproducible anodic and cathodic peaks related to ISPT
(red)/ ISPT
(ox) redox coupled with a quasi reversible behavior and with a peak separation potential of ΔE
p(E
pa−E
pc)=205 mV. These cyclic voltammograms were used to examine the variation of the peak currents vs. the square root of potential scan rates. The plot of the anodic peak current was linearly dependent on ν
1/2 with a correlation coefficient of 0.994 at all scan rates (
Figure 2).
Plot of Ipa versus ν1/2 for the oxidation of 200 µmol L-1 ISPT at a surface of MWCNTPE. Insert cyclic voltammograms of at various scan rates: (a) 5; (b) 10; (c) 15; (d) 20; (e) 40; (f) 70; (g) 110; and (h) 150 mV s–1 in 0.1 mol L-1 PBS (pH 4.0
The active surface areas of the modified electrodes are estimated according to the slope of the Ip vs. ν1/2 plot for a known concentration of K4Fe(CN)6, based on the Randles–Sevcik equation:
where Ipa refers to the anodic peak current, n the electron transfer number, A the surface area of the electrode, DR the diffusion coefficient, C0 the concentration of K4Fe(CN)6 and ν is the scan rate. For 1.0 mmol L−1 K4Fe(CN)6 in 0.10 mol L−1 KCl electrolyte with n=1 and DR = 7.6×10⁻⁶ cm2 s−1 and from the slope of the Ipa–ν1/2 relation, the microscopic areas were calculated. The active surface areas were equal to 0.09 and 0.18 cm2 for carbon paste electrode (CPE) and MWCNTPE, respectively. The result shows that the presences of MWCNTPE cause increasing the active surface of the electrode.
Catalytic effect
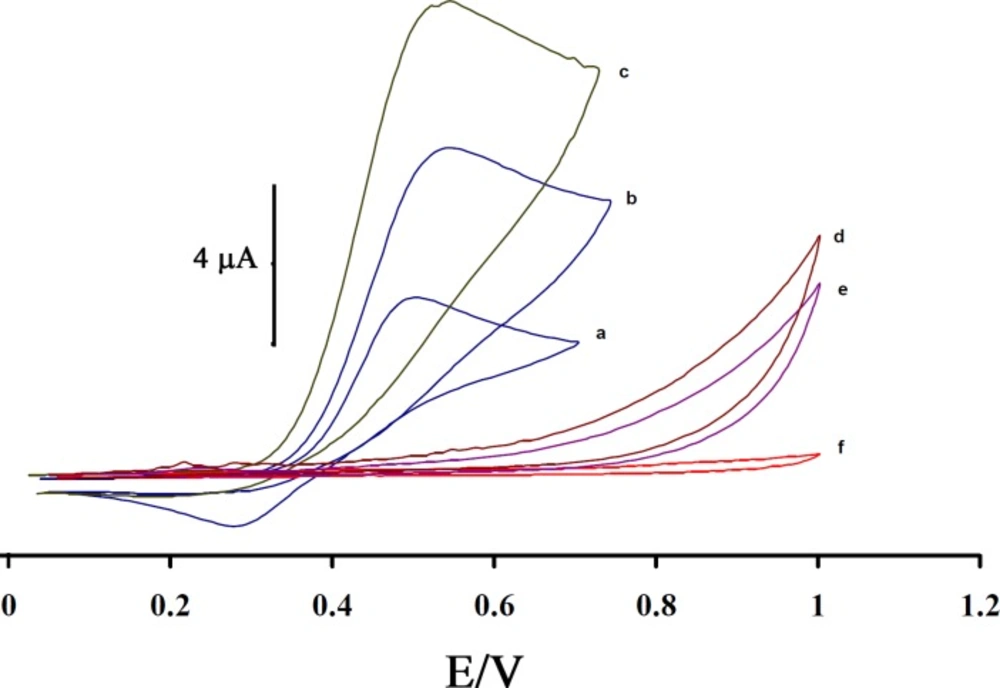
Figure 3 shows the electrocatalytic oxidation of CAP in the absence or presence of ISPT at a MWCNTPE surface. As is obvious, at the potential range studied (0.05–1.05 V), CAP was not electroactive in the absence of mediator at a surface of MWCNTPE and CPE (
Figure 3(e and f)), respectively. On the other hand, the anodic current of ISPT was increased substantially in the presence of low concentrations of CAP at a surface of MWCNTPE and CPE (
Figures 3(c) and 3b)), respectively. This observation is an evidence for electrocatalytic oxidation of CAP by ISPT. Similarly, when we compared the oxidation of CAP at the surface of MWCNTPE (curve c) and at CPE (curve b) in the presence of mediator, a dramatic enhancement was observed in the anodic peak current at MWCNTPE vs. the value obtained with CPE. In other words, the data obtained clearly show that the combination of MWNTs and the mediator definitely improve the characteristics of the electrode for the oxidation of CAP. The ISPT at a surface of MWCNTPE, in 0.1 mol L
-1 PBS (pH 4.0) and without CAP in solution, exhibited a well-behaved redox reaction (curve a). The process corresponds to an EC’ (catalytic) mechanism (see
scheme 1) (27-30), where the electrochemically formed ISPT
(Ox) reacts chemically with CAP diffused toward the electrode surface, while the simultaneous oxidation of the regenerated ISPT
(Red) causes an increase in the anodic current. For the same reason, the cathodic current of the modified electrode is smaller in the presence of CAP.
Cyclic voltammograms of (a) the 200 µmol L-1 ISPT at the surface of MWCNTPE in 0.1 mol L-1 PBS (pH 4.0); (b) 200 µmol L-1 ISPT +100 µmol L-1 CAP at the surface of carbon paste electrode; (c) 200 µmol L-1 ISPT +100 µmol L-1 CAP at the surface of MWCNTPE; (d) 100 µmol L-1 CAP at the surface of MWCNTPE; (e) 100 µmol L-1 CAP at the surface of carbon paste electrode, (f) For the buffer solution at the surface of unmodified electrode (carbon paste electrode); scan rate of 20 mV s-
Since CAP has a thiol moiety, we anticipated that the oxidation of CAP would be pH dependent. In order to ascertain this, the voltammetric response of CAP at a surface of MWCNTPE in the presence mediator was obtained in solutions with varying pH. Result shows that the maximum value of the peak current was appeared at pH 4.0, so this value was selected throughout the experiments (Not shown).
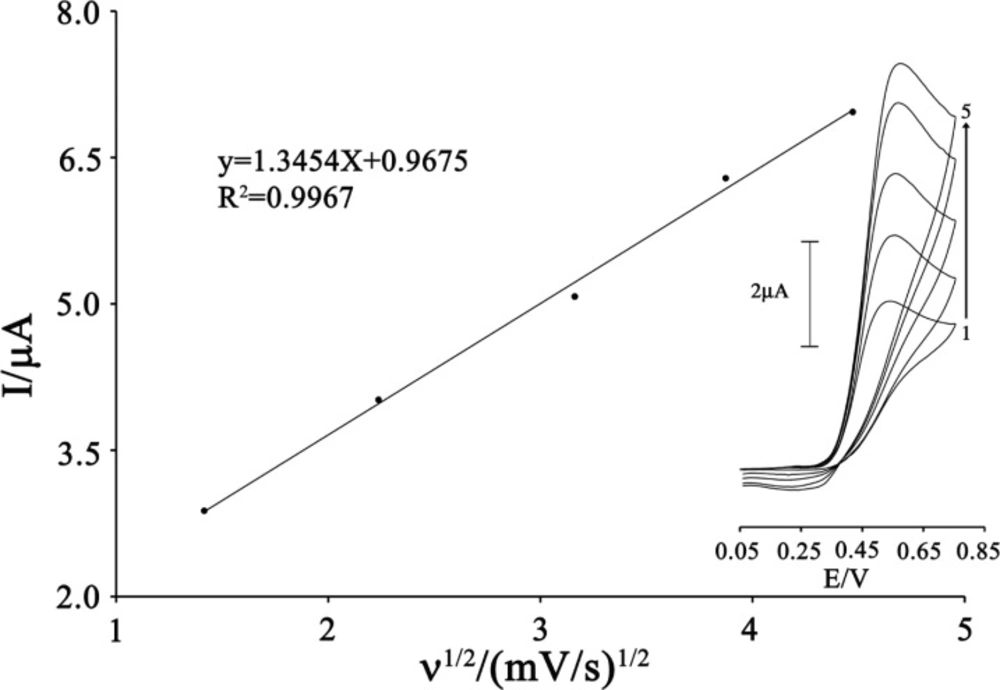
The effects of scan rate (υ) on the oxidation current of CAP were also examined (
Figure 4). The peak current increased linearly with the increasing the square root of scan rate that ranged from 2 to 20 mV s
–1 and it can be expressed as follows:
This result shows that the electrode process is controlled under the diffusion step.
Plot of Ipa versus ν1/2 for the oxidation of 80 µmol L-1 CAP in the presence 200 µmol L-1 ISPT at the surface of MWCNTPE. Inset) Cyclic voltammograms of 80 µmol L-1 CAP in the presence 200 µmol L-1 ISPT at various scan rates as (a) 2, (b) 5, (c) 10; (d) 15 and e) 20 mV s−1 in 0.1 mol L-1 buffer solution (pH 4.0
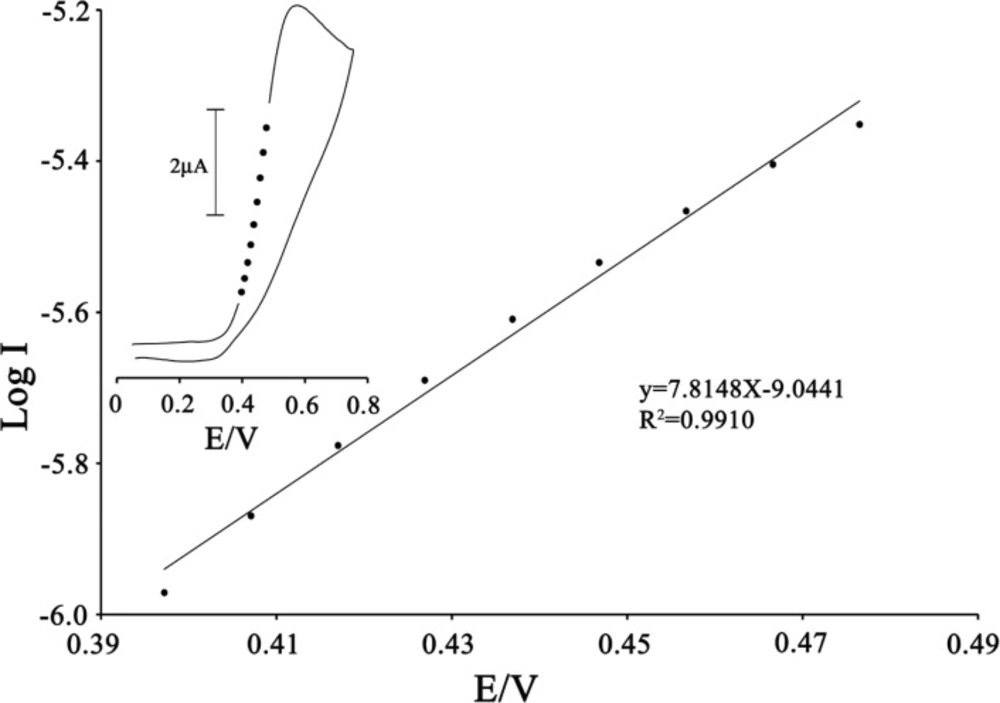
To obtain information about the rate-determining step, the Tafel plot was drawn, as derived from points in the Tafel region of the cyclic voltammogram (
Figure 5).
The slope of the Tafel plot was equal to n (1−α) F/2.3RT, which came up to 7.8148 V-1 decade. Therefore, we obtained the value of α equal to 0.54.
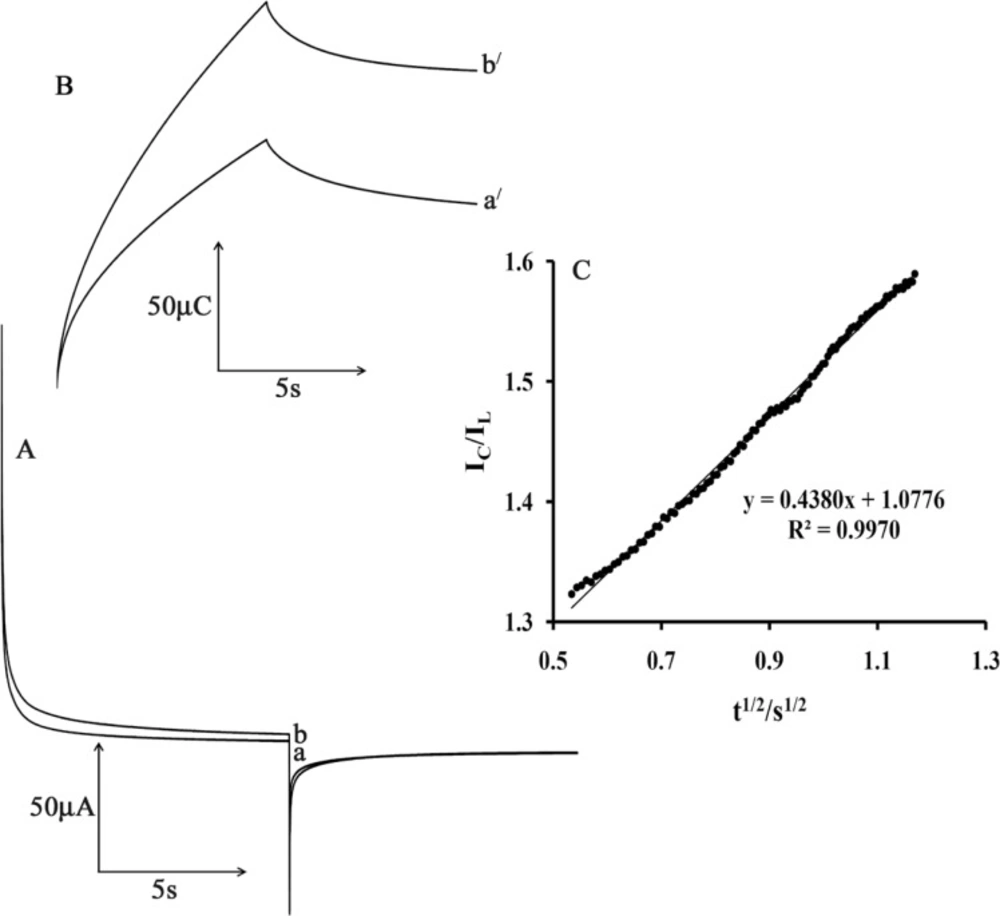
Figure 6A shows the current–time curves of MWCNTPE in the presence of mediator by setting the electrode potential at 0.2 mV (first step) and 70 mV (second step) for different CAP concentrations. As can be seen, there is no net anodic current corresponding to the oxidation of the mediator in the presence of CAP.
Tafel plot 200 µmol L-1 ISPT at the surface of MWCNTPE in 0.1 mol L-1 PBS (pH 4.0) at a scan rate of 20 mV s−1 in the presence of 100 µmol L-1 CAP
On the other hand, the forward and backward potential step chronoamperometry for the mediator in the absence of CAP shows symmetrical chronoamperogram with an equal charge consumed for the reduction and oxidation of the mediator at the surface of MWCNTPE (
Figure 6B, a
/). On the other hand, the charge value associated with forward chronoamperometry in the presence of CAP is significantly greater than that observed for backward chronoamperometry (
Figure 6B, b
/).
The rate constant for the chemical reaction between ISPT and CAP (kh) is determined according to the method of Galus (31)
where I
C is the catalytic current of ISPT in the presence of CA and I
L is the limiting current in the absence of CA. From the slope of I
C/I
L versus t
1/2 for five different concentrations of CAP, the average value of k
h was calculated to be 3.01 × 10
3 M
−1 sec
−1 (
Figure 6C). This value of rate constant explains the sharp catalytic peak observed for the oxidation of CAP at the surface of MWCNTPE in the presence of mediator.
A) Chronoamperograms obtained at the MWCNTPE in the absence a) and in the presence of b) 200 µmol L-1 CAP in a buffer solution (pH 4.0). B) The charge-time curves a') for curve (a); and b') for curve (b). C) Dependence of Ic/IL on the t1/2 derived from the chronoamperogram data
Dynamic range and limit of detection
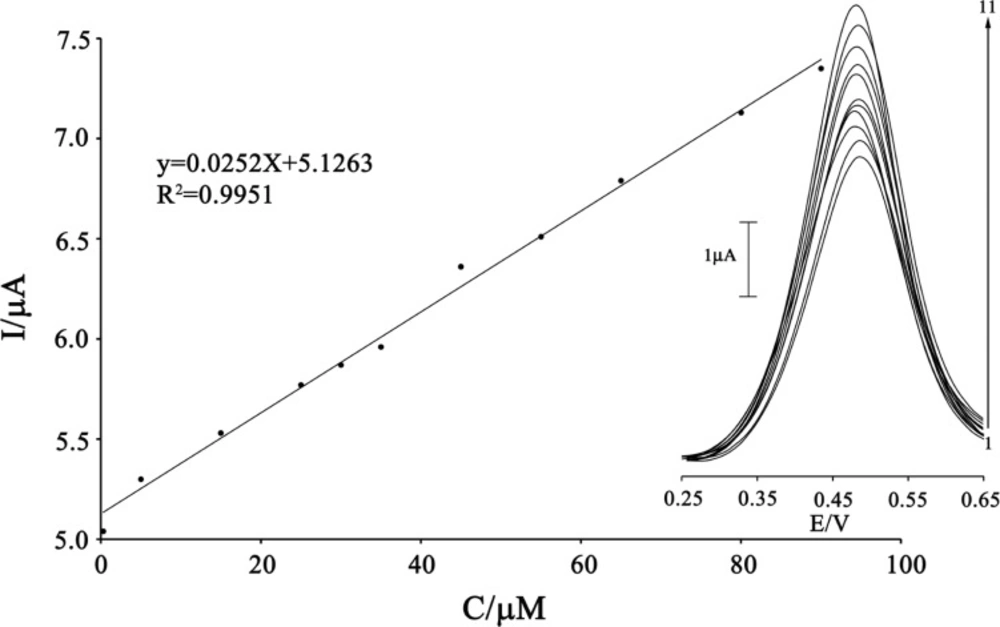
Square wave voltammetry (with amplitude potential of 50 mV and frequency of 12 Hz) was used to determine the concentration of CAP because SWV, had a much higher current sensitivity and better resolution than cyclic voltammetry, which was used to estimate the lower limit of detection of CAP (
Figure 7). Responses were linear with CAP concentrations ranging from 0.3-90 µM and a current sensitivity of 0.0252 µA/(µmol/L). The detection limit was determined at 0.1 µM CAP according to the definition of Y
LOD=Y
B+3σ.
The plots of the electrocatalytic peak current as a function of CAP concentration. Inset shows the SWVs of MWCNTPE in the presence 200 µmol L-1 ISPT (pH 4.0) containing different concentrations of CAP. From inner to outer (1–11) correspond to 0.3, 0.5, 15.0, 25.0, 30.0, 35.0, 45.0, 55.0, 65.0, 80.0, and 90.0 μmol L−1 of CAP
Interference study
In order to evaluate the selectivity of the proposed sensor for the determination of CAP, the influence of various foreign species on the determination of 5.0 µmol L-1 CAP was investigated. The tolerance limit was taken as the maximum concentration of the foreign substances, which caused an approximately ±5% relative error in the determination.
The results after the experiments revealed that neither 950–fold of K+, Li+, Mg2+, Br-, NO3–, ClO4–, SO42–,F–, glucose, sucrose, lactose, fructose, glycine, urea, histidine, SCN–, methionine, alanine, and phenylalanine; nor 700–fold of tryptophan, urea, thiourea, ampicillin and tyrosine; nor 300–fold of uric acid, ascorbic acid, aspirin, hydrochlorothiazide, atenolo, amoxicillin (after addition of 1 mM ascorbic oxidaze) and nor saturation of starch solution affected the selectivity. Also, nor 2–fold glutathione and N-actylcusteine affected the selectivity. Those results confirm the suitable selectivity of the proposed sensor for CAP determination.
Determination of CA in real samples
Electrochemical methods have a good sensitivity and selectivity for determination of pharmaceutical and biological sample analysis in real samples.
33-40 In order to evaluate the applicability of the proposed sensor for the determination of CAP in real samples; we have examined the ability of the electrochemical sensor for the determination of CAP in tablet and urine samples using standard addition method. The samples were also analyzed by a standard method including potentiometric titration with potassium iodate.
32 The results for the tablet sample analysis are given in
Table 2| Sample | Captopril added(µmol L−1) | Expected value(µmol L−1) | Captopril founded(µmol L−1) | Standard Method(µmol L−1) |
|---|
| Tablet a | −− | 10.0 | 10.33±0.35 | 10.55±0.65 |
| 10.0 | 20.0 | 19.88±0.45 | 20.45±0.69 |
| 20.0 | 40.0 | 39.75±0.88 | 39.84±0.75 |
| Tablet b | −− | 55.0 | 55.45±0.55 | 54.92±0.69 |
| 5.0 | 60.0 | 59.65±0.75 | 60.78±1.01 |
| 10.0 | 70.0 | 70.84±0.95 | 70.95±1.11 |
[object Object]
[object Object]
In addition, the results obtained for the urine samples by the proposed method were compared with the standard method statistically, using Student’s t test (for the accuracy), and variance ratio, F test (for the precision) at 95% confidence level. The results are given in Tables 3. Those results demonstrated the ability of propose sensor for voltammetric determination of CAP in real samples with the good recoveries of the spiked CAP and good reproducibility.
| Sample | Proposed method (µmol L−1) | Standard method (µmol L−1) | Fex | Ftab | tex | ttab(95%) |
|---|
| Urinea | 4.14±0.25 | 4.51±0.65 | 7.5 | 19 | 2.1 | 3.8 |
| Urineb | 5.25±0.33 | 5.62±0.82 | 8.5 | 19 | 2.6 | 3.8 |
| Urinec | 7.35±0.75 | 6.95±0.85 | 8.7 | 19 | 3.8 | 3.8 |
| Urined | 4.55±0.37 | 4.865±0.55 | 6.1 | 19 | 2.4 | 3.8 |
[object Object]
[object Object]
[object Object]
[object Object]
Stability and reproducibility
The repeatability and stability of the MWCNTPE was investigated using square wave voltammetric measurements of 20.0 µmol L-1 CAP in the presence of mediator. The relative standard deviation (RSD%) for seven successive assays of CAP was 2.1%. When using six different electrodes, the RSD% for seven measurements of 20.0 µmol L-1 CAP was 2.9%. When the modified electrode stored in the laboratory, the response of the modified electrode retained 97% of its initial response value after two week and 92% after 35 days. These results indicate that MWCNTPE has good stability and reproducibility.