Collection of Seaweeds
The four studied seaweeds were collected from the rocky bay of Abu Qir, Alexandria, Egypt in July 2008. They were washed thoroughly with tap water, dried in room temperature and pulverized in a blender. Identification of the seaweeds was carried out according to Aleem (
7).
Extraction of the crude seaweed polysaccharides
The seaweed powder was boiled in distilled water (1:5 w/v) at 100 °C for 2 h using a reflux condenser under reduced pressure. The hot extract was filtered with a nylon mesh bag (pore size 24 μM) and sequentially filtered with 0.45 μM Millipore filters, then subjected to freeze-drying (
8). Identification of phycocolloids extracted from seaweed samples was carried out by the first author with others using Vibrational Spectroscopy Fourier transform infra-red with attenuated total reflectance (FTIR-ATR) (
9).
Cell culture
In the last few years, a number of cell culture systems have been developed that support reliable and efficient progression of HCV virus. Several human hepatocyte cell lines were analyzed. The hepatocellular carcinoma HepG2 cell line was found to be one of the most susceptible cell to HCV infection (
10).
HepG2 cells were washed twice with RPMI1640 media supplemented with 200μM L-glutamine and 25μM HEPES buffer; N-[2-hydroxyethyl] piperazine-N`- [2-ethanesulphonic acid] (all chemicals and media, Cambrex). The cells were suspended at 2×10 5 cells/ mL in RPMI culture media (RPMI supplemented media, 10% fetal bovine serum (FBS); Gibco-BRL). The cells were left to adhere on the polystyrene 6 well plates for 4 h in an incubator (37 °C, 5% CO2, 95% humidity). The cells were washed twice from debris and dead cells by using RPMI supplemented media.
Human blood lymphocytes separation
Peripheral blood cells (PBMCs) were isolated, as reported by Lohr
et al. (
11). Briefly, peripheral blood samples were diluted with 5 volumes of a freshly prepared RBC lysis buffer (38.8 mmol/L NH
4Cl, 2.5 mmol/L K
2HCO
3, 1 mmol/L EDTA, pH 8.0), incubated at room temperature for 10 min and centrifuged at 1500 rpm for 5 min. The nucleated cells were precipitated in the bottom of the tube.
Cytotoxicity assays
Using the human separated PBMCs and HepG2, cytotoxicity was evaluated by incubating cellular suspensions (2.5 × 10
5 cells/mL, and 10
5 cells/mL, respectively) in 24-well microliter plates and cultured for 48 h at 37 °C, 5% CO
2. The culture was then refreshed with new RPMI-1640 supplemented medium containing serial dilutions of seaweed extracts (concentration from 2 to 20 mg/mL, 4 wells per concentration) and incubated for 90 min and washed three times with 1 mL of PBS buffer. Cytotoxicity by cell viability was measured using the neutral red dye method from Le Contel
et al. (
12). The stain intensity was assayed using the automated ELISA microplate reader adjusted at 540 nm (reference filters 620 nm). The cytotoxicity percentage values = [(OD) C − (OD)T/(OD)C] × 100. (OD)C and (OD)T, where the OD values are of the untreated and treated cells, respectively (
13).
First approach of the antiviral activity mode of seaweed polysaccharide extracts on HCV
The inhibitory effect of the applied seaweed extracts on HCV was recorded on semi-confluent monolayers of human PBMCs (2.5×10⁵ cells/mL) and HepG2 (105 cells/mL) infected with HCV (8.3×10⁶ copies/mL, genotype 4a), under different assays.
In assay 1 (pre-treated or neutralization assay) the seaweed extracts of the nontoxic concentrations in 50 mL of RPMI-1640 supplemented medium were put in contact with the virus (infected serum) for 1 h at 4 ºC. Then, the host cells (PBMCs: 2.5×10⁵ cells/mL, or HepG2: 105 cells/mL) were infected with the treated virus and incubated for 90 min at 37 °C, 5% CO2. The cells were washed three times with 1 mL of PBS and further cultured for 7 days at 37 °C, 5% CO2, followed by total RNA extraction.
In assay II (Co-treated), the seaweed extracts of the nontoxic concentrations in 50 mL of RPMI-1640 supplemented medium were added simultaneously with the virus (infected serum) to the host cells (PBMCs: 2.5×10⁵ cells/mL, or HepG2: 105 cells/mL), and after 90 min of incubation, infected cells were washed three times with 1 mL of PBS and further cultured for 7 days at 37 °C, 5% CO2, followed by total RNA extraction.
In assay III (Post-treated), the infected serum (8.3×10⁶ copies/mL, genotype 4a), were added to the host cells and incubated for 90 min at 37 °C, 5% CO2.
The cells were washed three times with PBS. The seaweed extracts of the nontoxic concentrations in 50 mL of RPMI-1640 supplemented medium were added and cultured for 7 days at 37 °C, 5% CO2, followed by total RNA extraction.
RNA extraction from PBMCs and HepG2 cells
RNA was isolated from the PBMCs and HepG2 cells as described by Lohr
et al. (
11). Briefly, the cells were precipitated and washed in the same buffer to remove adherent viral particles before lysis in 4 mol/L guanidinium isothiocyanate containing 25 mmol/L sodium citrate, 0.5% sarcosyl and 0.1 mol/L-mercaptoethanol and 100 μL sodium acetate. The lysed cells were centrifuged at 12000 rpm for 10 min at 4 ºC. The aqueous layer was collected and mixed with an equal volume of isopropanol. After incubation at 20 ºC overnight, RNA was precipitated by centrifugation at 12000 rpm for 30 min at 4 ºC and the precipitate RNA was washed twice with 70% ethanol.
PCR and real time PCR of genomic and anti-genomic RNA strands of HCV
Reverse transcription-nested PCR was carried out according to Lohr et al. (
11), with some modifications. Retrotranscription was performed in 25 μL reaction mixture containing 20 U of AMV reverse transcriptase (Clontech, USA) with either 400 ng of total HepG2 or PBMCs cells RNA, 40 U of RNAsin (Clontech, USA), a final concentration of 0.2 mmol/L from each dNTP (Promega, Madison, WI, USA) and 50 pmol of the reverse primer 1CH (for plus strand) or 50 pmol of the forward primer 2CH (for minus strand). The reaction was incubated at 42 ºC for 60 min and denatured at 98 ºC for 10 min. Amplification of the highly conserved 5′-UTR sequences was done using two roundsPCR with two pairs of nested primers. First round amplification was done in 50 μL reaction mixture, containing 50 pmol from each of 2CH forward primer and P2 reverse primer, 0.2 mmol/L from each dNTP, 10 μL from RT reaction mixture as template and 2 U of Taq DNA polymerase (Promega, USA) in a 1× buffer supplied with the enzyme. The thermal cycling protocol was as follows: 1 min at 94 ºC, 1 min at 55 ºC and 1 min at 72 ºC for 30 cycles. The second round amplification was done similar to the first one, except for use of the nested reverse primer D2 and forward primer F2 at 50 pmol each. A fragment of 174 bp was identified in the positive samples. Primer sequences were as follows: 1CH: 5′-ggtgcacggtctacgagacctc-3′, 2CH: 5′-aactactgtcttcacgcagaa-3′, P2: 5′- tgctcatggtgcacggtcta-3′, D2: 5′-actcggctagcagtctcgcg- 3′ and F2: 5′-gtgcagcctccaggaccc-3′. To control false detection of negative-strand HCV RNA and known variations in PCR efficiency, specific control assays and rigorous standardization of the reaction were employed: (1) cDNA synthesis without RNA templates to exclude product contamination; (2) cDNA synthesis without RTase to exclude Taq polymerase RTase activity; (3) cDNAsynthesis and PCR step done with only the reverse or forward primer to confirm no contamination from mixed primers. These controls were consistently negative. In addition, cDNA synthesis was carried out using only one primer present followed by heat inactivation of RTase activity at 95 ºC for 1 h, in an attempt to diminish false detection of negative-strand prior to the addition of the second primer. Finally, the RT-PCR was done to the final PCR product based on the SYBR Green I dye and LightCycler fluorimeter. Amplicon synthesis was monitored continuously by SYBR Green I dye binding to double stranded DNA during PCR of the 5′ HCV non-coding (NC) region. Specificity was verified by amplicon melting temperatures. An external standard curve was constructed with serial 10 fold dilutions of a modified synthetic HCV 5′ NC RNA (
14).
Strand-Specific RT-qPCR
The real time quantitative (RTq) PCR was done to the final PCR product based on the SYBR Green I dye and Light Cycler fluorimeter using a standard HCV infected serum samples. Amplicon synthesis was monitored continuously by SYBR Green I dye binding to double stranded DNA during PCR of the 5′ HCV non-coding (NC) region. Specificity was verified by amplicon melting temperatures. An external standard curve was constructed with serial 10 fold dilutions of a modified synthetic HCV 5′ NC RNA (
15), The RT-qPCR step was followed by first round PCR using the 2CH and P2 primers in 50 µL reaction containing 20 µL cDNA, 50 pmol from each of 2CH forward primer and P2 reverse primer and 12.5 µL master mix SYBR Green, The thermal cycling protocol was as follows: 30 cycles of 1 min each at 94, 55 and 72 ºC, with the final extension done at 72 ºC for 5 min.
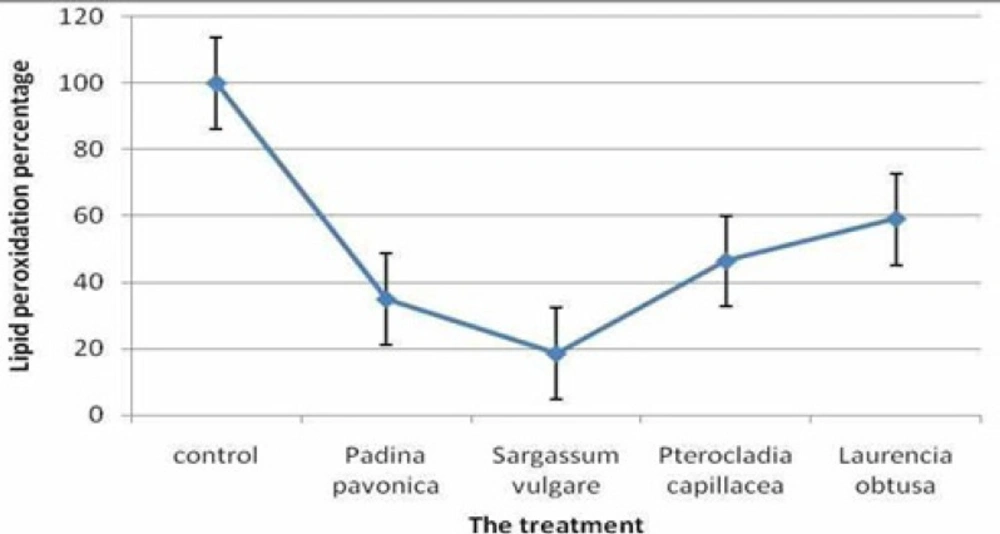
Lipid peroxidation assays
HepG2 cells (1×10
5 cells) were seeded onto 6 well plates and treated with infected serum in a co treated model. After the treatment, cells were washed twice in prewarmed PBS (pH-7.2) and scraped into 2 mL PBS, cell suspension were used for thiobarbituric acid reacting substances (TBARS) assay (
16). After 1 h of incubation of cell suspension, 1.0 mL of 5% TCA and 1.0 mL of 0.67% TBA were added in samples. The reaction mixture from the vial was transferred to the tube and centrifuged at 3500 rpm for 15 min. The supernatant was transferred to another tube and placed in a boiling water bath for 10 min. Thereafter, the test tubes were cooled and the absorbance of the color was read at 532 nm. The rate of lipid peroxidation was expressed as nmol of malonaldehyde (MDA) formed.
The lipid peroxidation inhibition rate % = [1 - (A1 -A2)/A0] × 100
Where, A0 is the absorbance of the control (without sample), A1 is the absorbance of the sample addition and A2 is the absorbance without cell line homogenate.
Statistical Methodology
Analysis of variance (one-way ANOVA) was used to identify statistically significant differences in peripheral blood mononuclear cells and HepG2 and different concentrations of seaweeds extracts. Significant diffrences means among the seaweed extracts were identified using the least significant differences (LSD) test at P<0.05. ANOVAs. All statistical analyses were performed using SPSS 15.0 software SPSS (2006).
Lipid peroxidation inhibition of polysaccharide extract of Padina pavonica,Sargassum vulgare, Pterocladia capillacea and Laurencia obtus
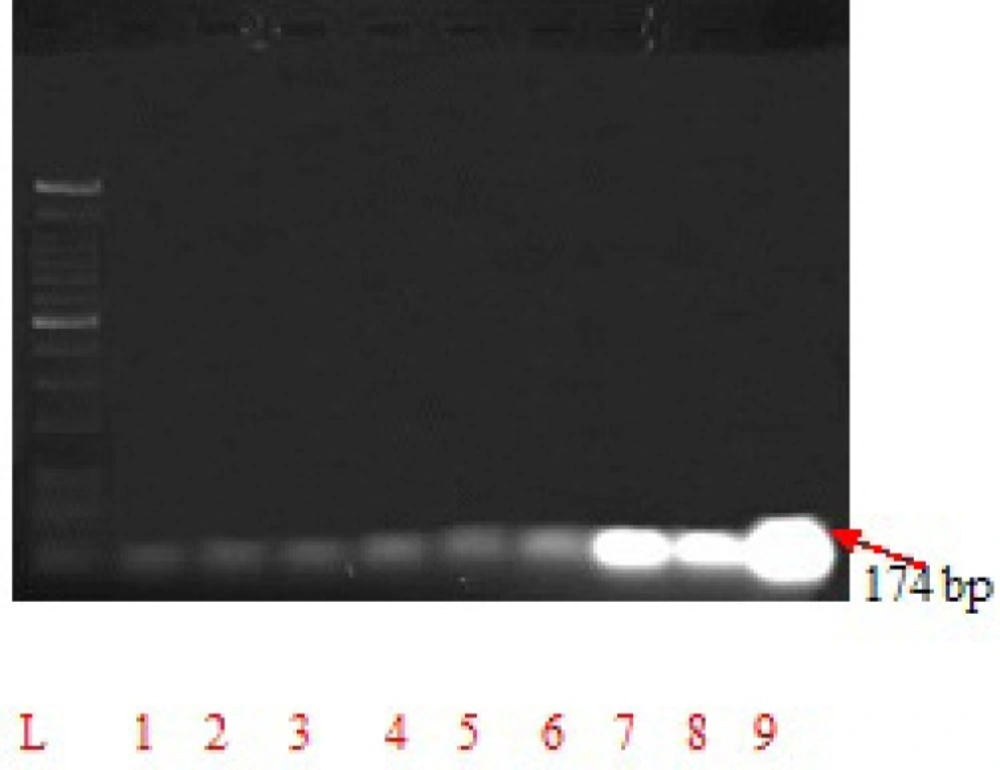
Inhibition of viral replication by Padina pavonica,Sargassum vulgare, Pterocladia capillacea and Laurencia obtuse polysaccharide extracts. Lane L, DNA ladder, Lane 1, Padina pavonica co-treatment, Lane 2, Sargassum vulgare co-treatment, Lane 3, Pterocladia capillacea co- treatment and Lane 4, Laurencia obtuse co-treatment. Lane 5, Padina pavonica pre-treatment, Lane 6, Sargassum vulgare pre-treatment, Lane 7, Pterocladia capillacea pre- treatment and Lane 8, Laurencia obtuse pre-treatment. Lane 9, amplified 174 bp of HCV from a positive control sample
| Treatment concentrations mg/mL | Cytotoxicity percentage on PBMC
| F- value |
|---|
| Padina pavonica | Sargassum vulgare | Pterocladia capillacea | Laurencia obtusa |
|---|
| 2 | 7.9±0.37 | 1.2±0.17 | 5.0±0.28 | 3.8±0.40 | 4.7ns |
| 4 | 8.1±0.57ad | 2.7±0.34 | 5.5±0.36 | 6.1±0.29da | 9.2ns |
| 6 | 8.4±0.33ad | 4.1±0.29 | 8.2±0.13 | 9.8±0.39da | 20.2* |
| 8 | 10.7±0.39abcd | 5.2±0.21bacd | 13.5±0.30cabd | 10.4±0.30dacb | 55.6*** |
| 10 | 14.0±0.32 abcd | 12.2±0.22ba | 15.1±0.30cd | 16.4±0.21da | 30.6** |
| 12 | 20.3±0.21 | 14.6±0.46 | 18.1±0.31 | 18.7±0.5 | 5.5ns |
| 14 | 22.0±0.36 | 19.3±0.18 | 24.3±0.20 | 26.6±0.28 | 0.88ns |
| 16 | 23.7±0.36 | 21.6±0.31 | 26.3±0.24 | 31.1±0.31 | 15.5ns |
P<0.05,
P<0.01,
P<0.001 and ns = not significant (i.e. P>0.05).
| Treatment concentrations mg/mL | Cytotoxicity percentage on HepG2
| F-value |
|---|
| Padina pavonica | Sargassum vulgare | Pterocladia capillacea | Laurencia obtusa |
|---|
| 2 | 10.8±0.39ad | 5.6±0.32 | 9.1±0.44 | 3.2±0.13da | 17.8* |
| 4 | 18.5±0.29abcd | 9.4±0.32bacd | 11.9±046cabd | 7.7±0.37dabc | 45.9** |
| 6 | 43.6±0.33 | 59.2±0.34 | 15.9±0.44 | 20.4±0.23 | 36.8ns |
| 8 | 44.6±0.35 | 59.4±0.44 | 28.2±0.21 | 51.0±0.27 | 85.9 ns |
| 10 | 46.6±0.33 | 73.8±0.43 | 37.7±0.45 | 62.0±0.27 | 79.2 ns |
| 12 | 69.1±0.57 | 74.2±0.14 | 69.2±0.22 | 69.8±0.50 | 60.7 ns |
| 14 | 72.7±0.35 | 77.8±0.40 | 75.3±0.22 | 76.4±0.31 | 88.7 ns |
| 16 | 76.6±0.32 | 83.9±0.47 | 76.1±0.29 | 89.9±0.49 | 80.1 ns |
P<0.05,
P<0.01 and ns = not significant (i.e. P>0.05).
Item
| CT
| Virus concentrations copies / mL
| Inhibition percentage (%)
|
|---|
| Control | 28.06 | 1.13×10¹⁰ | - |
|---|
| Padina pavonica | pre-treated | 12.22 | 3.4×10⁹ | 56.4 |
| co-treated | 5.41 | 6.7×10⁶ | 80.7 |
| post-treated | 16.23 | 5.4×10⁹ | 42.15 |
| Sargassum vulgare | pre-treated | 10.03 | 2.3×10⁹ | 64.25 |
| co-treated | 5.16 | 6.3×10⁶ | 81.61 |
| post-treated | 20.03 | 7.3×10⁹ | 28.62 |
| Pterocladia capillacea | pre-treated | 13.07 | 3.8×10⁹ | 53.42 |
| co-treated | 8.46 | 1.5×10⁹ | 69.85 |
| post-treated | 19.06 | 6.8×10⁹ | 32.07 |
| Laurencia obtusa | pre-treated | 10.03 | 2.3×10⁹ | 64.25 |
| co-treated | 4.95 | 6.00×10⁶ | 82.36 |
| post-treated | 15.43 | 5.01×10⁹ | 45.01 |