
Introduction
Methods
| Variables | Atorvastatin group | Placebo group | P value |
|---|---|---|---|
| Age ,mean ± SD | 59 ± 19 | 49 ± 18 | 0.074 |
| Gender (n) | |||
Male Female | 12 | 14 | 0.632 |
| APACHE II, mean ± SD | 20.3 ± 5.3 | 19.7 ± 4.4 | 0.684 |
| Mortality (n) | 5 | 4 | 0.401 |
| Chronic disease (n) | |||
Respiratory Diseases Cancer Cardiovascular diseases Neurological diseases Diabetes Hypothyroidism Total | 2 | 2 | 0.083 |
| Admission Diagnoses (n) | |||
Cancer Respiratory failure Cardiac problems Neurological disorders Trauma Abdominal complications Orthopedic surgeries’ complications | 8 | 8 | 0.49 |
| Culture results of the patients’ biological samples(n) | |||
Negative Respiratory Blood Urine Wound | 8 | 17 | 0.086 |
| Microorganism (n) | |||
Acinetobacter Enterobacter Pseudomonas Klebsiella Streptococcus viridians | 2 | 4 | 0.6 |
| Hemoglobin concentration (g/dl) | |||
Before treatment After treatment | 9.77 | 9.72 | 0.924 |
| Platelet count (cells/mm3) | |||
Before treatment After treatment | 239 ± 134 | 251 ± 159 | 0.792 |
| INR | |||
Before treatment After treatment | 1.25 ± 0.47 | 1.36 ± 0.53 | 0.473 |
| pH | |||
Before treatment After treatment | 7.42 ± 0.06 | 7.4 ± 0.08 | 0.185 |
| HCO3 (meq/l) | |||
Before treatment After treatment | 24.8 ± 3.5 | 24.9 ± 6.3 | 0.944 |
| Pco2 (mmHg) | |||
Before treatment After treatment | 40.4 ± 6.05 | 40.8 ± 10.6 | 0.89 |
| Sodium intake (mEq/day) | 413.4 ± 103.3 | 400.4 ± 117.6 | 0.705 |
| Potassium intake (mEq/day) | 24.2 ± 18.75 | 21.7 ± 19.7 | 0.674 |
| Calcium intake (mEq/day) | 15.79 ± 40.4 | 24.4 ± 39.8 | 0.484 |
| Phosphor intake (mmol/day) | 1.16 ± 2.77 | 1.84 ± 5.56 | 0.627 |
| Magnesium intake (mEq/day) | 5.3 ± 13.37 | 14.88 ± 22.6 | 0.088 |
| Antibiotic Regimens | |||
Vancomycin + Carbapenem + Amikacin Vancomycin + Tazocin + Amikacin Vancomycin + Cephalosporins + Amikacin Vancomycin + Amikacin Carbapenem + Amikacin Tazocin + Amikacin Carbapenem + Metronidazole + Amikacin | 10 | 15 | 0.467 |
| Indications ofamikacin administration Respiratory Sepsis Peritonitis | 17 | 16 | 0.143 |
| Other Drugs PPI Ranitidine Diuretics Hydrocortisone Vancomycin Carbapenems Tazocin Cephalosporins Inotropic agents | 14 | 21 | 0.401 |
| Metabolic support Parenteral nutrition Enteral nutrition Oral intake Parenteral and enteral nutrition | 2 | 6 | 0.663 |
| Fluid balance Input output | 3.3 ± 0.59 | 3.4 ± 0.52 | 0.686 |
| Liver function tests AST (IU/L) ALT (IU/L) | 40.79 ± 20 | 55.6 ± 40.4 | 0.152 |
| Muscle injury assessment CPK (mcg/L) | 33.18 ± 9.47 | 28.95 ± 16.87 | 0.371 |
Results
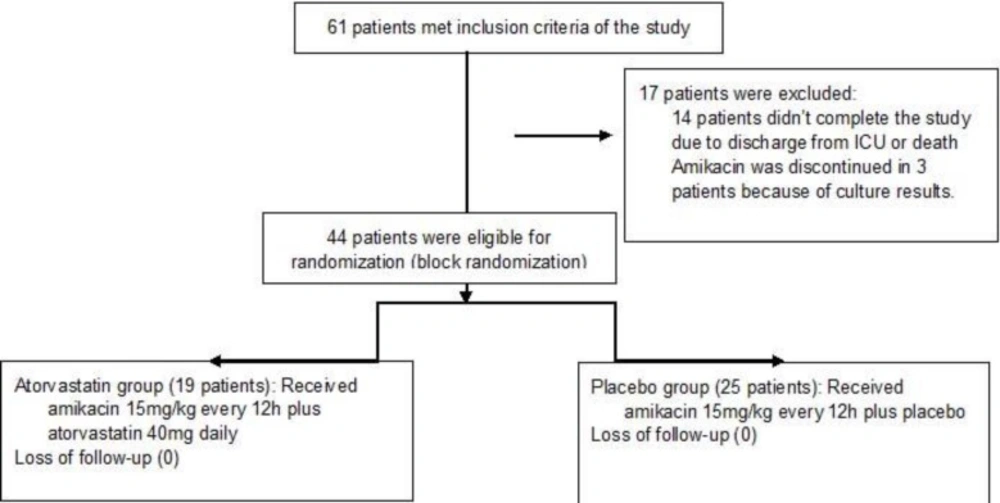
Consort flowchart of the study
| Electrolyte | Atorvastatin group | Placebo group | ||
|---|---|---|---|---|
| At baseline | After treatment | At baseline | After treatment | |
| Serum sodium concentration (mEq/L) | 138 ± 5.52 | 135.8 ± 4.60 | 136 ± 4.29 | 136.6 ± 6.50 |
| P value | 0.096 | 0.719 | ||
| Serum potassium concentration (mEq/L) | 4.07 ± 0.37 | 4.17 ± 0.63 | 4.15 ± 0.53 | 3.80 ± 0.55 |
| P value | 0.61 | 0.02 | ||
| Serum calcium concentration (mg/dL) | 7.5 ± 1.01 | 7.66 ± 0.88 | 7.4 ± 0.48 | 7.8 ± 0.82 |
| P value | 0.352 | 0.23 | ||
| Serum phosphor concentration (mg/dL) | 2.94 ± 0.39 | 3.36 ± 0.59 | 2.96 ± 0.52 | 3.45 ± 0.4 |
| P value | 0.074 | 0.021 | ||
| Serum magnesium concentration (mg/dL) | 2.2 ± 0.26 | 2.3 ± 0.44 | 1.86 ± 0.31 | 2.06 ± 0.29 |
| P value | 0.423 | 0.094 | ||
| Serum creatinine concentration (mg/dL) | 0.76 ± 0.2 | 0.76 ± 0.2 | 0.76 ± 0.3 | 0.76 ± 0.3 |
| P value | 1 | 0.94 | ||
| BUN concentration (mg/dL) | 36.1 ± 15.4 | 40.1 ± 26.5 | 36.4 ± 20.5 | 39.2 ± 23.5 |
| P value | 0.494 | 0.57 | ||
