Plant material and process hairy roots and callus calture
Plant material
Seeds from the roseus varieties of C. roseus were sterilized for 60 s with 70% ethanol and then for 15 min sodium hypochlorite (2 % available chlorine) followed by three washing with sterile distilled water and cultivated in pots inside a greenhouse. A sample of the plant was identified and a voucher specimen (6559-THE) was deposited in the herbarium, at the College of Pharmacy, Tehran University of Medicinal Science, Tehran, Iran. Explants were prepared from the young leaves (4-5 cm2, 2 months old) and used for hairy roots and callus induction (temperature 25-30 ºC and air humidity about 80%).
Agrobacterium rhizogenes suspension preparation
Agrobacterium rhizogenes strain ATCC 15834 was provided for transformation from the National Research Center for Genetic Engineering and Biotechnology of Iran that each cell of this bacteria harbors a Ri plasmid that involved in the root induction process; the root loci (
rol) genes located in the TL region. The bacterial strain was cultivated in a new solid culture medium of LB (10 g L
-1 Bactotrypton, 5 g L
-1 yeast extract, 10 g L
-1 sodium chloride plus agar 10 g L
-1 in the acidity of 7, 50 mg L
-1, rifampicin) at 28 ºC. A colony of grown bacteria was added to 5 mL liquid LB medium at 28 ºC insert on 180 rpm for 24 h in the dark. One mL of culture suspension was added to 30 mL of the same medium and shaked for 24 h, and the concentration of bacteria was adjusted to 0.4 - 0.6 by spectrophotometer (UV/Vis T90 PG instrument) at 600 nm wavelength (
21).
Induction and establishment of hairy roots culture
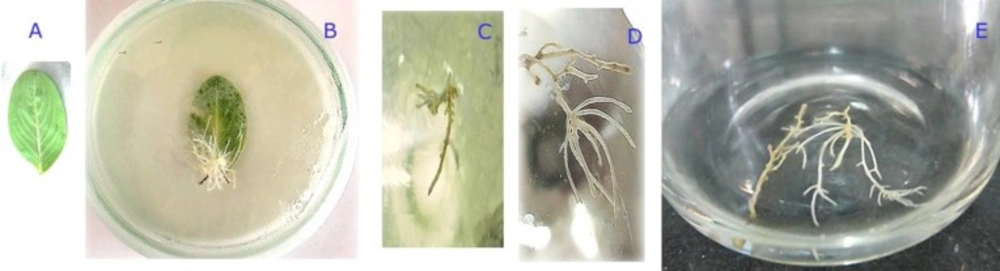
Leaves obtained from young leaves of a 2 months old were used explants, each explants was infected by injection of
A.rhizogenes strain ATCC 15834 suspension. In order to infect by injection, 5 µL of bacteria suspension were injected in to the dorsal vein of each leaf via insulin syringes angled at one or two positions. The leaf explants were blotted after 30 min with a sterile filter paper (to remove excess Agrobacterium) and transferred to petri dishes containing solid MS medium. Petri dishes were kept in darkness at 26 ºC for 48 h, and the samples were transferred to the MS medium (no hormone, 3 % sucrose, 500 mg L
-1 cefotaxime and 0.8 % agar). Hairy roots appeared at the wound sites 10 - 15 days after infection, were allowed to grow about 2 cm, and were transferred to the solid MS medium supplemented with cefotaxime 500 mg L
-1. After 4
th subculture hairy roots on solid medium, The hairy roots were excised and immediately placed into 50 mL ½ MS liquid medium containing 3% sucrose and 500 mg L
-1 cefotaxime in 250 mL Erlenmeyer flasks on a 60 rpm shaker (
22). To ensure a sufficient amount of hairy roots, a subculture was created once every 2 weeks. After 3 months hairy roots kept and used for extraction.
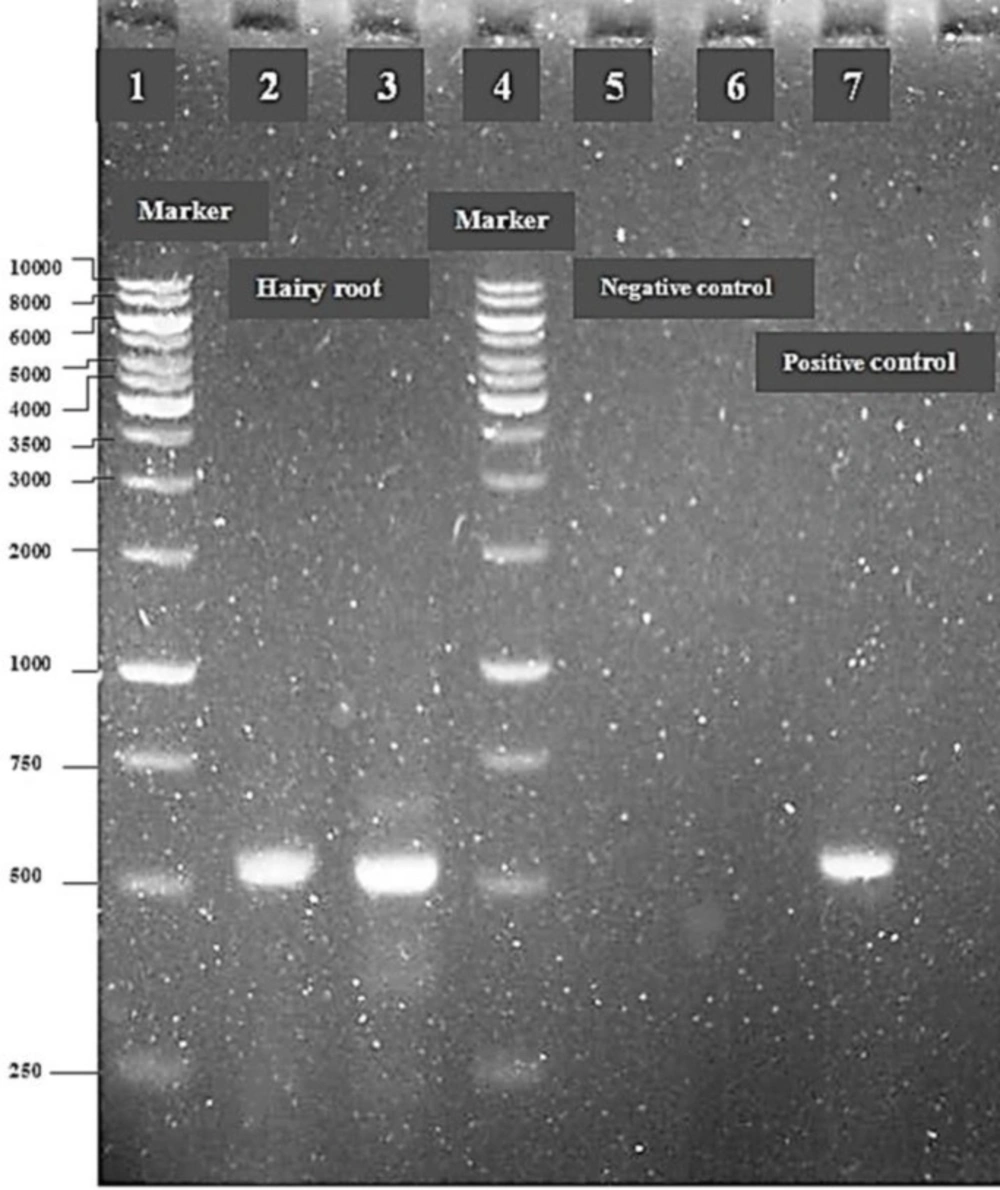
PCR analysis
The presence of T-DNA in the hairy roots was by polymerase chain reaction (PCR) and the
rolB was used as a target for PCR analysis in
C.roseus hairy roots. Hairy roots were made bacteria free by transferring into a fresh medium containing cefotaime every 14 days. The hairy roots were checked for
A.rhizogenes contamination by culturing hairy roots sample on LB medium. After the removal of bacteria, Genomic DNA was extracted via the CTAB procedure from hairy roots as well as from roots and leaves of
C. roseus (
23)
. Each PCR reaction (20.0 µL) contained: standard PCR buffer 10x (MgCl2 15 mM, KCl 500 mM, Tris-HCl 100mM, pH 8.3) 2.0 µL, dNTP Mix (10 mM) 0.5 µL, forward primer (10 µM) 1.0 µL, Reverse primer (10 µM) 1.0 µL, target DNA (50ng µL
-1) 1.0 µL, Tag DNA polymerase 0.2 µL. Amplification conditions were: 35 thermal cycles, initial denaturizing at 94 ºC for 1 min, primer annealing at 57ºC for 1 min, and primer extension at 72°C for 1 min. The sequences of the two primers used to amplify a fragment of the
rolB gene were: 5´-ATGGATCCCAAATTGCTATTCCCCACGA-3' (forward primer) and 5'- TTAGGCTTCTTTCATTCGGTTTACTGCAGC-3' (reverse primer) (
24). Ladders 1 and 4 were used as standard marker (1 kb). The amplified product was run on 1.2% (w/v) agarose gel at 100 V to separate the DNA fragments.
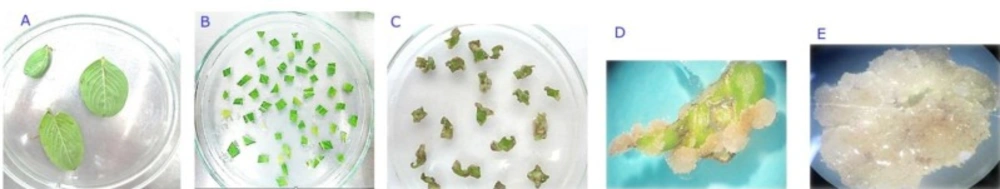
Induction of callus culture
Plant leaves were sterilized for 60 s with 70 % ethanol and then for 15 min sodium hypochlorite (2 % available chlorine) followed by three washing with sterile distilled water and cut into pieces of 0.4 - 0.6 cm
2 and were used for preparing the explants. The explants were transferred to petri dishes containing MS medium and 2, 4-Dichlorophenoxyacetic acid (2, 4-D) under sterile conditions. The cultures were maintained under a photoperiod (16 h/8 h light/ dark) at 26 ± 2 °C (
25). To ensure a sufficient amount of callus, a subculture was created once every 2 weeks. After 45 days calli kept and used for extraction.
Extraction
To study the antioxidant composition, the plant material was dried in an oven at 40 °C for 72 h and ground by a grinder (IKA, Germany). Extraction was conducted little modified Sun
et al. (2007) method with three replications (
26). Briefly, a powder (200 mg) of each sample was extracted by 20 mL of ethanol 80 %, while being stirred at the temperature of 40 °C for 2 h. After this period, the mixture was filtered and the residue was remixed with the same solvent mixture ratio and the operation was repeated for 2 h. The filtered solutions of both stages were mixed together. The extracts were evaporated by using a rotary evaporator (Heidolph 4001, Germany) at 40 °C and were dried by a freeze dryer (Cherist 1-4 LD, UK). The ethanol extracts of samples were kept at -50 °C.
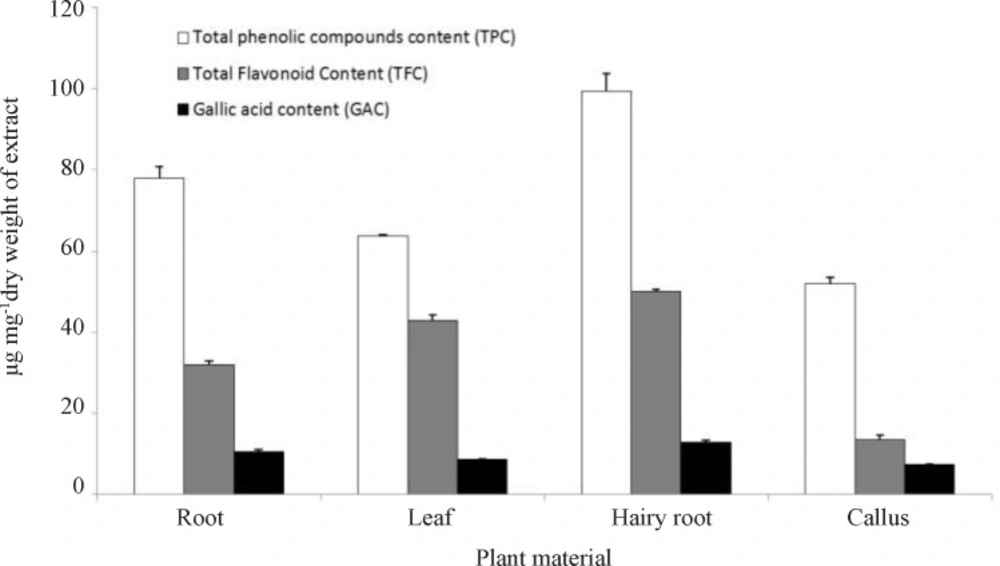
Antioxidant composition
Total phenolic content (TPC)
Total phenolic compound content was determined by the Folin-Ciocalteu method (
27). In this way, 1 mL ethanol 80% was added to 10 mg dried extract powder of each samples and stirred. 200 µL diluted folin reagent (1:10) was added to 40 µL of this extract and the mixture was shaken. After 8 min, 600 µL sodium carbonate 7.5 % was added. After mixing the solution was diluted to 4 mL with ultra-pure water and mixed. After 90 min incubation at 23 °C the absorbance of samples was measured using spectrophotometer at 760 nm by spectrophotometer (UV/Vis T90 PG instrument Ltd). The total phenolic content was expressed as tannic acid equivalent in microgram per miligram of the extract using a standard curve generated with tannic acid (Merck, Germany).
Total flavonoid content (TFC)
Total flavonoid content of the extracts was measured spectrophotometrically using aluminum chloride as described by Zhishen
et al. (1999). In this way, 500 µL ethanol extract (10 mg mL
-1) of different plant organs was added to 2 mL double distilled water. Then, 150 µL sodium nitrite 5 % was added. After 6 min, 1 mL sodium hydroxide 1 M was added. The total volume of tube was adjusted to 5 mL with distilled water. After 15 min, the absorption of samples was read using spectrophotometer at 510 nm (
28). The total flavonoid content was expressed as catechin equivalent in microgram per miligram of the extract using a standard curve generated with catechin (Sigma-Aldrich, USA).
Gallic acid content (GAC)
The chromatographic analysis was carried out on a HPLC system (Knauer, Germany) equipped with a K-1001 pump and a UV-Vis detector (K-2600) at 271 nm, column: C-18 (4.6×250 mm, 5 µ particle size). An isocratic mobile phase of methanol: ethyl acetate: water (25:50:70 v/v) with an elution volume of 0.7 mL min
-1 was selected. 20 µL of each extract was injected. The column temperature was maintained at 37 °C. Identification of gallic acid in samples was based on retention time in comparison with standard (pure gallic acid). The quantification was carried out using the external standard method. The solution of pure gallic acid (Merck, Germany) at various concentrations (1-5 µg mL
-1) was injected into the HPLC system and the calibration curve was established. The concentration of gallic acid in each sample was calculated from peak area according to calibration curve (
29). The calibration curve was linear with r
2=0.992.
Antioxidant activity
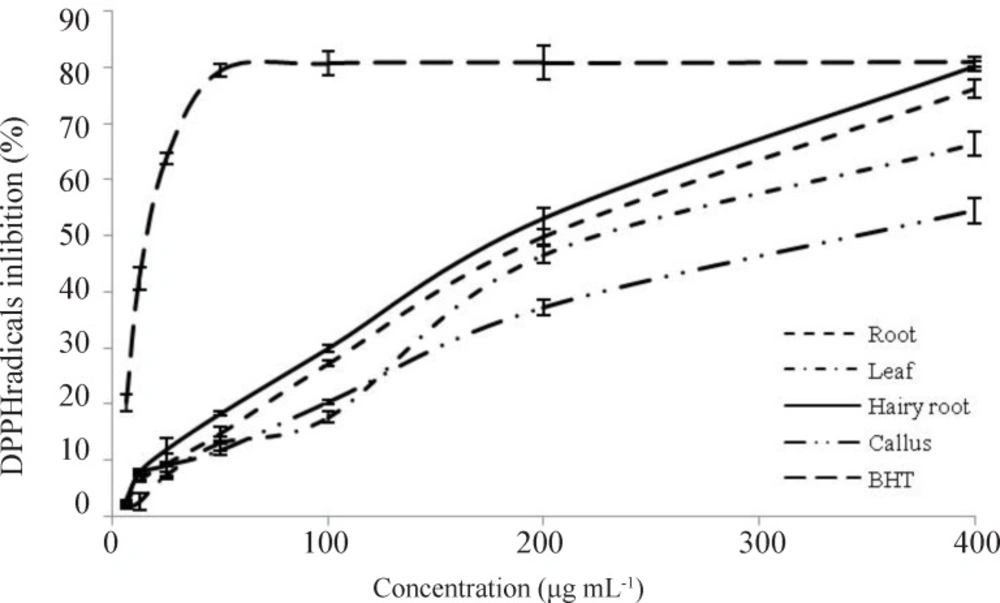
Free radical scavenging activity (DPPH assay)
The 1, 1-diphenyl-2-picrylhydrazyl (DPPH) free radical scavenging activity was assessed according to the method of Brand-Williams
et al. (1995). The absorption using spectrophotometer was measured at 517 nm after 60 min (
30). Free radicals not treated with extracts served as controls. The following equation was utilized to calculate the percentage of free radical scavenging: Scavenging activity% = (1 - A
sample/A
0) × 100.
Where A
sample is the absorbance in the presence of extract or positive control, while A
0 is the absorbance in the absence of extract (
31). The half maximal inhibitory concentration (IC
50) was defined as the concentration of the sample, required for scavenging 50% of the DPPH free radicals (
32).
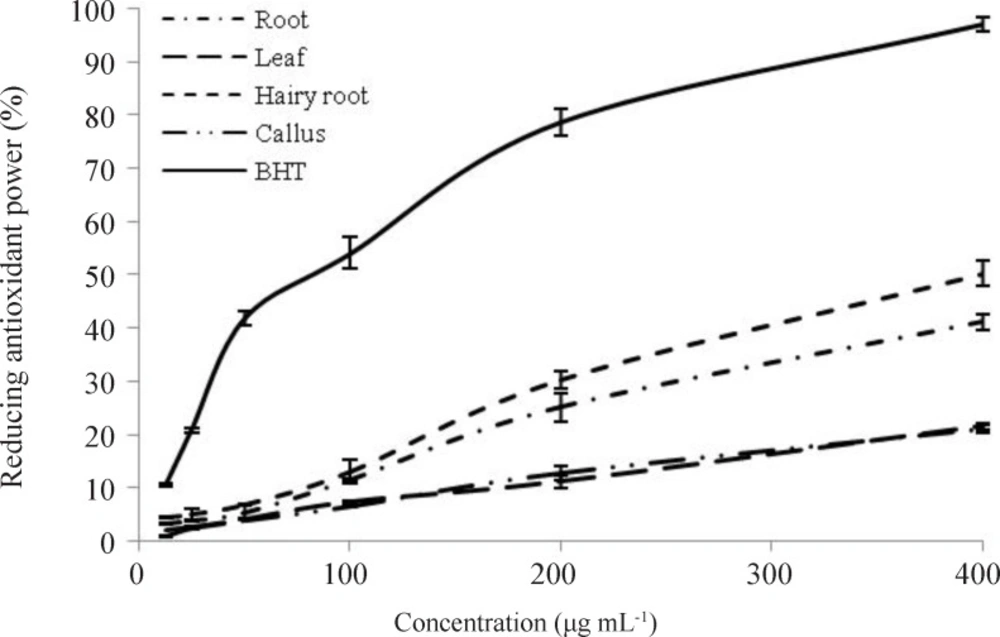
Ferric reducing antioxidant power (FRAP assay)
The reducing power of ethanol extract was measured according to the method of Ferreira
et al. (2007). In this way, 1 mL different amount of each ethanol extracts (6.25 to 400 µg mL
-1), 2.5 mL phosphate buffer 0.2 M (pH = 6.6), and 2.5 mL potassium ferro cyanide solution (10 mg mL
-1) were mixed together and incubated at 50 ºC for 20 min. 2.5 mL trichloroacetic acid (Merck, Germany) 10 % was added to the mixture and was centrifuged at 3000 rpm for 10 min. 2.5 mL the supernatant was mixed with 1 mL distilled water and 0.1 mL ferric chloride (1.0 mg mL
-1), and then the absorbance was measured at 700 nm (
33). Butylated hydroxytoluene (Sigma-Aldrich, USA) was used as positive control. Reducing capacity of the samples was calculated by the following formula: Relative reducing effect % = [A
sample - A
min/A
max - A
min] × 100
Where, A
sample is the absorbance in the presence of extract or positive control, while A
min is the minimum absorbance in the test and A
max is the maximum absorbance (
34).
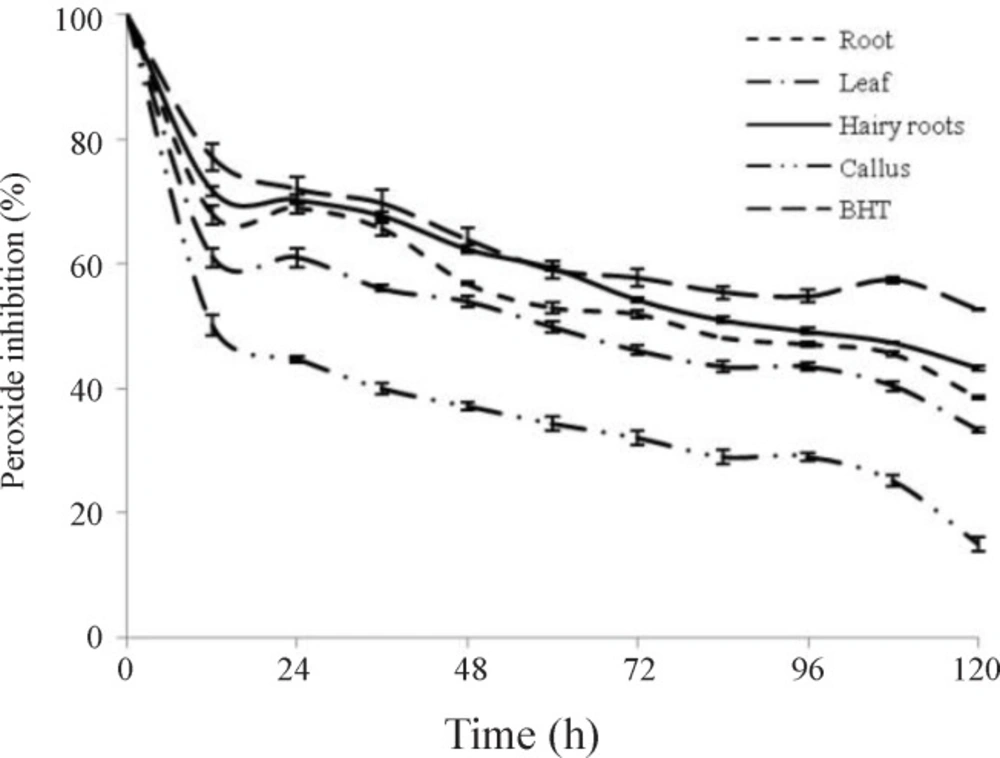
Lipid peroxidation inhibitory activity (FTC assay)
The effect of ethanol extracts on lipid peroxidation was determined by the ferric thiocyanate (FTC) method (
35). Different extracts (4 mg) were mixed with 4 mL of absolute ethanol, 4.1 mL linoleic acid (2.51 %, v/v) in absolute, 8 mL phosphate buffer (0.05 M, pH 7.0) and 3.9 mL distilled water. The mixture was placed at 40 °C in the dark. 0.1 mL this solution was then mixed with 9.7 mL ethanol 75 % and 0.1 mL ammonium thiocyanate (30 % w/v). Three minutes after adding 0.1 mL ferrous chloride (20 mM), the absorbance was measured at 500 nm in a spectrophotometer (UV/Vis T90 PG instrument Ltd). This step was repeated every 12 h until control reachs its maximal absorbance value. The mixture without added sample was used as a control. The inhibition of linoleic acid peroxidation by ethanol extracts was calculated as: Inhibition% = 100 - [(absorbance increase of the sample/absorbance increase of the control) × 100] (
36).
Malondialdehyde inhibitory activity (TBARS assay)
The effect of ethanol extracts on the formation of MDA was determined by the thiobarbituric acid reactive substances (TBARS) assay (
37). 1 mL each extract on the final hour (120 h) of the FTC assay was added to 1 mL aqueous thiobarbituric acid 0.67%. After boiling for 10 min, the tubes were centrifuged at 3000 rpm for 10 min. Absorbance of the supernatant was measured at 532 nm in a spectrophotometer (UV/Vis T90 PG instrument Ltd). The malondialdehyde scavenging activity was calculated according to the following equation: Inhibition% = (1 - A
sample/A
0) × 100
Where, A
sample is the absorbance in the presence of extract or positive control, while A
0 is the absorbance in the absence of extract (
38).
Statistical analysis
The experimental results are expressed as mean with standard error. All measurements were taken in triplicate. The data were analyzed by an analysis of variance (P 0.01) and the means were compared by Duncan’s multiple range tests. The half maximal inhibitory concentration (IC50) values were calculated from a linear regression analysis. The statistical analysis was performed by Statistical Package for the Social Sciences version 22.