

Introduction
Benzodiazepines (BZDs) are one of the most important drugs which have been used in the treatment of neuropsychological disorders such as anxiety, insomnia, agitation, depression, muscle spasms and seizures (1). Also, BZDs are used in treatment of alcohol and opioid withdrawal and for inducing of sedation and amnesia in the preoperative procedures (1).
BZDs are among the most commonly prescribed drugs (1). From this view, BZDs abuse and accidental and intentional poisonings of this class of drugs are common in the world (2-5).
There has been an increase in the reports of drug-facilitated crimes in the world (6-8). The list of drugs associated with these crimes is extensive and BZDs constitute one of the drug classes more commonly used (6-8). BZDs availability and their synergistic effects with alcohol and the other central nervous systems depressants make them attractive for criminal acts (8). They have high potential for inducing of the states like hypnosis, anterograde amnesia and muscle relaxation (1, 8). From this view, BZDs have been used as adulterating agents of alcoholic and non-alcoholic drinks and foodstuffs in drug assisted crimes such as sexual assault, and robbery (9-11). Therefore, the analysis of the BZDs in the beverages and food residues from a suspected drug assisted crime scene has a crucial role for determining of the cause of poisoning and considerable as evidence in the criminal investigations (10, 11). ). Also, the need to simultaneous analysis of more than one BZD in samples is important in both clinical and forensic toxicology.
Many analytical methods have been described for analysis of BZDs in biological and non-biological samples based on immunochemical, colorimetric, spectrophotometric and chromatographic methods (12-20). Gas chromatographic (GC) have been demonstrated as sensitive for most benzodiazepines, but, GC are time consuming and often requiring derivatization or hydrolysis prior to analysis of thermally labile BZDs (9, 13, 18).
High-performance liquid chromatographic (HPLC) methods have been described for the analysis of BZDs (10, 11, 14, 16, 17, 20). These techniques have offered greater specificity and sensitivity over immunological procedures as well as colorimetric and spectrophotometric methods, and are also more suitable than GC for thermally labile compounds; HPLC is characteristically more time efficient than GC and does not require derivatization or hydrolysis prior to analysis. However, there is a need to rapid and sensitive analytical methods for determination of BZDs in adulterated drinks when considering small volume of sample and minimizing sample preparation for forensic cases using simple and low-cost instrumentation (17, 20).
In this article, we describe a rapid, sensitive and simple HPLC method, using ultraviolet detection, for the simultaneous determination of six benzodiazepines (chlordiazepoxide, clonazepam, diazepam, flurazepam, lorazepam and midazolam) in non-alcoholic fruit based drinks for forensic applications.
Experimental
Chemicals and reagents
Clonazepam, diazepam, lorazepam, midazolam and citaloperam (as internal standard) were purchased as free base from Profarmaco (Milan, Italy). Flurazepam and chlordiazpoxide as pharmaceutical grade were supplied as a gift sample by Pars and Dr. Abidi Pharmaceutical Companies (Tehran, Iran), respectively. All other chemicals and reagents were of analytical grade and purchased from Merck Chemical Company (Darmstadt, Germany). The used water was purified on a Milli-Q ultra-pure water purification system (Millipore, Bedford, MA, USA).
The non-alcoholic fruit based drinks samples for spiking of the drugs were purchased from local market.
Apparatus and analytical conditions
HPLC analyses were performed using an Agilent chromatograph (1200 series, USA). The chromatographic system composed of an Agilent 1200 series solvent degasser, quaternary pump (G1311A, Agilent), Column oven (Thermostatted Column Compartment, Agilent 1200) , UV-VIS detector (G1314B, Agilent), Data system (ChemStation®, Version B.04.01) with software working under Windows XP operating system.
The separation was performed using an analytical Perfectsil Target Highchrom C-18 column (250mm × 4.6 mm, 5µm). The mobile phase consisted of a mixture of 0.015 mol /L potassium dihydrogen phosphate solution - methanol (50:50 v/v) which was adjusted to pH 6 with phosphoric acid and potassium hydroxide solution. The flow rate of 1.4 mL/min and the volume injection of 20 μL were constant in all cases. The mobile phase was prepared daily and filtered through a 0.45 μm Waters membrane filter (USA) before use. The detector was operated at a wavelength of 245 nm and the analyses were performed at temperature 45 C under isocratic conditions.
Preparation of stock standard solutions
Stock solutions of each drug (1 mg/mL) were prepared separately by transferring accurately weighed amounts of each compound into calibrated flasks and dissolving in methanol. These solutions were stored at 4 C and protected from light to minimize the risk of decomposition. Standard working solutions were then prepared freshly each day by appropriate dilution in the methanol. The calibration standards were prepared by diluting each of the stock solutions in the methanol to solutions with final concentrations of 0.5, 1.0, 2.0, 4.0, 8.0 and 10.0 μg/ mL of drugs.
Sample preparation
After preparing the desired concentration of drugs in the fruit base drinks, the sample was sonicated for 6 minutes in the ultrasonic bath. The samples were centrifuged at 2000 rpm for 10 minutes to precipitate coarse particles in fruit juice. The amount (about 1 mL) of supernatant is removed with a syringe and spent filters. 20 microliters of filtered sample was injected into the HPLC system.
Method validation
Once optimal chromatographic conditions have been established, the method was validated. The validation was established with respect to linearity, intra-day and inter-day precision, accuracy, specificity and sensitivity (21-22).
Linearity
The calibration graphs were obtained by injecting a series of standard solutions of each BZDs separately into the HPLC system and plotting mean chromatographic peak area against the nominal concentration of each compound. Each concentration was injected in triplicate and the mean peak area value was observed over the concentration range of 0.5 - 10 µg/ mL for all BZDs.
Precision
The system precision of the assays was investigated by performing five replicate analyses of added standard samples at three different concentrations (1.0, 4.0 and 10 µg/ mL) for each BZDs on the same day and on three separate days and evaluated by relative standard deviations (RSD) of the peak areas of each analyte.
Accuracy (recovery method)
The accuracy of HPLC method was tested by calculating the recovery of known amounts of each BZDs added separately at three different concentrations (1.0, 4.0 and 10.0 µg/mL) to samples representing the average weight of the corresponding BZDs concentrations. The recoveries were also confirmed by determination of these drugs in spiked samples containing 80, 100 and 120% of BZDs.
Limiting values
The limit of detection (LOD) was considered the lowest concentration of the analytes corresponding to three times the background noise or relationship signal to noise ratio 3:1.
Results and Discussion
Selection of Mobile phase
Different combinations of methanol and phosphate buffer were tested and the optimum condition at methanol-phosphate buffer 0.015 M (50:50 V/V) was reached (Figure 1).
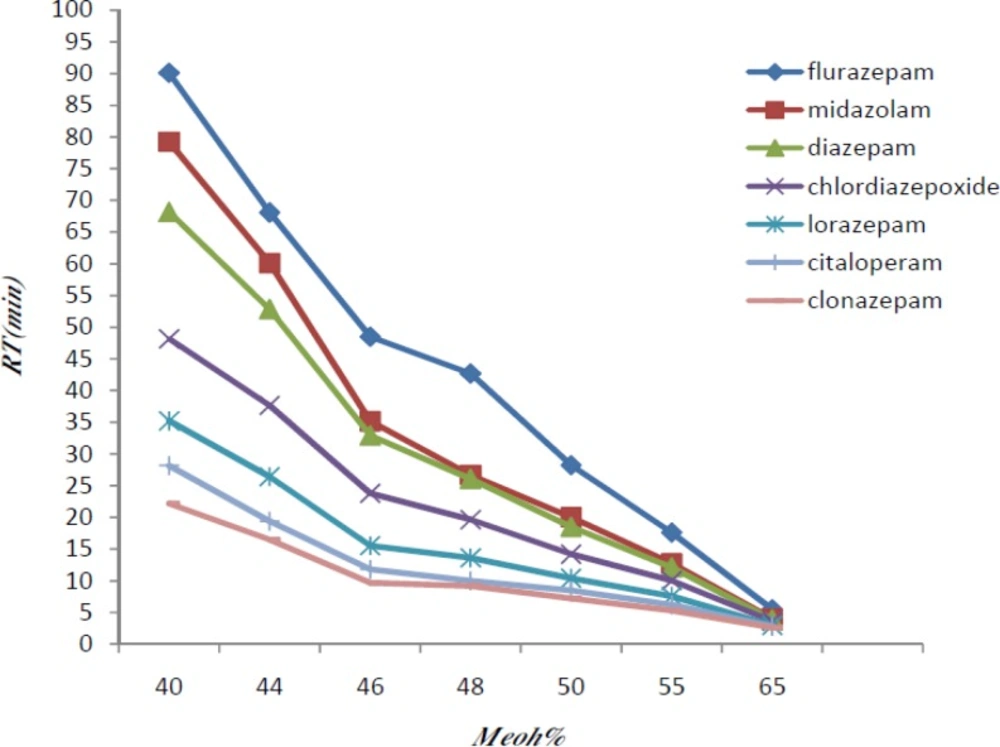
Figure 1
Effects of changing of methanol composition in the mobile phase on retention times of selected benzodiazepines
Effect of pH of mobile phase
We evaluated the effect of varying the pH (5-6). Moreover, the stability of benzodiazepines is low in the alkaline media. We observed that the best separation results were achieved at pH 6 (Figure 2).
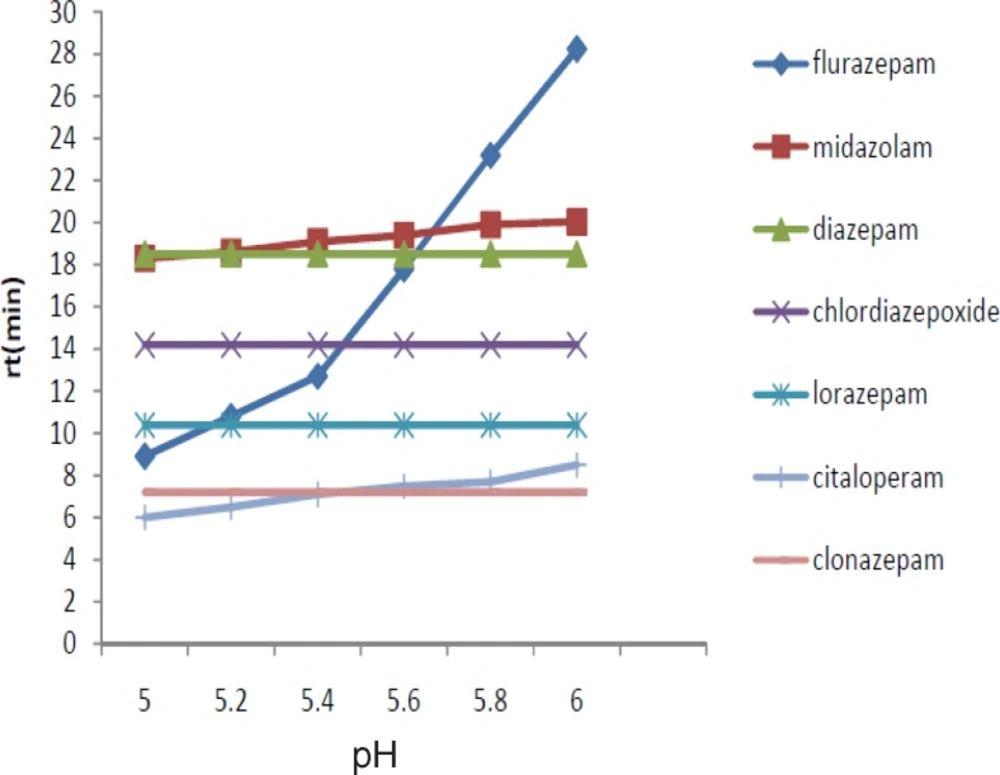
Figure 2
Change of retention times of selected benzodiazepines in different pH of mobile phase
Selection of flow rate and column temperature
Increasing of the column temperature from 25 °C to 50 °C led to a decrease in the total time required for the separation process with decrease of peak broadening and increase in sensitivity. The optimum column temperature was at 45 °C. Also, increasing the flow rate from 1 mL/min to 1.5 mL/min showed a similar decrease in the retention time. The optimum flow rate was in 1.4 ml/min.
Figure 3 showed that the obtained chromatogram with a rapid separation with different retention times of selected BZDs.
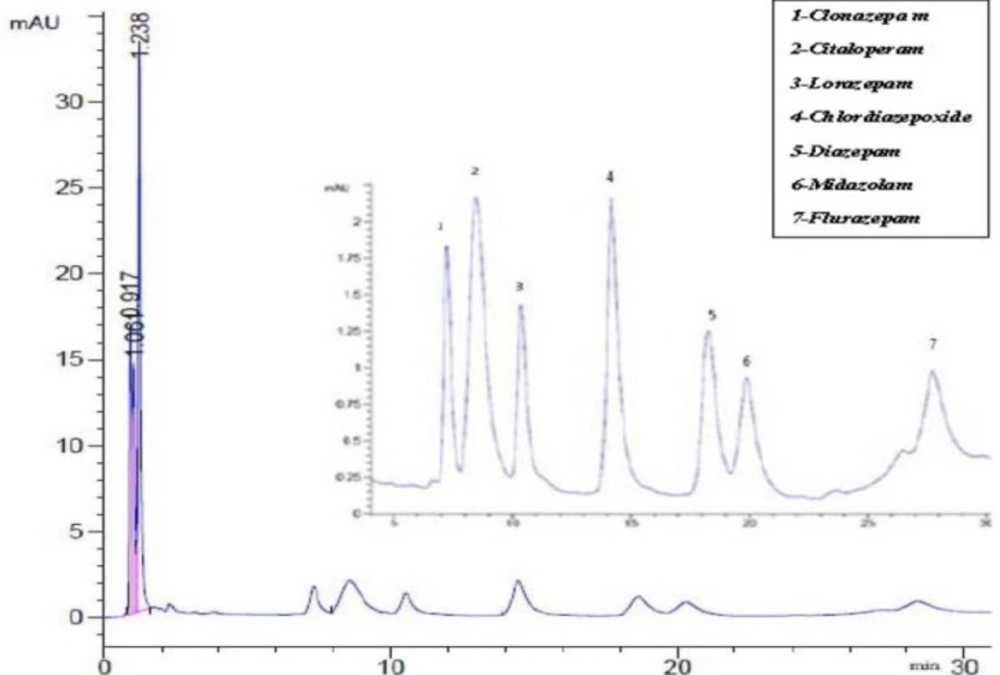
Figure 3
Chromatogram referring to the separation of selected benzodiazepine. Peak 1: clonazepam (1 µg /m), Peak 2: Citalopram (4 µg/ mL; as internal standard), Peak 3: Lorazepam (1 µg/ mL), Peak 4: Chlordiazepoxide(1µg/mL), peak 5: Diazepam (1µg/ mL), Peak 6: Midazolam (1µg/mL) and Peak 7:Flurazepam (1µg/mL
Method validation
Linearity
Table 1. shows that the regression equations of the selected BZDs in the optimum analytical condition. In the regression equation; y = ax + b, “ x” is referred to the concentration of the standard BZDs ,” y” referred to the peak area, “a” is the intercept of the straight line with y-axis and “b” is the slope of the line. The r² in table 1 referred to the correlation coefficient of the equation. All the standard BZDs showed good linearity (r² > 0.996) in a relatively wide concentration range, adequate for the analytical method.
Table 1Calibration data for the standard curves of selected benzodiazepines (n = 5).
| Benzodiazepine | Concentration Range | Linear Equation | r² |
|---|---|---|---|
| Chlordiazepoxid | 0.5 - 10 | y = 0.678x – 0.029 | 0.997 |
| Clonazepam | 0.5 - 10 | y = 0.333x – 0.013 | 0.998 |
| Diazepam | 0.5 - 10 | y = 0.589x – 0.024 | 0.999 |
| Flurazepam | 0.5 - 10 | y = 0.254x – 0.001 | 0.996 |
| Lorazepam | 0.5 - 10 | y = 0.256x – 0.024 | 0.997 |
| Midazolam | 0.5 - 10 | y = 0.412x – 0.110 | 0.997 |
Precision
Precision of a quantitative method is the degree of agreement among individual test results when the procedure is applied repeatedly to multiple samplings. It is measured by repeatedly injecting a ready-made sample pool and expressed as coefficient of variation of the results. Within-day (n = 5) and between-day (n = 3) precision presented coefficients of variation and relative errors lower than 10%. These results are presented in table 2.
Table 2Intra-day and inter-day variations of the HPLC method for determination of selected benzodiazepines
| Inter-day | Intra-day | |||||
|---|---|---|---|---|---|---|
| Precision | Accuracy | Measured concentration | Precision | Accuracy | Measured concentration | Added concentration |
| Chlordiazepoxide | ||||||
| 4.071.48 | 4 | 1.04 ± 0/042 | 7.69 | 1 | 1.01 ± 0.077 | 1 |
| Clonazepam | ||||||
| 3.62 | -2 | 0.98 ± 0.035 | 6.32 | -6 | 0.94 ± 0.059 | 1 |
| Diazepam | ||||||
| 3.58 | -8 | 1.08 ± 0.038 | 3.45 | 7 | 1.07 ± 0.037 | 1 |
| Flurazepam | ||||||
| 2.35 | -4.4 | 0.95 ± 0.022 | 2.5 | -5 | 0.95 ± 0.023 | 1 |
| Lorazepam | ||||||
| 4.04 | -3 | 0.97 ± 0.039 | 3.5 | -4 | 0.96 ± 0.032 | 1 |
| Midazolam | ||||||
| 3.3 | 5 | 1.05 ± 0.035 | 3.23 | 4 | 1.04 ± 0.033 | 1 |
SE = 100 × (measured concentration - added concentration) / added concentration
Recovery
Recovery of selected BZDs ranged from 93.7% to 108.7% employing method of sample preparation. The coefficients of variation for this technique were lower than 10%. Results are summarized in table 3.
Table 3.Accuracy/ Recovery of selected BZDs in proposed method
| Mean | 10(µg/ mL) | 4(µg/ mL) | 1(µg/ mL) | Benzodiazepine | ||||
|---|---|---|---|---|---|---|---|---|
| CV(%) | Recovery(%) | CV(%) | Recovery(%) | CV(%) | Recovery(%) | CV(%) | Recovery(%) | |
| 2.82 | 102.08 | 1.04 | 99.13 | 1.82 | 101.1 | 4.62 | 106 | Chlordiazepoxid |
| 1.74 | 97.16 | 1.4 | 94.9 | 0.72 | 99 | 4.37 | 97.6 | Clonazepam |
| 4.42 | 102.38 | 1.3 | 100.2 | 1.01 | 98.25 | 7.74 | 108.7 | Diazepam |
| 4.41 | 98.03 | 1.19 | 93.1 | 1.59 | 103.7 | 5.9 | 97.3 | Flurazepam |
| 1.42 | 97.92 | 0.54 | 99.6 | 2.62 | 97.25 | 4.99 | 96.3 | Lorazepam |
| 4.22 | 100.19 | 0.64 | 96 | 0.32 | 98.58 | 2.77 | 106 | Midazolam |
Selectivity
Chromatogram related to 1µg/mL of chlordiazepoxid, clonazepam, diazepam, flurazepam, lorazepam, midazolam and 4 µg/ mL citaloperam (as internal standard) were showed in Figure 3. There is no interference between matrix of blank sample and this method is selective selective (Figure 4).
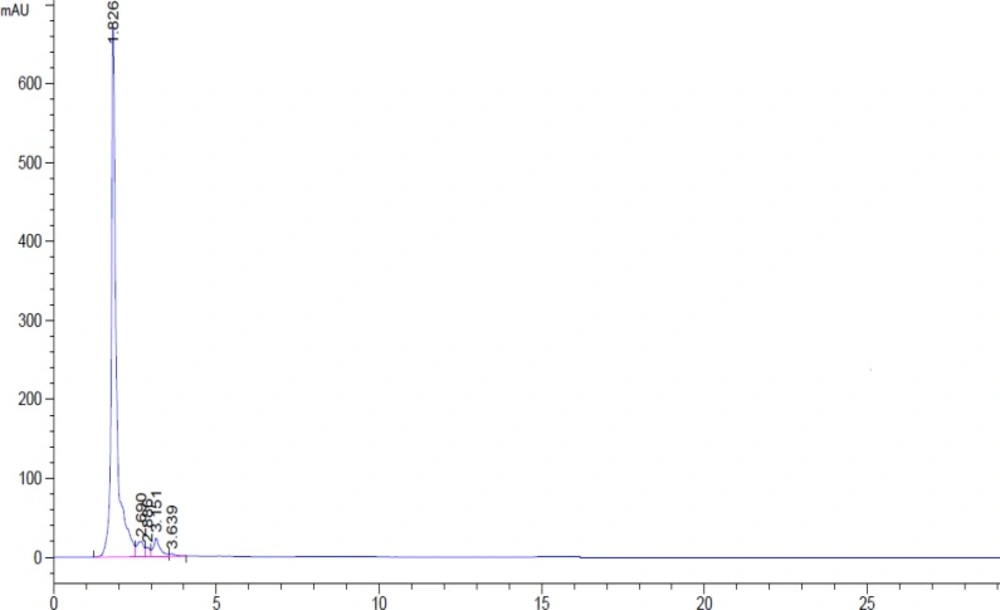
Figure 4
Chromatogram of the blank sample of drinks
Detection and quantification limits
The determined values of LOD and LOQ for selected BZDs in the proposed method have been showed in Table 4. In this method, LOD for chlordiazepoxide, clonazepam, diazepam and midazolam was 0.01µg/mL and for Lorazepam and Flurazpam was 0.02µg/mL. LOQ for chlordiazepoxide, clonazepam, diazepam, and midazolam was 0.03 µg/mL and for lorazepam and flurazpam was 0.05 µg/ mL.
Table 4Detection and quantification limits of the selected benzodiazepines in the method
| Benzodiazepine | Limit of Detection | Limit of Quantification |
|---|---|---|
| Chlordiazepoxid | 0.01 | 0.03 |
| Clonazepam | 0.01 | 0.03 |
| Diazepam | 0.01 | 0.03 |
| Flurazepam | 0.02 | 0.05 |
| Lorazepam | 0.02 | 0.05 |
| Midazolam | 0.01 | 0.03 |
