Introduction
Piroxicam is a non-selective prostaglandin G/H synthase (better known as cyclooxygenase or COX) inhibitor that acts on both prostaglandin G/H synthase 1 and 2 (COX-1 and -2). COX catalyzes the conversion of arachidonic acid to a number of prostaglandins involved in fever, pain, swelling, inflammation, and platelet aggregation. Piroxicam antagonizes COX by binding to the upper portion of the active site and preventing its substrate, arachidonic acid, from entering the active site. The analgesic, antipyretic and anti-inflammatory effects of piroxicam occur as a result of decreased prostaglandin synthesis. Piroxicam also inhibits the migration of leukocytes into sites of inflammation and prevents the production of thromboxane A2, an aggregating agent, by platelets (1, 2, 5, 6 and 7).
Industrial powder of piroxicam is an amorphous white powder but piroxicam also has two different needle and cubic polymorphs crystalline shapes (1, 5 and 6). They are different in physicochemical properties such as biological solubility. Different solvents, different technological procedures (melting, rapid and slow cooling) and some other operating parameters such as pH, agitation speed and agitator paddle shape affect the particles shapes and formation of polymorphous piroxicam (1-3 and 17).
In the current study using Taguchi experimental design approach, the influences of some main physicochemical properties, possibilities of their formation and their avoidance were examined and then the dissolution rate of piroxicam powder was optimized.
Experimental
Experimental design
The conventional one-at-a-time approach to evaluate the influences of process parameters on product quality or quantity requires numerous experimental runs (particularly when a lot of variables are to be investigated at different levels) to fully explore the entire parameter space. In this respect, the Taguchi experimental design method can reduce the number of experiments while retaining data collection quality. The quantified and comparative analysis of the factor effects is the second advantage of this approach (9, 10).
The first important step in design of experiment is the proper selection of factors and their levels. In this study, five operating factors include the type of solvent, type of cooling (rapid and slow cooling), type and shape of mixture paddle, pH, and agitator speed were considered in three levels (Table 1). The factors and their levels have been chosen according to a literature review on previous publications as well as industrial recipes for production and optimization of piroxicam powder (1, 4-8). For design of experiments with five factors and three levels for each factor, a standard L18 orthogonal array was employed (Table 2). Each row of the matrix represents one run at specified condition. In order to avoid the systematic bias, the sequence in which these runs were carried out was randomized. The statistical analysis of the results was carried out using Qualitek-4 (Nutek Inc.) software (9, 10).
| Factors | Levels | |||
|---|---|---|---|---|
| Description | unit | 1 | 2 | 3 |
| Type of agitator paddle(A) | - | turbine | propeller | butterfly |
| Type of cooling(B) | - | fast | slow | Cold water droplet |
| Type of solvent(C) | - | ethanol | Water/ethanol | pp.glycole/ethanol |
| Agitation Speed(D) | rpm | 100 | 200 | 300 |
| Run no. | Operating variables | ||||
|---|---|---|---|---|---|
| A | B | C | D | E | |
| 1 | 1 | 1 | 1 | 1 | 1 |
| 2 | 1 | 2 | 2 | 2 | 2 |
| 3 | 1 | 3 | 3 | 3 | 3 |
| 4 | 2 | 1 | 1 | 2 | 2 |
| 5 | 2 | 2 | 2 | 3 | 3 |
| 6 | 2 | 3 | 3 | 1 | 1 |
| 7 | 3 | 1 | 2 | 1 | 3 |
| 8 | 3 | 2 | 3 | 2 | 1 |
| 9 | 3 | 3 | 1 | 3 | 2 |
| 10 | 1 | 1 | 3 | 3 | 2 |
| 11 | 1 | 2 | 1 | 1 | 3 |
| 12 | 1 | 3 | 2 | 2 | 1 |
| 13 | 2 | 1 | 2 | 3 | 1 |
| 14 | 2 | 2 | 3 | 1 | 2 |
| 15 | 2 | 3 | 1 | 2 | 3 |
| 16 | 3 | 1 | 3 | 2 | 3 |
| 17 | 3 | 2 | 1 | 3 | 1 |
Materials
μ?
Recrystallization
± C) placed inside the reactor, and was controlled by a Ben marry set. At first step of recrystallization, the reactor was first charged with 0.5 litter of solvent according to the experimental design table (Table 2??1, 2, 11-14).
Characterizations
Yield determination
?
Where m1 and m2 are the amount (grams) of final dried recrystallized piroxicam and initial samples, respectively (1, 9).
Particle size and shape measurement
A 1 mg.mL-1?Qudix-scatheroscope Particle size analyzer. This method was applied identically to all 18 samples to keep a similar condition for samples (1, 2 and 15-17).
Dissolution rate test
For determination of dissolution rate, 100 mg of the crystals was added to 250 mL of distilled water at 25 °C in a dissolution testing device according to references (Dissolution Tester Erweka-DT800, Japan). Rotation speed was 100 rpm. At regular intervals (15 minutes; 0, 15, 30, 60), samples were taken, and the volume was replaced. Concentrations were determined using the UV-spectrophotometer at 350 nm (UV-160A spectrophotometer, Shimadzu, Japan) (1, 15-17).
Results and Discussions
Eighteen experiments were carried out according to Table 2. The results of all measurements are summarized in Table 3.
| Run no. | Measured parameters | ||||
|---|---|---|---|---|---|
| Yield% | Particle size | Particle shapes | Melting point( C) | Dissolution percent in first 30 minutes% | |
| 1 | 69 | 157 | needle | 201.0 | 109.6 |
| 2 | 92 | 96.6 | cubic | 204.5 | 31.0 |
| 3 | 89 | 145 | needle | 188.5 | 87.3 |
| 4 | 81 | 128 | needle | 201.5 | 100 |
| 5 | 96 | 117 | cubic | 205.0 | 27.5 |
| 6 | 85 | 130 | cubic | 203.6 | 38.1 |
| 7 | 86 | 96.6 | needle/cubic | 205.1 | 59.0 |
| 8 | 92 | 86.6 | needle/cubic | 205.3 | 88.3 |
| 9 | 86 | 80.1 | needle | 202.1 | 34.6 |
| 10 | 97 | 74.1 | cubic | 204.9 | 34.5 |
| 11 | 98 | 84 | needle | 202.9 | 45.9 |
| 12 | 87 | 152 | cubic | 205.5 | 19.3 |
| 13 | 86 | 175 | cubic | 204.7 | 31.6 |
| 14 | 89 | 66.4 | cubic | 204.5 | 29.8 |
| 15 | 87 | 68.5 | needle/cubic | 205.2 | 58.5 |
| 16 | 86 | 132 | cubic | 197.7 | 78.2 |
| 17 | 87 | 42.9 | needle | 203.7 | 37.2 |
| 18 | 84 | 74.1 | cubic | 203.9 | 27.1 |
In Taguchi method the results are statistically analyzed using analysis of variance (ANOVA) to determine the partial contribution of each operating factor on the response. The strategy of ANOVA calculation is to extract from the results that how much each factor is effective on response or responses of experiments (9, 10). This statistical table also distinguishes the significant factors. There are many statistical terms in ANOVA table, among them few are more meaningful. The F-ratio is a criterion for distinguishing the important factors from those with less significance. It should be emphasized that the interpretation of ANOVA table is valid just in the range of levels considered for each factor. The main effects of factors are determined using average values of response at each level (9, 10).
Effects of process parameters on particle size
Table 4 shows the analysis of variance for particle size. As it is observed, the predominant factor for controlling the particle size in recrystallization process is the type of cooling and pH is the second major effective factor. The type of mixture paddle and type of solvent show low effects on the particle size formation. It is implied from data in ANOVA table that the agitation speed has no significant influence on particle size. These statistical results have been confirmed by reported literatures (11-15, 17).
| Factor | DOF | Sums of squares | Variance | F-ratio | importance |
|---|---|---|---|---|---|
| Type of agitator paddle(A) | 2 | 3829.5 | 1914.8 | 1.841 | 3 |
| Type of cooling(B) | 2 | 6090.9 | 3045.4 | 2.93 | 1 |
| Type of solvent(C) | 2 | 1895.4 | 947.7 | 0.911 | 4 |
| Agitation Speed(D) | 2 | 257.99 | 128.99 | 0.124 | 5 |
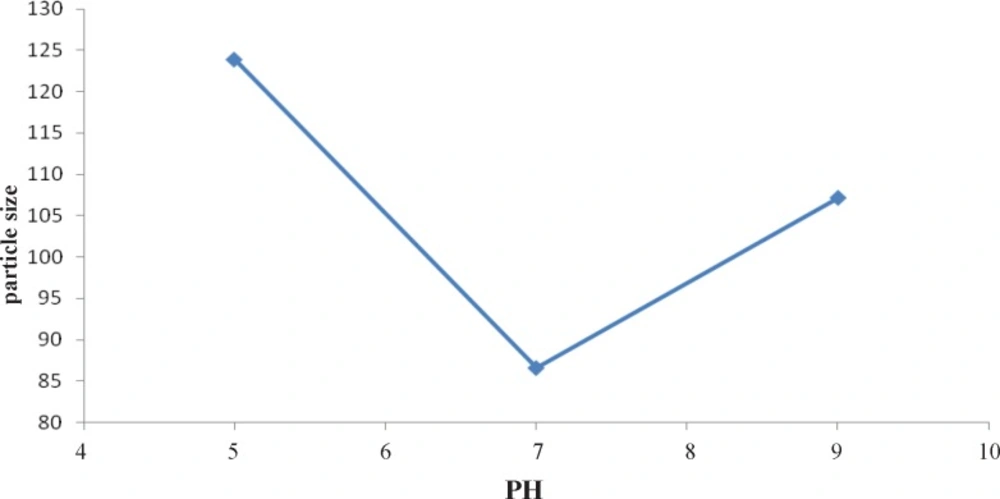
Figure 1 indicates the effect of type of cooling on particle size. It shows that slow cooling (level 2) results in formation of the smallest particle versus other levels and Figure 2 shows the second level (pH=7) is the best pH for formation of the smallest particles.
Effects of process parameters on dissolution rate
Table 5 shows the ANOVA table (analysis of variance) of dissolution rate of piroxicam samples. As it is observed the predominant factors for controlling the dissolution rate in samples are the type of solvent and then type of cooling respectively. The pH and agitation speed during crystallization process have slight affects on the dissolution rate of sample powders and type of agitator paddle has no significant effect on the response.
| Factor | DOF | Sums of squares | Variance | F-ratio | Percent |
|---|---|---|---|---|---|
| Type of agitator paddle(A) | 2 | 184.01 | 92.003 | 0.12 | 5 |
| Type of cooling(B) | 2 | 2524.06 | 1262.03 | 1.653 | 2 |
| Type of solvent(C) | 2 | 3499.17 | 1749.6 | 2.292 | 1 |
| Agitation Speed(D) | 2 | 1250.83 | 625.5 | 0.819 | 3 |
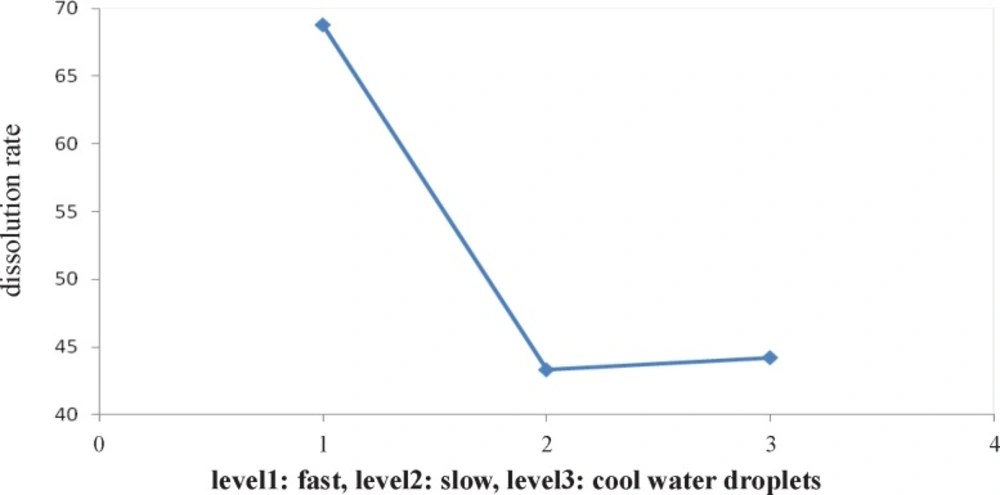
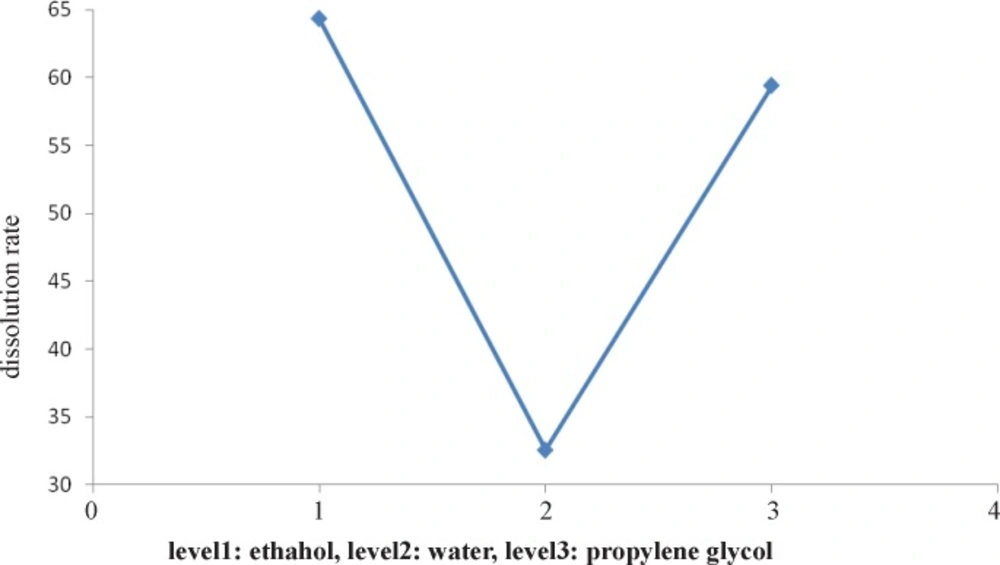
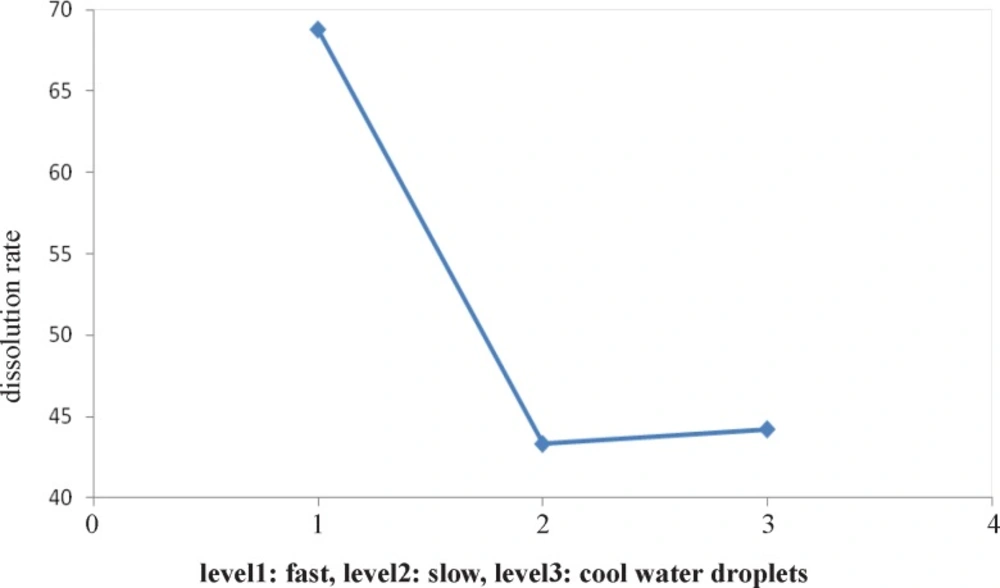
Figure 3 indicates that the effect of type of solvent on dissolution rate. It shows that ethanol solvent causes to produce better particles versus other levels at dissolving rate. Figure 4 shows after type of solvent factor, the first level (fast cooling) is the best versus other levels for formation of faster dissolution rate particles.
Table 5 shows the optimum conditions for the best response (fast dissolution rate particles) that Qualitek4 software suggests of particle size data.
Optimum conditions for producing fast dissolution rate particles
Table 6 shows the software suggests optimum conditions for crystallization process to produce the best powder by increased dissolution rate.
The optimum condition for attaining the best powder by increased dissolution rate is reported in Table 6. The best level of each factor for improvement of response is given in this table.
| Level | Describe | Factor |
|---|---|---|
| 1 | turbine | Type of agitator paddle(A) |
| 1 | fast | Type of cooling(B) |
| 1 | ethanol | Type of solvent(C) |
| 2 | 200 | Agitation Speed(D) |
These conditions were tested again and the powder was extracted and purified by current last methods that used for other samples. The properties of prepared powder were reported in Table 7.
| Result | Parameter |
|---|---|
| 138 | μ |
| needle | Particle shape |
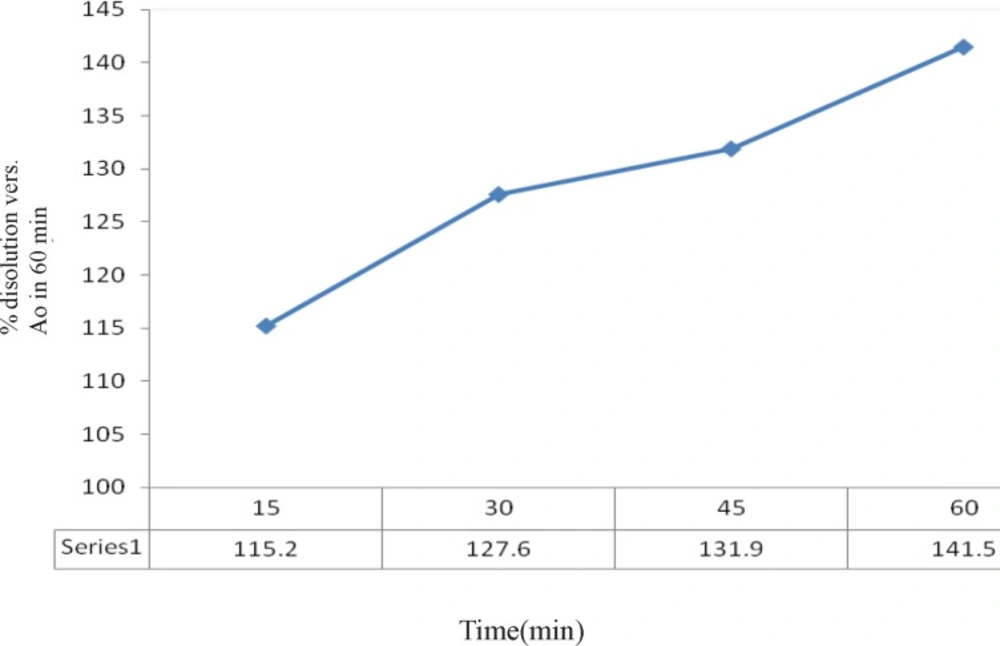
| 127.6 | Dissolution rate% |
Dissolution rate of prepared powder was tested again and reported in Figure 5. Results reveal the prepared powder shows 27.6 % faster releasing more than industrial sample.
Based on these results it is revealed that an optimum particle size between 120-169 µm and needle crystals are the best style for dissolution rate of piroxicam powder. The needle shape of particles is more important than particle size. Run 6, 13, 16 response shows particles with cubic shape and optimum size (120-160 µm) have no effective dissolution rate but particles with needle shape demonstrate better dissolution rate so it is confirmed the conditions for the best dissolution rate are an optimum particle size in range of 120-160 µm and needle shape crystals.
Conclusions
Using Taguchi experimental design the influence of five operating variables on particle size and dissolution rate of industrial piroxicam powder in recrystallization process was statistically analyzed. The main conclusions are summarized below:
1) Type of cooling and pH of recrystallization process show maximum effects on the Particle size with respect to the selected levels in this study.
2) Slow cooling and pH=7 result in producing small particles but acidic pH and fast cooling result in producing larger particles.
3) Type of solvent and type of cooling in recrystallization process demonstrate the maximum effects on dissolution rate of prepared particles.
4) Ethanol solvent and fast cooling result in producing the particles with best dissolution rate.
4) The optimized conditions to prepare the powder with the best dissolution rate are summarized below:
□□type of cooling = fast
□□agitation speed = 200
□□pH=9
□□type of mixture paddle: turbine
The optimum produced powder has 27.6% faster releasing versus industrial sample in first 30 minutes. Our obtained results reveal that an optimum particle size between 120-169 µm and needle shape crystals are the best style for dissolution rate of piroxicam powder.
