Morphologic studies
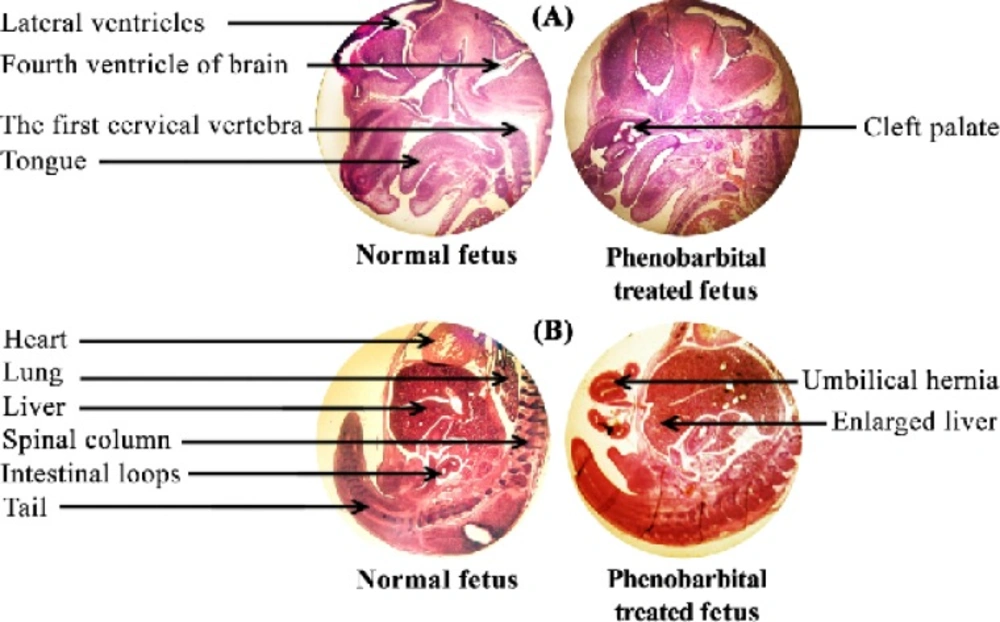
Figure 1 shows the H & E stained sections of a normal and phenobarbital treated mice fetus liver (A) and brain (B). Clearly, the size of phenobarbital treated fetus and especially its liver is larger than the normal fetus. Cleft palate and umbilical hernia were seen in Phenobarbital treated fetus (
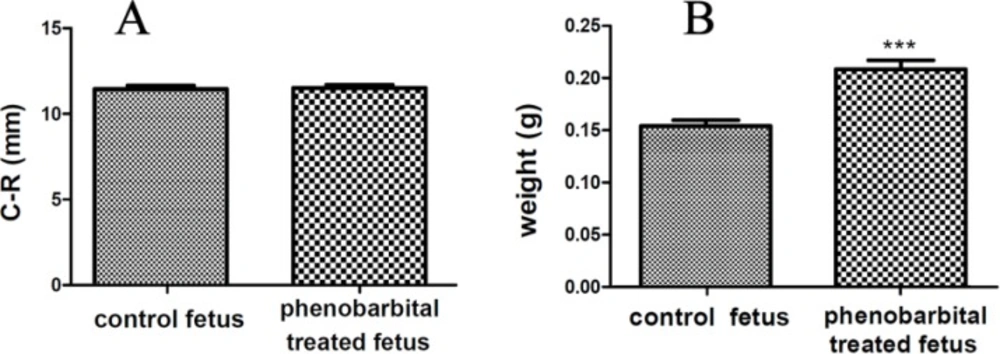
Figure 1 (A) & (B)). In this study, the C-R length of phenobarbital treated fetus was more than the normal fetus, but there wasn't any significant difference between them (control group C-R mean, 10.54±0.76 and treated group C-R mean, 10.53±0.66) (p<0.01) (
Figure 2 (A)). The weight of phenobarbital treated fetus was more than that of normal fetus and there was a significant difference between them (control group weight mean, 0.154±0.018 and treated group weight mean, 0.209±0.029) (p<0. 01) (
Figure 2 (B)).
Photomicrograph of H & E stained sections of mice fetus brain (A) and liver (B).
The C-R length of mice fetus (A)(control group C-R mean, 10.54±0.76 and treated group C-R mean, 10.53±0.66), (p< 0.01).The weight of mice fetus (B), (control group weight mean, 0.154±0.018 and treated group weight mean, 0.209±0.029), (p< 0.01).
FTIR studies to determine compositional, structural and dynamical changes in phenobarbital treated mice fetus liver
In the present study, the effect of phenobarbital treatment at 120 mg/Kg/day dose on 9
th day of pregnancy in mice fetus was investigated at molecular level by using FTIR microspectroscopy.
Figures 3,
4,
5,
6 and
7 illustrated the typical IR spectra, 2
nd derivative and also difference of the liver tissues spectra of mice fetus exposed to phenobarbital minus the control liver tissues spectra. The information contained in this IR absorption spectrum originates from many different types of biomolecules in the tissue, including proteins, lipids, carbohydrates, and nucleic acids.
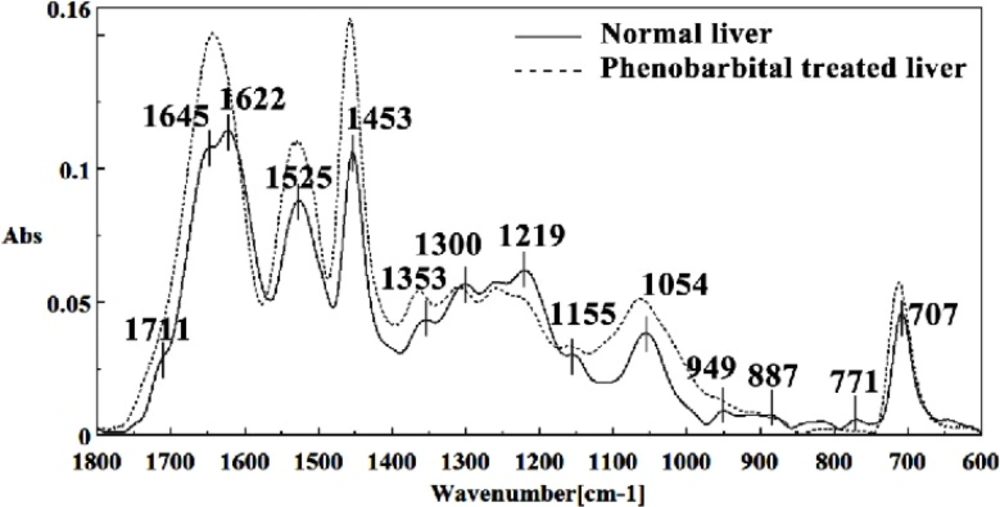
Mid-infrared spectra of (solid line) and phenobarbital treated (dot line) liver sections in the 1800–600 cm-1 wave number region. The spectra are baseline-corrected and normalized.
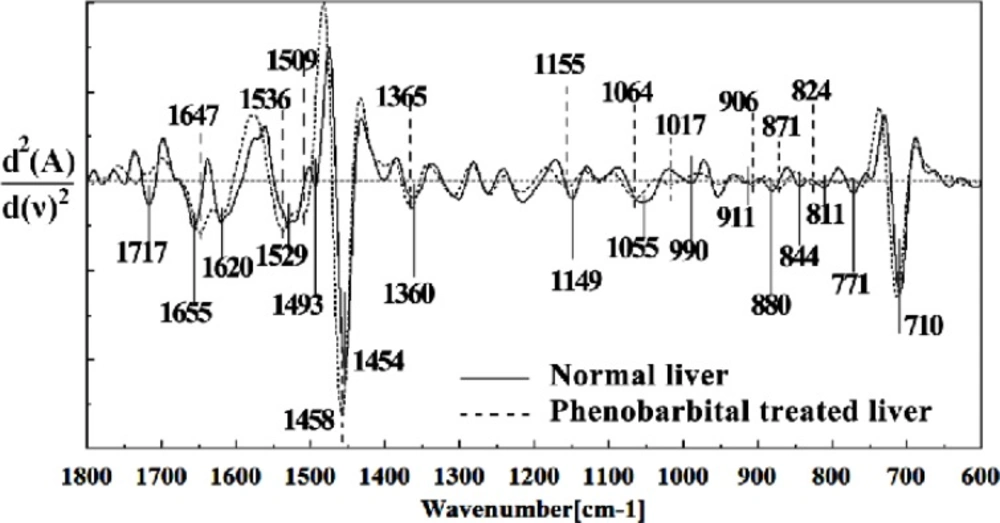
The intensity and frequency of the amide I bands at around 1645 cm-1 and 1622 cm-1 in treated tissue were increased, shifted and also converted to one peak instead of two peaks compared to control tissue, mainly owing to the Amide I, C5 methylated cytosine, C=O, stretching C=C uracyl, NH2 (1645 cm-1) and peak of nucleic acids due to the base carbonyl stretching and ring breathing mode (1622 cm-1).
Moreover, the intensity and frequency of the amide II bands at around 1453cm-1and 1525cm-1 in treated tissue were increased and shifted compared to control tissue, mainly owing to asymmetric methyl deformation and Stretching C=N, C=C, respectively. The intensity and frequency of the bands at around 1353 cm-1 was increased and shifted compared to control tissue, mainly owing to Stretching C-O, deformation C-H, deformation N-H, the intensity at 1300 cm-1 was shifted owing to Deformation N-H cytosine, the intensity at 1256 cm-1 and 1219 cm-1 were reduced and shifted compared to control tissue in treated tissue PO-2 asymmetric (phosphate I) (1256 cm-1) and PO2- asymmetric vibrations of nucleic acids when it is highly hydrogen-bonded Asymmetric hydrogen-bonded phosphate stretching mode (1219 cm-1).
The absorption band at around 949 cm-1 in treated tissue resulted from Symmetric stretching vibration of v1PO4 3- (phosphate of HA) was approximately disappeared. The intensity of Left-handed helix DNA (Z form) at 841 cm-1 , a band at 817 cm-1 in the treated tissue, corresponding to Ring CH deformation were reduced. The absorption band at around 771 cm-1 in treated tissue resulted from Guanine in a C3´ endo/syn conformation in the Z conformation of DNA was reduced and shifted in treated fetus. The absorption band at around 707 cm-1 owing to the Out-of-plane bending vibrations was shifted and increased in treated fetus. A band at 1155 cm-1 in treated tissue, corresponding to the C-O stretching vibration was increased and shifted.
The absorption band at around 1711 cm-1 due to C=O (the region of the bases) in treated tissue was disappeared. The intensity of the absorption band at around 1054 cm-1 due to from phospholipid phosphate and partly from oligosaccharide C-OH bonds phosphate ester in treated tissue was gradually increased and shifted.
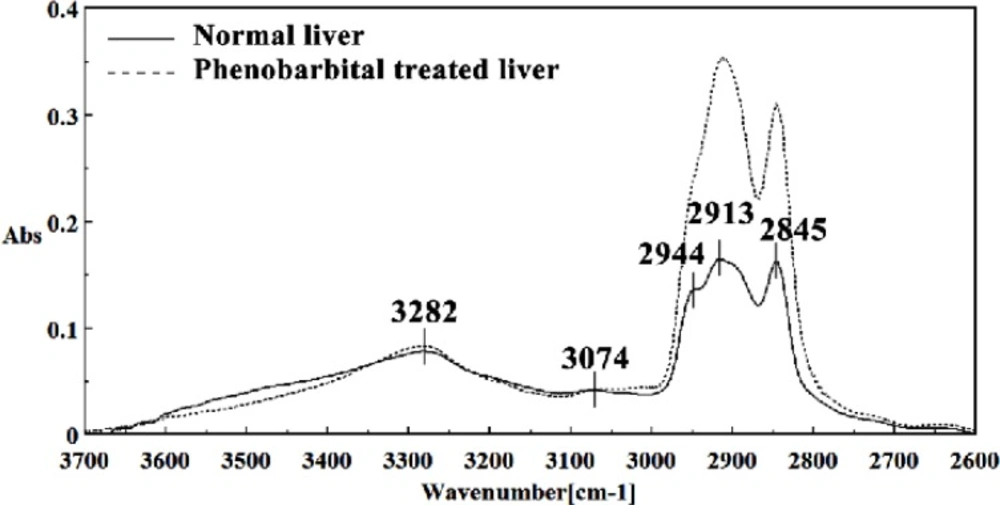
Mid-infrared spectra of normal (solid line) and phenobarbital treated (dot line) liver sections in the 3700–2600 cm-1 wave number region. The spectra are baseline-corrected and normalized.
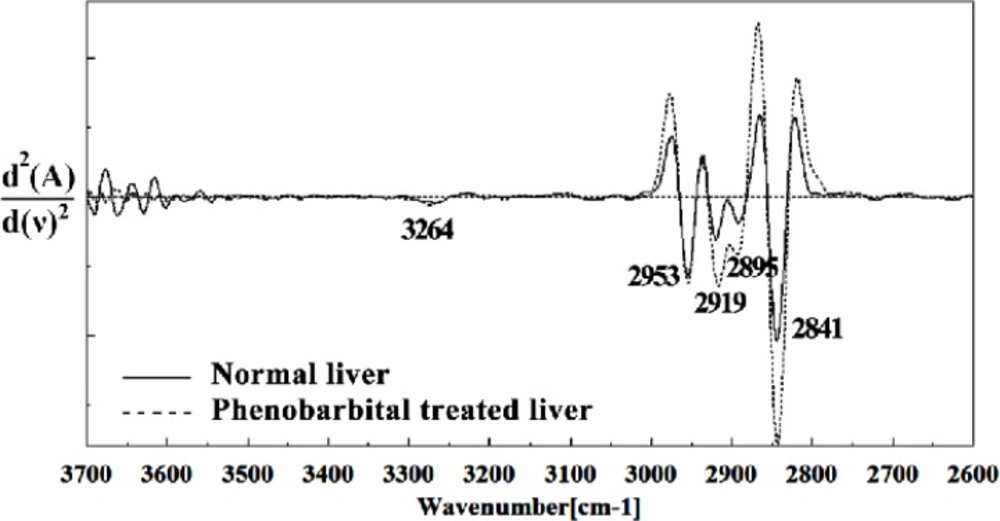
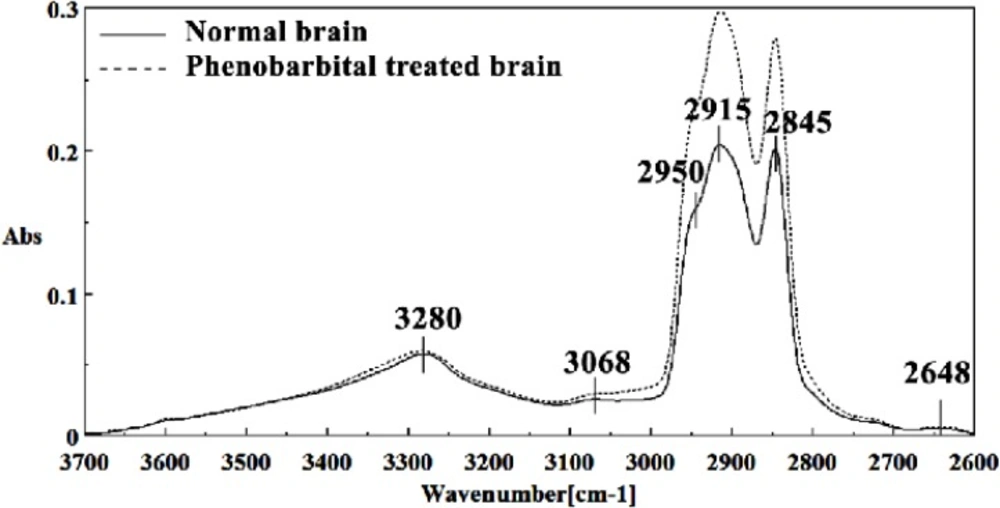
The intensities of the absorption bands near 2944 cm-1 (stretching C-H), 2913 cm-1 and 2845 cm-1 (Stretching vibrations of CH2 and CH3 of phospholipids, cholesterol and creatine) in treated tissue were increased and shifted compared to the untreated tissue.
Second derivative of mean FTIR spectra of normal (solid line) and Phenobarbital treated (dot line) liver sections in the 1800–600 cm-1 wave number region. The spectra are baseline-corrected and normalized.
Second derivative of mean FTIR spectra of normal (solid line) and Phenobarbital treated (dot line) liver sections in the 3700–2600 cm-1 wave number region. The spectra are baseline-corrected and normalized.
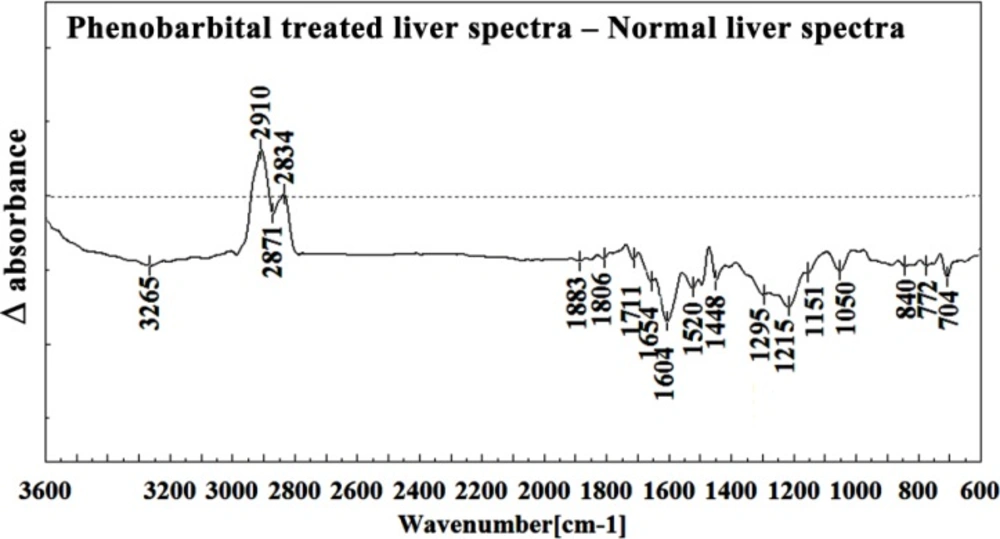
Difference FTIR spectra of Phenobarbital treated liver sections in the 3600–600 cm-1 wave number region minus the spectra of normal liver sections.
FTIR studies to determine compositional, structural and dynamical changes in phenobarbital treated fetus brain
Figures 8,
9,
10,
11 and
12 illustrated the typical IR spectra, 2
nd derivative and also the difference of brain tissues of mice fetus exposed to phenobarbital minus the control brain tissues.
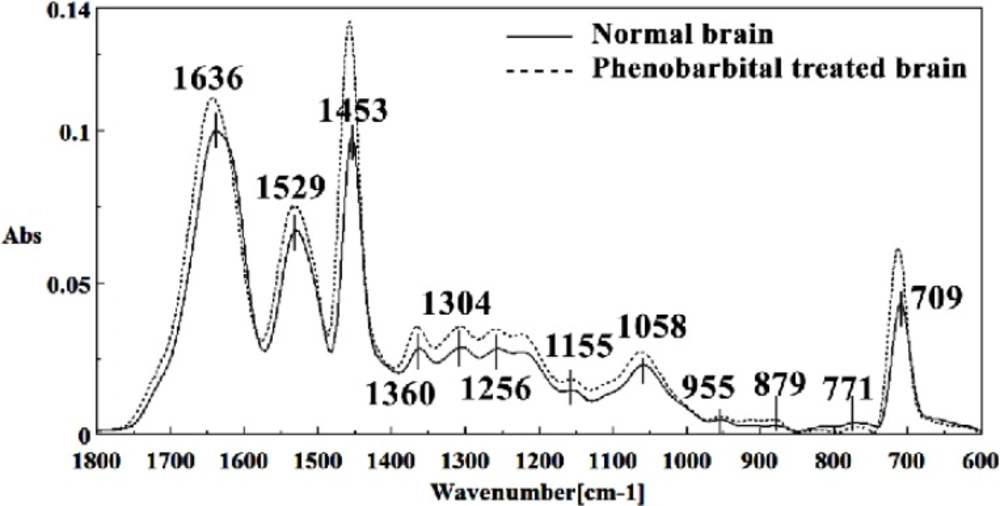
Mid-infrared spectra of normal (solid line) and phenobarbital treated (dot line) brain sections in the 1800–600 cm-1 wave number region. The spectra are baseline-corrected and normalized.
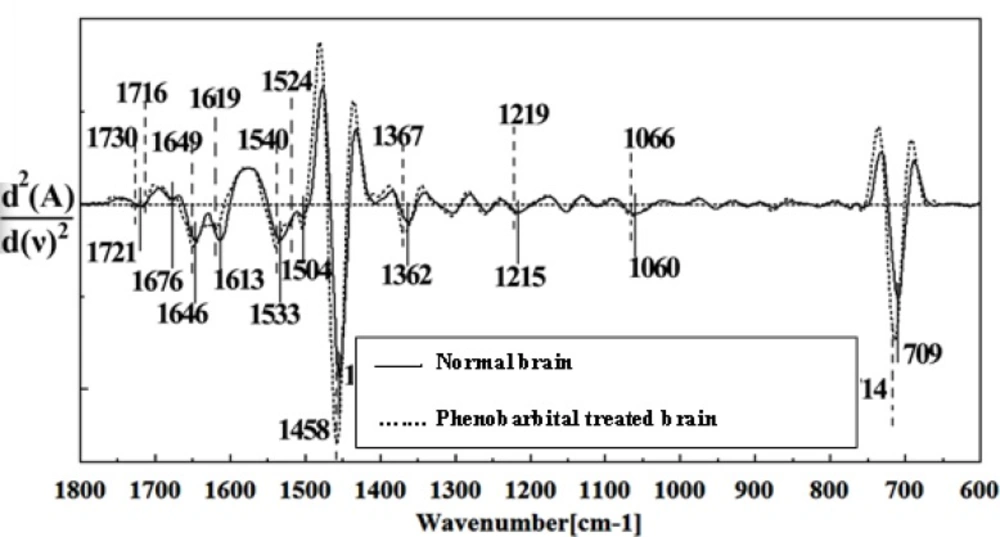
The intensity and frequency of the amide I band at around 1636cm-1 in treated tissue were increased and shifted compared to untreated tissue, mainly owing to the β-sheet structure of amide I. Also this band was converted to two bands in treated tissue. Moreover, the intensity and frequency of the amide II bands at around 1453 cm-1 and 1529 cm-1 in treated tissue were increased and shifted compared to untreated tissue, mainly owing to Asymmetric methyl deformation and C=N adenine, cytosine, respectively. The intensity and frequency of the bands at around 1360 cm-1, 1304 cm-1, 1256 cm-1 and 1223 cm-1 in treated tissue were increased and shifted compared to untreated tissue, mainly owing to Stretching C-O, deformation C-H,deformation N-H (1360 cm-1), Amide III(1304 cm-1) PO-2 asymmetric (phosphate I) (1256 cm-1) and PO2- asymmetric (phosphate I) (1223 cm-1). The intensity of the absorption band at around 1058 cm-1 due to 2-Methylmannoside, Oligosaccharide C-OH stretching band and Mannose & mannose-6-phosphate in treated tissue was gradually increased and shifted.
The absorption band in treated tissue at 911 cm-1 was increased and shifted owing to the Phosphodiester stretching bands region (for absorbance due to collagen and glycogen). The absorption band at around 955 cm-1 in treated tissue resulted from Symmetric stretching vibration of v1 PO43- (phosphate of HA), and the intensity was increased and shifted compared to untreated tissue. The intensity of C3´ endo/anti (A-form helix) conformation at 879 cm-1 was increased and shifted and the intensity of the ring CH deformation at 810 cm-1 in treated tissue was reduced and shifted. The absorption band at around 771 cm-1 in treated tissue resulted from Guanine in a C3´ endo/syn conformation in the Z conformation of DNA was reduced in treated fetus. The absorption bands at around 709 cm-1 owing to the Out-of-plane bending vibrations was increased and shifted in treated fetus. A band at 1155 cm-1 in treated tissue, corresponding to the C-O stretching vibration was increased and shifted.
Mid-infrared spectra of normal (solid line) and phenobarbital treated (dot line) brain sections in the 3700–2600 cm-1 wave number region. The spectra are baseline-corrected and normalized.
Second derivative of mean FTIR spectra of normal (solid line) and Phenobarbital- treated (dot line) brain sections in the 1800–600 cm-1 wave number region.
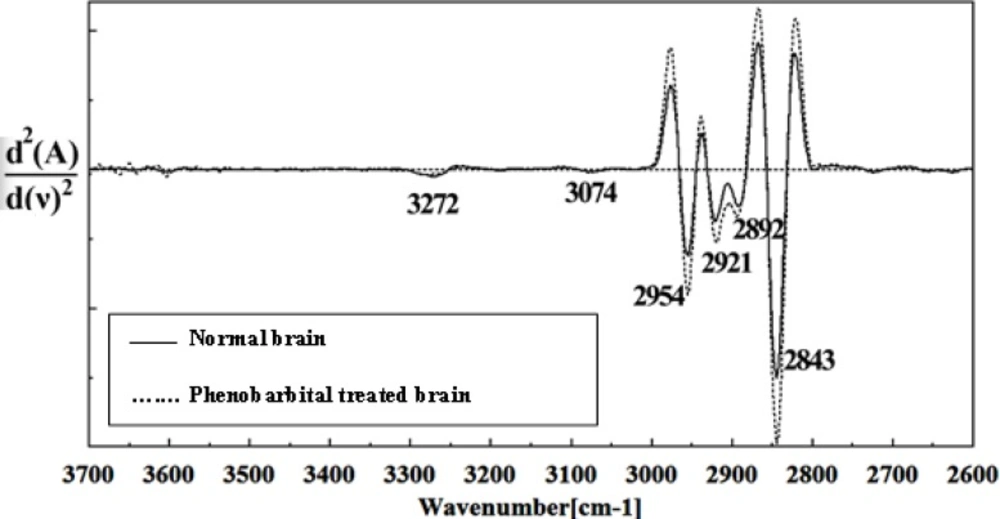
Second derivative of mean FTIR spectra of normal (solid line) and Phenobarbital- treated (dot line) brain sections in the 3700–2600 cm-1 wave number region.
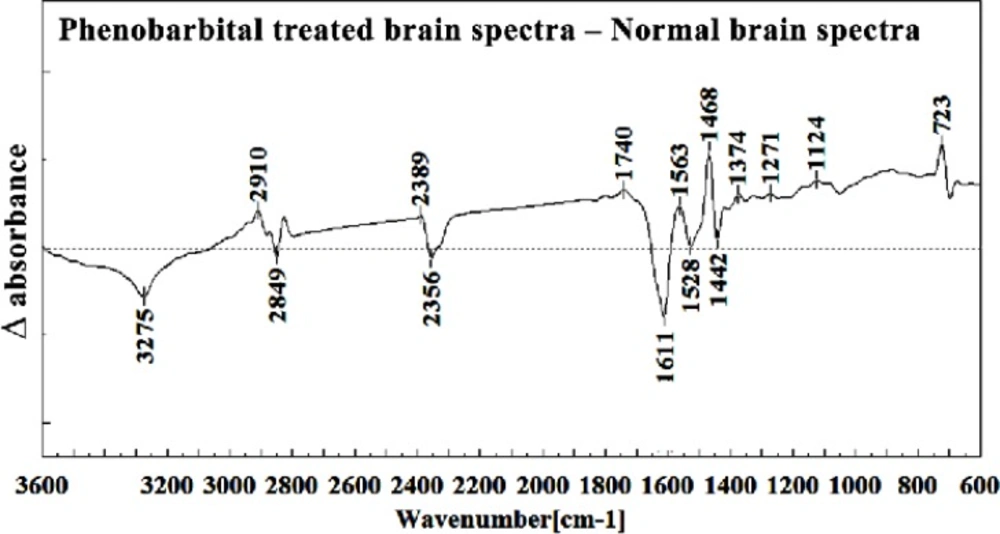
Difference of FTIR spectra of Phenobarbital treated brain sections in the 3600–600 cm-1 wave number region from normal brain sections