
Introduction
Malaria is a parasitic disease which is caused in human mainly by five species of Plasmodium, called P. falciparum,P. vivax, P. malariae, P. ovale spp., and P. knowlesi (1). Almost all species of human malaria parasites have a similar life cycle consists of sexual phase of multiplications, which occurs in specific species of Anopheline mosquitoes and an asexual phase of multiplications (schizogony) which take places in blood cells of the vertebrate host which might follow with invasion to the liver cells (2).
Malaria estimated annual incidence rate is about 219 million people worldwide and still considered as one of the most important public health problems especially in children of the poorest parts of the world. Currently, more than 40% of the world’s population are at risk of malaria and the annual mortality is about 1 million (3). Although more than 50 years ago the worldwide malaria eradication program was endorsed but yet high mortality and morbidity caused by malaria especially P. falciparum (WHO: World Malaria Report, 2013), studies in different aspects of the disease are highly encouraged. Every available approach should be used to design safe and effective anti-malaria drugs (4-6).
Regardless of global efforts to develop an effective vaccine against malaria and valuable publications yet no vaccine is available against malaria (7, 8).
Current epidemiological and treatment situations of malaria urge to use different approaches to develop new tools for malaria treatment (9). The rate of drug resistance in malaria is high (3), drug resistance in malaria defined as when the parasite survive or multiply, regardless of administration of enough dose of the drug which is absorbed (WHO technical report series, 1965). The speed of development of new anti-malaria drugs should be faster than rapid spread of drug resistance. In drug development it should be considered that each stage of malaria life cycle shows susceptibility to a specific anti-malaria drug so development of several drugs might be needed to control the disease (10).
Quantitative Structure Activity Relationship (QSAR) and Quantitative Structure Toxicity Relationship (QSTR) models are mathematical equations relating the chemical structure of a substance to the biological activity and toxicity, respectively (11-21). The current QSAR models are developed based on the resistant malarial strains TM90-C2B (chloroquine, mefloquine, pyrimethamine, and atovaquone resistant) and for cytotoxicity against J774 mammalian of a set of 28, quinolone derivatives which have already synthesized (22). To select the set of descriptors that are more relevant to EC50 of the desired compounds, MLR models were built and QSAR and QSTR equations with stepwise selection and elimination of variables were established using SPSS and Matlab software.
Experimental
QSAR and QSTR equations
The biological data used in this study were anti-malaria activities (EC50), and cytotoxicity of 28 quinolone derivatives against multidrug resistant p. falciparum (TM90-C2B) and J774 mammalian, respectively (21).
As reported previously structures of desired compounds 1 to 28 (Table 1) were built and optimized using HyperChem software (version 7, Hypercube Inc.) (11-15). A large number of molecular descriptors were calculated using HyperChem (Table 2) and Dragon software (23, 24). Dragon software was used to calculate different functional groups, topological, geometrical, and constitutional descriptors for each molecule. The calculated descriptors were collected in a data matrix wherein the number of rows and columns were the number of molecules and descriptors, respectively. Some of the chemical parameters including molecular volume (V), molecular surface area (SA approx), surface area (SA grid) hydrophobicity (LogP), hydration energy (HE), refractivity (Rf), molecular polarizability (MP) and different quantum chemical descriptors including dipole moment (DM) and the highest occupied molecular orbital (HOMO) energies are shown in Table 2.
Briefly, after removing the constant or near-constant descriptors to decrease the redundancy existed in the descriptor data matrix, the correlation of descriptors with each other and with the activity and cytotoxicity (pEC50) of the molecules were examined and collinear descriptors (i.e. r>0.9) were detected. Among the collinear descriptors, the one which shows the highest correlation with activity or cytotoxicity was retained and the others were removed from the data matrix. To select the set of descriptors that were most relevant to the anti-malaria activities (pEC50) and cytotoxicity, MLR models were built and the QSAR equations with stepwise selection and elimination of variables were established using MLR method (25). SPSS (version 18) and Matlab (version 7.6.0, R2008a) software were used for MLR regression method (11-16).
In the case of each regression problem, SPSS produced many models and were ranked based on standard error of calibration and coefficient of multiple determinations, wherein some models had a large number of input variables and thus they were over-fitted. To hinder obtaining over-fitted models, the generated QSAR and QSTR models were validated by the leave-one out cross-validation procedure to check the predictability and robustness. A balance between the high cross-validation correlation coefficient and low number of descriptors were used as the criterion for model selection. The overall prediction abilities of the final models were assessed by using a prediction set containing about 25% of the original molecules. To do so, the data set of activity was randomly classified to calibrate and predict the sets. The model coefficients were calculated using calibration data and then were used to calculate the anti-malaria activities of the molecules in the prediction set.
| Compound | surface area(approx) | Surface area(grid) | volume | hydration energy | log p | refractivity | polarizability | dipolemoment | homoa |
|---|---|---|---|---|---|---|---|---|---|
| 1 | 637.07 | 685.75 | 1152.78 | -5.72 | 3.75 | 109.05 | 42.11 | 5.62 | -8.78 |
| 2 | 396.06 | 426.22 | 680.98 | -4.82 | 1 | 64.46 | 24.52 | 5.99 | -8.77 |
| 3 | 604.95 | 661 | 1104.66 | -5.19 | 3.73 | 105.21 | 40.19 | 4.83 | -8.59 |
| 4 | 655.37 | 701.42 | 1195.12 | -4.02 | 4.4 | 114.17 | 43.86 | 4.54 | -8.49 |
| 5 | 558.7 | 617.37 | 1030.75 | -6.36 | 3.26 | 100.13 | 38.45 | 5.12 | -8.53 |
| 6 | 559.69 | 618.08 | 1038.63 | -5.65 | 3.21 | 100.37 | 38.35 | 4.50 | -8.46 |
| 7 | 567.72 | 625.52 | 1058.52 | -7.67 | 2.49 | 101.79 | 38.99 | 5.43 | -8.32 |
| 8 | 467.8 | 492.18 | 804.34 | -3.95 | 1.85 | 75.43 | 28.79 | 6.72 | -8.49 |
| 9 | 501.99 | 522.28 | 860.37 | -8.9 | 1.25 | 80.74 | 30.62 | 7.21 | -8.50 |
| 10 | 685.09 | 701.64 | 1184.64 | -3.18 | 2.75 | 108.96 | 41.8 | 4.75 | -8.53 |
| 11 | 526.28 | 586.18 | 996.12 | -3.42 | 1.28 | 96.67 | 36.7 | 6.69 | -8.49 |
| 12 | 566.98 | 559.29 | 925.33 | -1.81 | 1.62 | 87.6 | 33.17 | 6.1 | -8.47 |
| 13 | 565.79 | 623.43 | 1047.37 | -6.24 | 3.54 | 102.95 | 39.14 | 5.13 | -8.66 |
| 14 | 622.7 | 724.29 | 1261.99 | -2.88 | 3.63 | 129.01 | 48.91 | 6.65 | -8.48 |
| 15 | 528.2 | 595.95 | 989.94 | -7.03 | 2.74 | 95.33 | 36.52 | 4.65 | -8.56 |
| 16 | 668.81 | 760.73 | 1303.62 | -6.27 | 5.22 | 129.66 | 49.85 | 4.63 | -8.47 |
| 17 | 656.24 | 754.64 | 1289.86 | -7.81 | 4.84 | 127.44 | 49.14 | 6.38 | -8.66 |
| 18 | 656.41 | 753.56 | 1292.28 | -7.71 | 4.84 | 127.44 | 49.14 | 6.00 | -8.6 |
| 19 | 731.13 | 804.68 | 1381.12 | -5.7 | 6.1 | 135.64 | 51.41 | 7.57 | -8.72 |
| 20 | 745.17 | 826.25 | 1407.73 | -7.76 | 6.9 | 137.24 | 52.05 | 6.54 | -8.61 |
| 21 | 782.61 | 885.75 | 1550.89 | -9.31 | 6.79 | 156.12 | 60.06 | 5.84 | -8.55 |
| 22 | 885.15 | 988.68 | 1707.67 | -10.05 | 8.43 | 168.31 | 64.18 | 5.87 | -8.56 |
| 23 | 864.51 | 974.07 | 1697.37 | -10.26 | 8.8 | 168.52 | 64.18 | 5.51 | -8.59 |
| 24 | 748.7 | 828.23 | 1430.31 | -5.03 | 6.57 | 140.68 | 53.25 | 7.41 | -8.79 |
| 25 | 731.04 | 814.43 | 1400.7 | -4.35 | 6.16 | 139.75 | 53.52 | 4.39 | -8.55 |
| 26 | 735.48 | 815.64 | 1393.25 | -5.51 | 6.24 | 135.85 | 51.32 | 7.15 | -8.78 |
| 27 | 724.51 | 808.52 | 1391.1 | -5.15 | 6.21 | 139.51 | 53.61 | 5.39 | -8.64 |
| 28 | 683.76 | 773.38 | 1333.12 | -9.05 | 3.83 | 131.6 | 49.97 | 6.73 | -8.67 |
highest occupied molecular orbital.
Results and Discussion
QSAR equation
Based on the procedure explained in the Materials and Methods section, using a stepwise multiple linear regression method, the following five-parametric equation 1 (Equation 1) was derived for quinolones 1 to 28.
In the QSAR and QSTR equations, n is the number of data points, R2 is the correlation coefficient, S is the standard deviation, F is the Fisher’s F-value and q2 is the leave-one-out (LOO) cross validated coefficient that was obtained by a multiple linear regression.
The anti-malaria activities of the quinolone derivatives were tested against multidrug resistant P. falciparum (TM90-C2B). Herewith, we explain QSAR model for anti-malaria activity against TM90-C2B and cytotoxicity against the J774 mammalian in equations 1 and 2, respectively.
Equation (1):
pEC50= (-18.1 ± 9.02) – (8.8 ± 1.7) PJI2 – (12.99 ± 8.18) Mv + (29.6 ± 3.58) PCR – (0.68 ± 0.11) nBM + (0.03 ± 0.006) VAR
n=28, F=33.157, R2=0.92, S=0.89, p<0.000, q2=0.71
Equation 1 explains 92% of the variance in pEC50 data wherein the relative error prediction (REP) of the equation is shown in Table 5. This equation describes the effect of PJI2, Mv, PCR, nBM and VAR indices on the anti TM90-c2B activity. The PJI2 and VAR are among topological descriptors and Mv and nBM are among constitutional descriptors. PCR is among walk and path counts descriptor that show ratio of multiple path count over path count.
Equation 1 indicates that PCR and VAR demonstrate positive contribution and PJI2, Mv, and nBM show a negative contribution towards the anti-malaria activities. Comparison of the coefficient of descriptors reveals that anti-malaria (TM90-c2B) activities might be affected mainly by PCR, Mv, and PJI2 with 29.6, 12.99 and 8.8 values, respectively. The calculated pEC50 using equation 1 is presented in Table 3 and the graphical representation of cross validated calculated activity and the experimental values using equation 1 are presented in Figure 1. The correlation coefficient matrix for the descriptors that were used in the MLR equation 1 is shown in Table 4. Based on the equation 1, in order to design a new ligand with high potency, substitutions with high amount of PCR and low amounts of Mv and PJI2 should be considered.
| Number | apEC50 Exp. | bpEC50 Calc | c|REP| |
|---|---|---|---|
| 1 | 3.9208 | 3.86037 | 0.0157 |
| 2 | 1.1163 | 1.41986 | 0.2138 |
| 3 | 2.3556 | 4.94160 | 0.5233 |
| 4 | 4.8239 | 4.59390 | 0.0500 |
| 5 | 2.1421 | 2.19951 | 0.0261 |
| 6 | 2.5575 | 2.45931 | 0.0399 |
| 7 | 2.70996 | 3.33258 | 0.1868 |
| 8 | 2.0985 | 2.30913 | 0.0912 |
| 9 | 1.1101 | 1.36155 | 0.1846 |
| 10 | 0.2125 | 0.43881 | 0.5156 |
| 11 | 1.1391 | 1.11276 | 0.0236 |
| 12 | 1.21896 | 0.83808 | 0.4545 |
| 13 | 2.3615 | 2.06961 | 0.1410 |
| 14 | 2.0376 | 1.4404 | 0.4146 |
| 15 | 2.1469 | 1.56789 | 0.3693 |
| 16 | 1.1169 | 1.19209 | 0.0631 |
| 17 | 0.9931 | 1.19209 | 0.1669 |
| 18 | 1.2306 | 1.19209 | 0.0323 |
| 19 | 0.6108 | 0.6373 | 0.0415 |
| 20 | 0.6003 | 0.3849 | 0.5597 |
| 21 | 0.9991 | 1.23954 | 0.1939 |
| 22 | 0.3925 | 1.16511 | 0.6631 |
| 23 | 1.3233 | 1.48233 | 0.1073 |
| 24 | 1.8539 | 1.95589 | 0.0522 |
| 25 | 0.7878 | 1.27179 | 0.3805 |
| 26 | 2.5100 | 1.82599 | 0.3746 |
| 27 | 1.2660 | 1.14189 | 0.1087 |
| 28 | 1.8928 | 0.528 | 2.5848 |
The experimentally activity (pEC50) in TM90-C2B.
The calculated pEC50 using multi linear regression equation 1.
The absolute value of Percent of the relative error of prediction.
| Correlations | |||||||
|---|---|---|---|---|---|---|---|
| pEC50 | PJI2 | Mv | PCR | nBM | VAR | ||
| Pearson Correlation | pEC50 | 1.000 | -0.514 | -0.209 | 0.183 | -0.226 | -0.290 |
| PJI2 | -0.514 | 1.000 | -0.377 | -0.135 | 0.140 | 0.305 | |
| Mv | -0.209 | -0.377 | 1.000 | 0.367 | 0.405 | 0.236 | |
| PCR | 0.183 | -0.135 | 0.367 | 1.000 | 0.833 | 0.649 | |
| nBM | -0.226 | 0.140 | 0.405 | 0.833 | 1.000 | 0.935 | |
| VAR | -0.290 | 0.305 | 0.236 | 0.649 | 0.935 | 1.000 | |
| Sig. (1-tailed) | pEC50 | . | 0.003 | 0.143 | 0.176 | 0.123 | 0.067 |
| PJI2 | 0.003 | . | 0.024 | 0.247 | 0.239 | 0.057 | |
| Mv | 0.143 | 0.024 | . | 0.027 | 0.016 | 0.113 | |
| PCR | 0.176 | 0.247 | 0.027 | . | 0.000 | 0.000 | |
| nBM | 0.123 | 0.239 | 0.016 | 0.000 | . | 0.000 | |
| VAR | 0.067 | 0.057 | 0.113 | 0.000 | 0.000 | . | |
| N | pEC50 | 28 | 28 | 28 | 28 | 28 | 28 |
| PJI2 | 28 | 28 | 28 | 28 | 28 | 28 | |
| Mv | 28 | 28 | 28 | 28 | 28 | 28 | |
| PCR | 28 | 28 | 28 | 28 | 28 | 28 | |
| nBM | 28 | 28 | 28 | 28 | 28 | 28 | |
| VAR | 28 | 28 | 28 | 28 | 28 | 28 | |
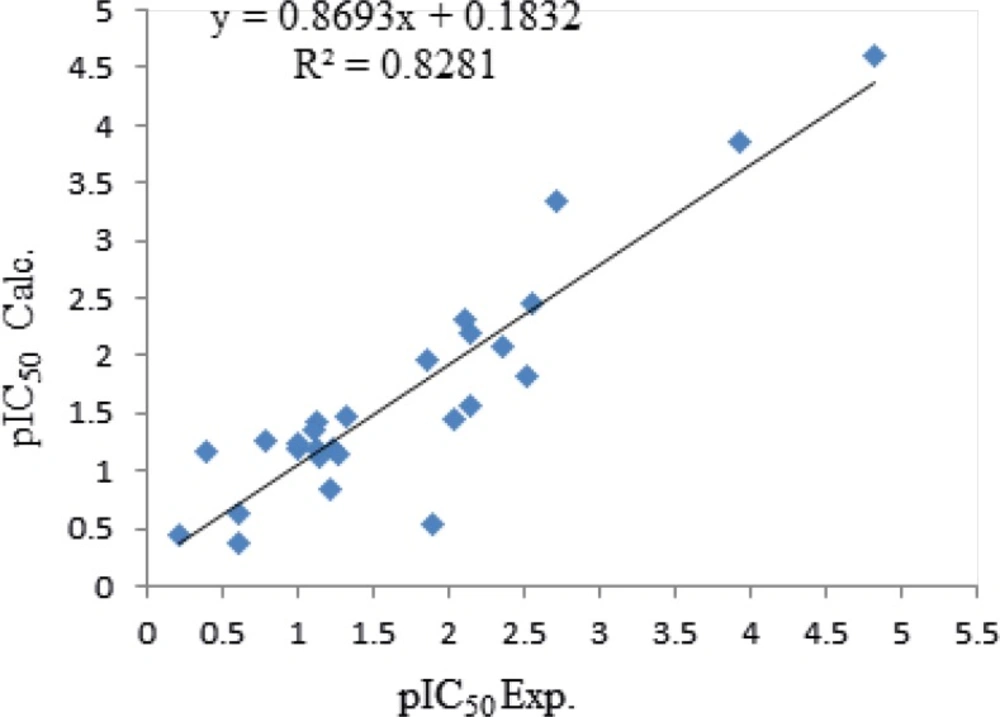
Plot of cross-validated calculated activity of TM90-C2B obtained by QSAR equation 1.
QSTR equation
Based on the procedure explained in the Materials and Methods section, using a stepwise multiple linear regression method, the following three-parametric equation 2 was derived for quinolones 1 to 28.
Equation (2):
pEC50= (-7.35± 0.657) + (22.5 ± 1.46) MSD + (0.815 ± 0.085) MAXDP – (0.097 ± 0.014) X1sol
n=18, F=81.14, R2=0.96, S=0.049, p<0.000, q2=0.812
Equation 2 explains 96% of the variance in pEC50 data which describes the effect of MSD, MAXDP and X1sol indices on cytotoxicity. MSD and MAXDP are among topological descriptors and X1sol is among connectivity indices. The relative error prediction (REP) of the equation 2 is shown in Table 5.
Equation 2 indicates that MSD and MAXDP demonstrate positive contribution and X1sol show a negative contribution towards the cytotoxicity which all descriptors have positive concept, so comparison of the coefficient of descriptors reveals that which cytotoxicity might be affected mainly by MSD. The calculated pEC50 using equation 2 is presented in Table 5 and the graphical representation of cross validated calculated activities and the experimental values using equation 2 are presented in Figure 2. The correlation coefficient matrix for the descriptors that were used in the MLR equation 2 is shown in Table 6. Based on this equation in order to have a new ligand with low cytotoxicity, some substitution with low amounts of MSD properties should be considered.
| Number | apEC50 Exp. | bpEC50 Calc. | c|REP| |
|---|---|---|---|
| 1 | 1.337242 | 1.729347 | 0.226736 |
| 2 | 1.431798 | 1.490277 | 0.039240 |
| 3 | 1.552842 | 1.741733 | 0.108450 |
| 4 | 3 | 1.736874 | 0.727241 |
| 5 | 1.721246 | 1.637286 | 0.051280 |
| 6 | 2.397940 | 2.237676 | 0.071621 |
| 7 | 1.638272 | 1.680007 | 0.024842 |
| 8 | 1.638272 | 1.675107 | 0.021989 |
| 9 | 1.638272 | 1.673392 | 0.020987 |
| 10 | 1.698970 | 1.645639 | 0.032407 |
| 11 | 1.698970 | 1.705242 | 0.003678 |
| 12 | 1.721246 | 1.812865 | 0.050538 |
| 13 | 1.795880 | 1.975504 | 0.090926 |
| 14 | 1.795880 | 1.811327 | 0.008528 |
| 15 | 1.698970 | 1.584743 | 0.072079 |
| 16 | 1.657577 | 1.640181 | 0.010606 |
| 17 | 1.721246 | 1.612183 | 0.067649 |
| 18 | 1.657577 | 1.5981 | 0.037217 |
The experimentally cytotoxicity pEC50 in J774.
The calculated pEC50 using multi linear regression equation 2.
The absolute value of Percent of the relative error of prediction.
| Correlations | |||||
|---|---|---|---|---|---|
| pEC50 | MSD | MAXDP | X1sol | ||
| Pearson Correlation | pEC50 | 1.000 | 0.379 | -0.068 | -0.043 |
| MSD | 0.379 | 1.000 | -0.686 | -0.484 | |
| MAXDP | -0.068 | -0.686 | 1.000 | 0.931 | |
| X1sol | -0.043 | -0.484 | 0.931 | 1.000 | |
| Sig. (1-tailed) | pEC50 | . | 0.060 | 0.394 | 0.432 |
| MSD | 0.060 | . | 0.001 | 0.021 | |
| MAXDP | 0.394 | 0.001 | . | 0.000 | |
| X1sol | 0.432 | 0.021 | 0.000 | . | |
| N | pEC50 | 18 | 18 | 18 | 18 |
| MSD | 18 | 18 | 18 | 18 | |
| MAXDP | 18 | 18 | 18 | 18 | |
| X1sol | 18 | 18 | 18 | 18 | |
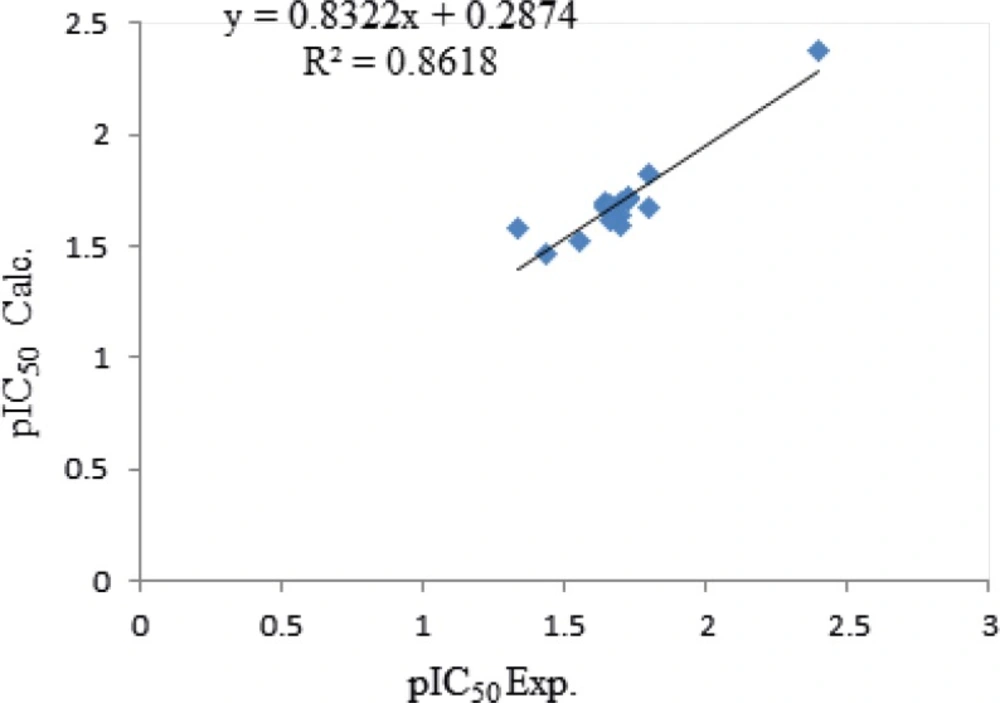
Plot of cross-validated calculated activity of Cytotoxicity obtained by QSTR equation 2.
Conclusion
Twenty eight analogs of quinolone with anti-malaria activities were subjected to QSAR and QSTR studies in order to design new ligands with an improved therapeutic index. Based on our QSAR and QSTR equations (Equations 1 and 2) PJI2, Mv, PCR, nBM, and VAR can effect on anti-malaria activity and MSD, MAXDP, and X1sol can effect on cytotoxicity. Our QSAR and QSTR calculations reveals in order to increase the therapeutic index of the series of anti-malaria compounds, some moieties with high amount of PCR and low amounts of Mv, PJI2, and MSD should be considered in the lead compounds.
