Materials
We purchased 1, 2-dipalmitoyl-sn-glycero-3-phosphocholine (DPPC, purity 95%) from Lipoid (Lipoid KG, Germany). The lipid composition of DPPC has been identified using the gas chromatography (GC). DHA (purity 99.0%), EPA (purity 99.0%), phosphate buffer solution, sephadex G-50 and 2, 5-dimethylfuran was prepared from Sigma Chemical Co. (St. Louis, MO, USA). The purity of DHA and EPA was verified by nuclear magnetic resonance (NMR). Polycarbonate membranes were obtained from Whatman (Maidstone, UK). Propanal, pentanal, hexanal, heptanal, n-dodecane (purity 99%), boron trifluoride 12% (BF3), pentadecanoic acid, and all other chemicals used were of analytical grade and purchased from Merck (Chemical Co. Darmstadt, Germany).
Preparation of liposomes
Multilamellar vesicles (MLV) were prepared using the conventional film method (
18). A known amount of DPPC (25.7 mg mL
-1) was dissolved in chloroform and methanol (at the ratio of 2: 1) and deposited as a thin film in a round-bottom flask by rotary evaporation under reduced pressure at 50 ºC above the DPPC transition temperature (Tc) is about 42 ºC. The residual traces of solvents were removed by a further evaporation under N
2 stream. The resulting dried lipid film was hydrated for about 2 h by addition of phosphate buffer (0.05 M, pH 7.4) and glass beads (5 g) with mild agitation at 50 ºC. These MLVs were extruded through polycarbonate membranes with defined pore size or sonicated to get uncharged liposomes of the preferred size.
Extrusion
The MLVs were three times prefiltrated through a membrane with 0.2 µm pores size using discontinuous extruder (Liposo-Fast™ Avestin Inc., Ottawa, Canada). To allow the formation of smaller vesicles (~100-110 nm), this was followed by extrusions through double stacked membranes with 100-nm pores. The procedure was repeated three times at low extrusion pressure (200 psi). During all the extrusions, the temperature was maintained at least 10 ºC above the glass transition temperature of the DPPC (
20).
Sonication
The MLV dispersion is placed in a glass vial and sonicated by bath, probe, or combined bath and probe methods. In method 2, MLV suspension was sonicated for 20 min in a bath-type sonicator in the continuous mode at 37 ºC (Tecno-Gaz; Tecna3 S.P.A, Bologna, Italy). In method 3, MLV dispersion was sonicated using a 20-kHz low-frequency ultrasonic processor (Hielscher UP200H, Germany). The ultrasonic titanium probe (7-mm diameter) was immersed in a glass vial, containing 5 mL of liposomes dispersion, at 20 mm of depth (diameter 18 mm and height 70 mm). A pulsed duty cycle of 6s on, 4s off was used with power delivery 30% for 10 min by section of 5 min. The sample vial was kept in a temperature-controlled water bath and its temperature was monitored throughout the experiment to prevent heat damage (4 ºC). Both probe and bath sonication procedures were carried out in the same way as the previous methods. The suspension prepared was sonicated in bath sonicator for 10 min and subsequent by probe for 30 min (
21,
22).
EPA and DHA loading
EPA and DHA were dissolved in ethanol to the final concentrations of 10 and 5 mmol L
-1, respectively. For loading two separate solutions of EPA and DHA, after drying under a stream of N
2, omega-3 FAs were added to the suspension of liposomes. The total concentration of phospholipid and free FAs were kept constant; 35 and 15 mmol L
-1, respectively. In the extrusion method, EPA and DHA loaded in liposomes after hydration of dry thin lipid layer. After downsizing of MLVs by bath, probe, or combined bath and probe methods, omega-3 FAs loaded into pre-formed suspension of the liposomes, and then incubated at the ambient temperature for 2 hours. All prepared liposomes were refrigerated at 4 ºC for further analysis (
23).
Particle size and zeta potential measurement
The hydrodynamic diameter, size distribution (polydispersity index; PDI), and Zeta potential ofall liposome preparations were measured by the dynamic light scattering (Nano ZS Malvern Zeta Sizer model 1000HSa, UK) technique at 25 ºC, using a He-Ne laser of 633 nm and a detector angle of 173 ˚C. Three independent measurements were performed for each sample. The Malvern measures the time-dependent fluctuations of light scattered by the liposomes and uses it to calculate the average size and polydispersity of the liposomes. Samples were analyzed 24 h after preparation. Liposomes were appropriately diluted with the aqueous phase of the formulations prior to the measurements. The particle size values given are averages of three measurements and are expressed as mean Zeta potential (
24).
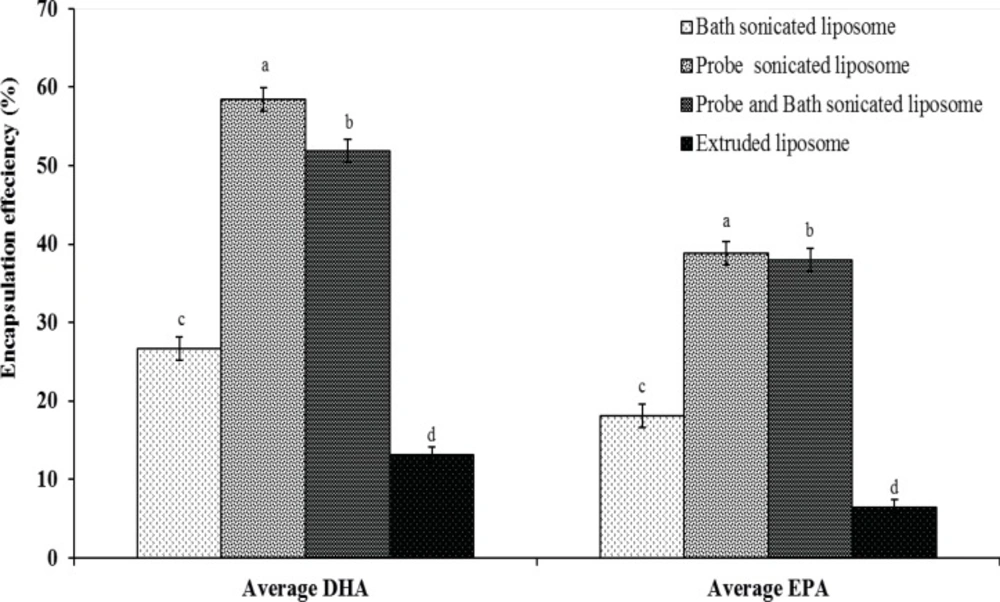
Determination of DHA and EPA encapsulation efficiency
EPA and DHA encapsulated in the bilayer DPPC were separated from free EPA and DHA on sephdex-G50 column. The filtration columns were prepared and packed. The gel column was prepared first by boiling about 1 g of sephdex-G50 fine powder in 20 mL of DI-water for an hour in a covered beaker. The gel was cooled to the room temperature and packed into 80% of the total column volume. Encapsulation efficiency of EPA and DHA were calculated indirectly using size exclusion chromatography method as described in the literature (25). Briefly, liposome suspensions/free EPA and DHA (1 mL) were eluted by phosphate buffer (pH 7.4) in a sephadex-G50 column (1.5 × 20 cm), and encapsulated EPA and DHA were separated from free fatty acids and then the vesicles of the eluate were collected from the first 15 mL. The concentration of entrapped EPA and DHA were determined by gas chromatography (GC). Encapsulation efficiency (EE) was calculated using the following formula (26):
Where C is the concentrations of entrapped EPA and DHA in the elute, and C0 is the initial amount of EPA and DHA used for preparing the liposomes.
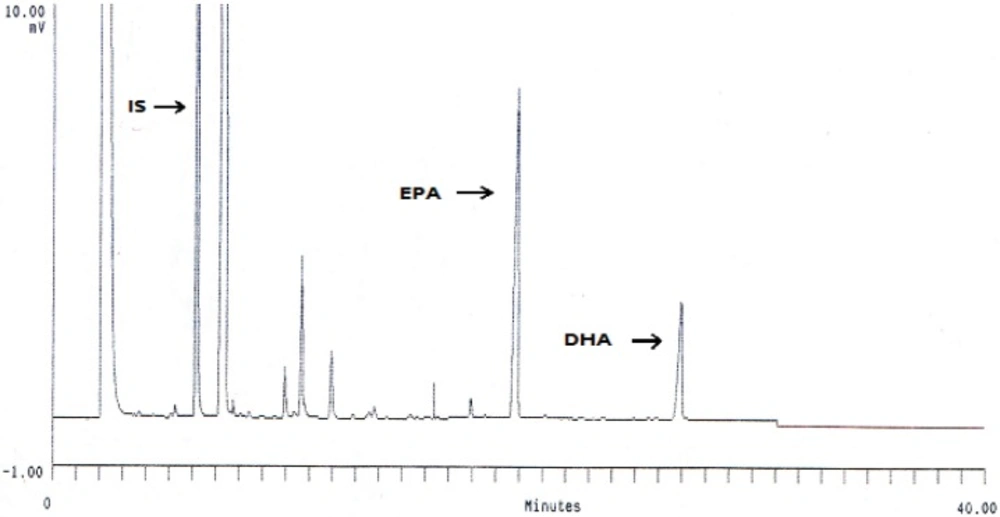
GC analysis of fatty acids
The total lipid was extracted according to Fölch
et al. (
27). Saponification and esterification was carried out according to the method provided by Metcalfe
et al. (
28). Then, 50 mg of extracted oil was saponified with 5 mL of methanolic NaOH (0.5 M) solution by refluxing 10 min at 90 °C. After cooling to room temperature, 2.2 mL 20% BF3–methanolic solution was added, the sample boiled for 3-5 min, again cooled to room temperature and then 1 mL of hexane followed by 1 mL of saturated NaCl solution were added with stirring after each addition. Sodium sulfate was added (1-2 g) and the mixture was shaken to remove the residual water. Finally the upper hexane layer containing the fatty acid methyl esters (FAMEs) was placed in mini-vials. After that, EPA and DHA concentrations were determined by gas chromatography (UNICAM 4600, SB Analytical, UK) equipped with a flame ionization detector (GC-FID) and a BPX-70 fused-silica capillary column (SGE, Melbourne, Australia, 0.22 µm film thickness, 30 m length, 0.25 mm
i.d.). The operating conditions were as follows: the initial temperature was 50 °C, increased by 5 °C min
-1 up to the 160 °C; and with a ramp of 20 °C min
-1 reached 180 °C and finally 200 °C. The injector and detector temperatures were 250 and 300 °C, respectively. The column head pressure (Helium) was 20 psi. Each FA was identified in its methyl ester form by comparing its retention time with the internal standard (pentadecanoic acid) as described by Sahari
et al. (
29).
Phosphorous assay
The amounts of phospholipids present in the liposomal formulations were determined using colorimetric method (
30). Twelve point calibration curves were prepared for DPPC and used for estimation of unknown concentration of lipids in vesicles obtained after each preparation methods. Briefly, 0.1 mL of the liposome suspension (approximately at a concentration of 0.1 mg mL
–1) was added to 1.9 mL of an aqueous 0.1 M ammonium ferrothiocyanate solution in a test tube. The resulting suspension was mixed with 2 mL of chloroform for 15 s using a vortex, and then centrifuged at 2000× g for 10 min. The upper layer was recovered and analyzed at 488 nm by a UV-vis spectrophotometer (CECIL, UK; model CE 2021).
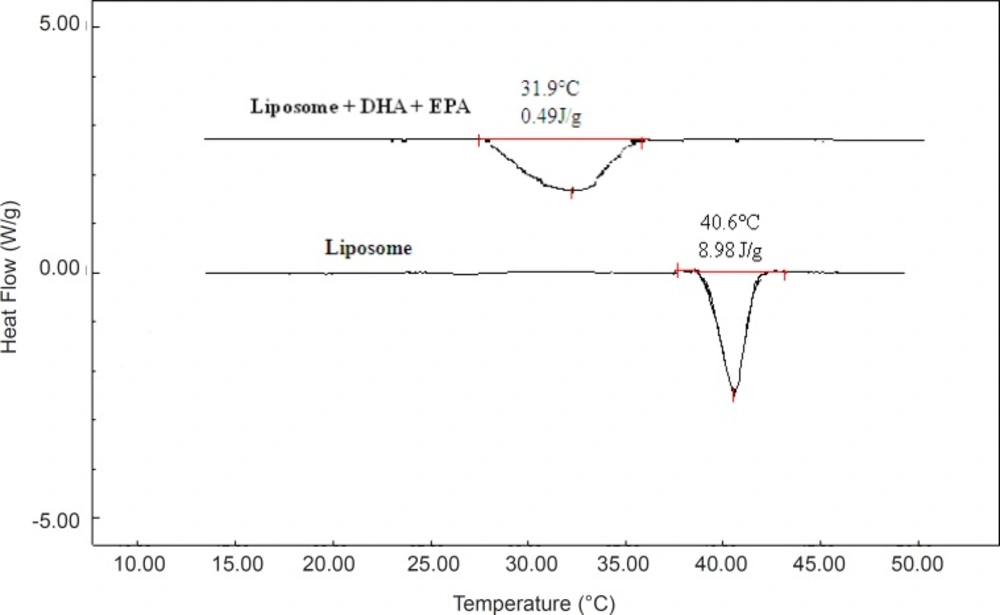
Differential scanning calorimetry
The possibility of any interaction between the omega-3 FAs and liposomes during preparation were assessed by thermal analysis of liposome samples including DPPC bilayer, DHA, and EPA alone as well as combined with each other using DSC (
31). A model DSC Shimadzu 60 (Shimadzu Scientific Instruments, Kyoto, Japan) was used to determine melting point and enthalpy for DPPC bilayer with both DHA and EPA or one of them alone. A sample equivalent to approximately 5 mg was placed in aluminum pan and DSC analysis was carried out at a nitrogen flow rate of 20 mL min
-1 and a heating rate of 5 °C min
-1 from -5 to 60 °C. An empty aluminum pan was placed on the reference platform. The thermal analysis of sample parameters in the DSC thermogram are the onset temperature (T
0), the peak temperature or the gel to liquid-crystalline transition (Tm), the endset temperature (Te and T
0), and enthalpy change of the transition (
31,
32).
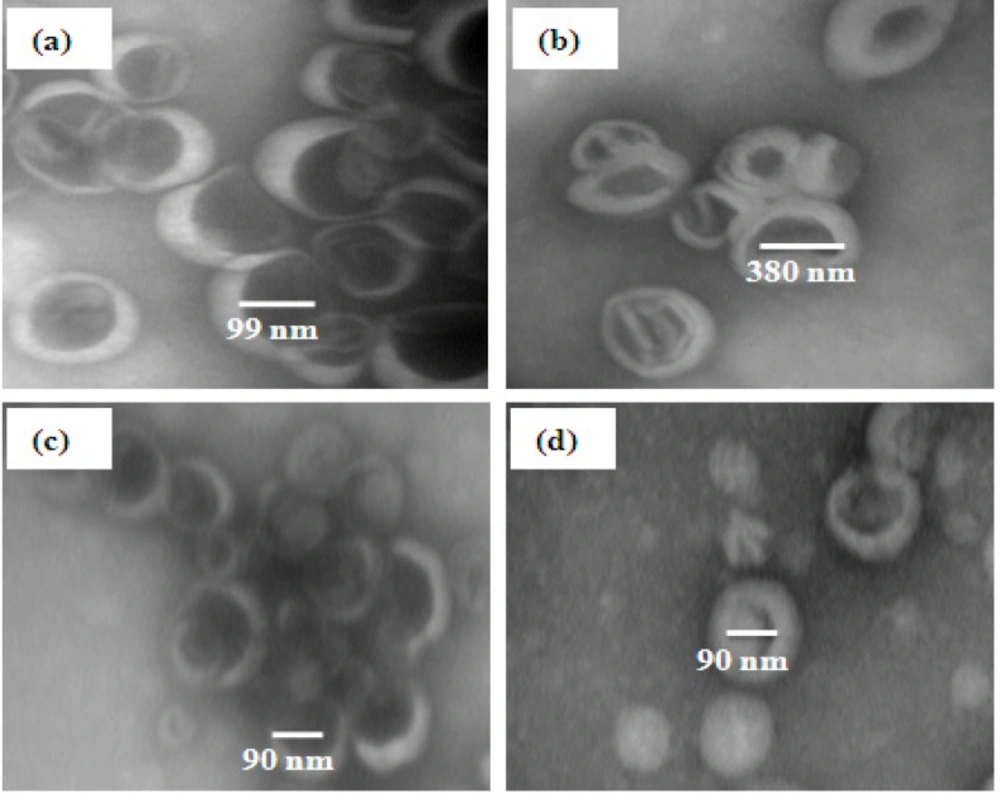
Transmission electron microscopy
EPA and DHA loaded in liposomes were visualized with negative staining transmission electron microscopy (Ziess, EM10, Germany). The liposome sample was diluted before analysis with phosphate buffer (about 0.05 mg mL
-1) and then was placed on a 200-mesh formvar copper grid, allowed to adsorb and the surplus was removed by a filter paper. A drop of 1% (w/v) aqueous solution of uranyl acetate was added and left in contact with the sample for 2 min (
33). The surplus water was removed and the sample was dried at the room conditions. TEM was performed at operating at an acceleration voltage of 80 KV and viewed under low-dose conditions.
Volatile compounds determination
Volatile compounds were analyzed by headspace liquid phase microextraction procedure (HS-LPME). The internal standard was methanolic solution of 2, 5-dimethylfuran. The extracting solvent was
n-dodecane, containing 10 mg L
-1 internal standard (IS). In a preliminary work, the variables of sample size, extraction temperature, and extraction time were assessed. Sample analysis was performed in different stages. Mixed standard solutions were diluted by double distilled water for preparing the mixing solution amount of each analyte (0.02- 200.00 ng mL
-1) and after injection to GC/MS their figure of merits were obtained (
Table 1).
| Analyte | Regression equation | R2 | RSD (%) | Recovery (%) | LOD (ng g-1) | LOQ (ng g-1) |
|---|
| Propanal | y=0.002x+0.174 | 0.998 | 3.60 | 98.23 | 0.008 | 0.024 |
| Pentanal | y=0.013x+0.2032 | 0.998 | 3.33 | 92.44 | 0.032 | 0.074 |
| Hexanal | y=0.043 x+2.122 | 0.992 | 4.14 | 99.53 | 0.009 | 0.032 |
| Heptanal | y=0.332 x+2.345 | 0.998 | 3.68 | 94.23 | 0.030 | 0.072 |
Liposome suspension (300 µL) along with 2 g sodium chloride and a micro-stirring bar were placed in a 17.0 mL glass vial sealed with an aluminum crimp cap with a needle pierceable polytetrafluoroethylene/silicon septum. The sample vial was placed into a 40 ºC water bath and stirred at a flow rate of 0.8 mL min
-1 allowing 10 min for the sample to equilibrate at 40 ºC. The needle of the liquid phase microextraction (LPME) device, containing 3 µL of the extracting solvent composed of
n-dodecane along with specified concentration of 2,5-dimethylfuran, was inserted into the vial through the septum, and the plunger of the LPME apparatus was pushed down to expose to the vial headspace. After 10 min, the plunger was retracted into the needle assembly, removed from the vial, and transferred to the injection port of the GC unit. GC/MS analysis was carried out using an Agilent technology 7890A gas chromatograph interfaced to an Agilent 5975C inner MSD mass spectrometer (30 m × 0.25 mm; film thickness 0.25 μm, J and W Scientific Agilent Technologies, USA) in EI mode at 70 eV, equipped with a HP-5MS capillary column (
34). The mass spectra were obtained in electron-impact mode (EI) at 70 eV and 280 ºC ion source temperature and with a scan range of 30-400 m/z. The oven temperature was set at 40 ºC (3 min as the holding time) and then raised to 280 °C at the rate of 20 ºC min
−1. Helium was used as the carrier gas at a flow rate of 0.8 mL min
-1. Three µL of the diluted volatile compounds was injected in the split mode (split ratio was 1:50) and the inlet temperature was held at 280 °C. Identification of volatile compounds in liposome samples were performed using the MSD ChemStation E.0100.237 software for Windows. Peak identification of the volatile compounds was carried out by comparison of the retention times and mass spectra of the eluting compounds to those of the Wiley library (Wiley Nist 05, J. Wiley and Sons Ltd., West Sussex, England).
Statistical analysis
The data are presented as mean ± SD of the results from nine independent experiments calculated using Microsoft Excel software (Microsoft, Redmond, WA, USA). Analysis of variance was done for statistical evaluation of the data. The significance of differences between mean values of the preparation methods was determined by the least-significant-difference (LSD) test using the Statistical Analysis System, version 9.1.3 (SAS Institute, Cary, North Carolina, USA). The acceptable probability for a significant difference between means was р < 0.05.
| Liposomes | Size (nm) | PDI | Zeta potential (mV) |
|---|
| Extruded | 99.7 ± 3.5b | 0.1 ± 0.03d | -42.4 ± 1.7c |
| Bath sonicatedProbe sonicated | 381.2 ± 7.8a90.1 ± 2.3c | 0.6 ± 0.03a0.14 ± 0.02c | -43.8 ± 2.4c-36.3 ±1.6b |
| Probe and bath sonicated | 87.1 ± 4.1c | 0.23 ± 0.02b | -31.6 ± 1.9a |