Chemical reagents
Dulbecco's modified Eagle medium (DMEM), fetal bovine serum, penicillin-streptomycin, 3-(4, 5-dimethylthiazol-2-yl)-2, 5-diphenyl tetrazolium bromid (MTT), and dihydrodichlorofluorescein (H2DCF-DA) were obtained from Sigma-Aldrich Co. (St. Louis, MO, USA). Dimethyl sulfoxide (DMSO), thiobarbituric acid (TBA), trichloroacetic acid (TCA) and pyrogallol were obtained from Tokyo Chemical Industry Co., LTD (Tokyo, Japan). All other reagents were analytical grade.
Plant extracts preparation
Fresh Lindera coreana leaves were purchased from a local market in Yangzhou, China in December 2011. The fresh Lindera coreana leaves were shade dried initially, freeze dried and then ground to a fine powder. A twelve-fold volume of ethanol (70%, v/v) was added to the powdered samples and extracted third by stirring overnight. Lindera coreana leaf ethanol extracts (LCE) were concentrated by heat evaporation and freeze-drying. LCE was redissolved in dimethyl sulfoxide (DMSO) at a concentration of 50 mg/mL, and stored at 4 °C until further study.
Cell culture and UVB irradiation
Human immortalized keratinocyte HaCaT cells were obtained from the China Center for Type Culture Collection (CCTCC, Wuhan, China). The cells were maintained in DMEM medium supplemented with 10% (v/v) fetal bovine serum (FBS) and 1% penicillin-streptomycinin in a humidified CO2 incubator (Model 3154, Forma Scientific Inc, Marietta, OH, USA) with 5% CO2 at 37 °C. When the cells were reached 90% confluence, they were washed twice with phosphate buffered saline (PBS) and then exposed to UVB for 2 h (20 mJ/cm2) with a UVB lamp (HP-30LM; Atto Co., Japan). To prevent light absorption by DMEM medium, the DMEM medium was removed just prior to irradiation and replaced with a thin layer of PBS to cover the cells. After irradiation, cells were fed with a DMEM growth medium.
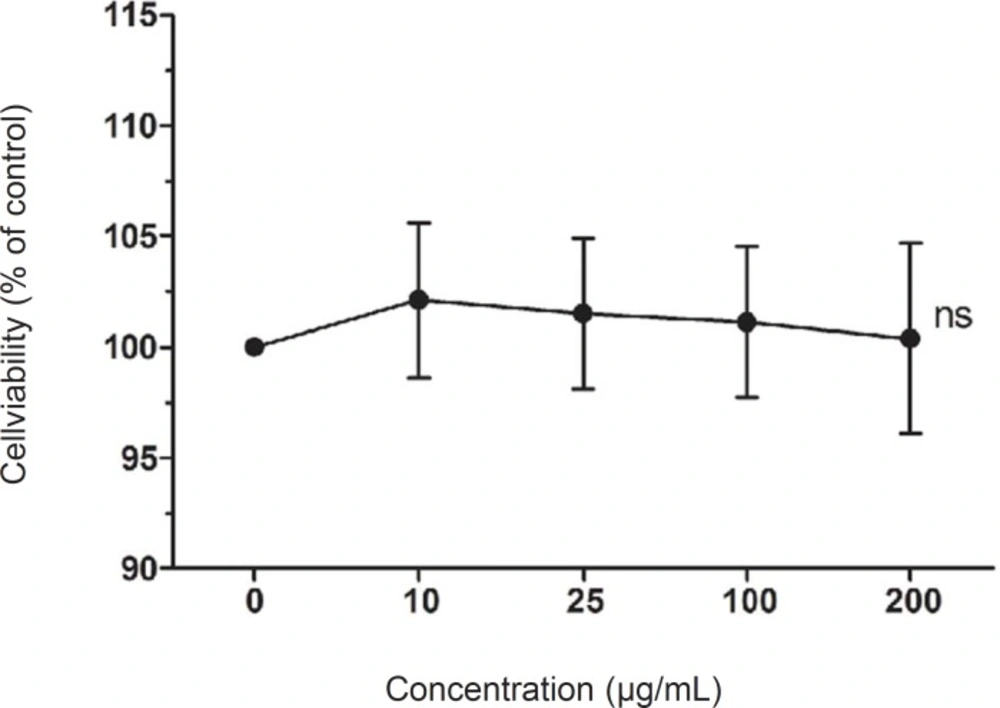
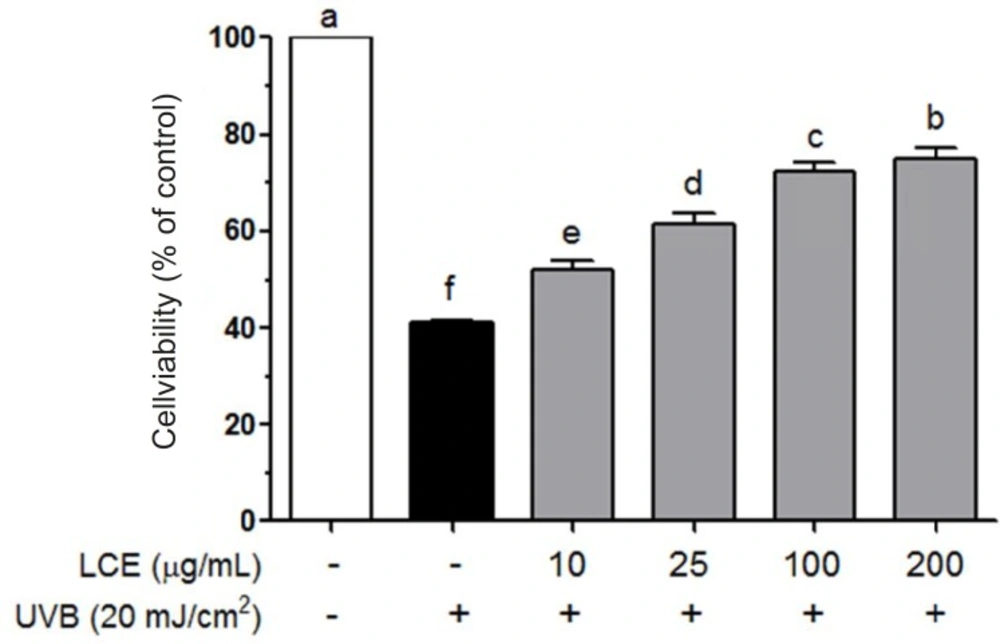
Cell viability assay
Cell viability was assessed by 3-(4, 5-dimethylthiazol-2-yl)-2, 5-diphenyl tetrazolium bromid (MTT) assay. Cells were seeded on 96-well plates at a density of 5 × 10³ cells/well. After a 24 h incubation, the cells were treated with LCE (10-200 ug/mL) for 24 h, and then exposed to UVB for 2 h. Following UVB irradiation, 100 μL MTT reagent (0.5 mg/mL) was added to each well and the cells were incubated in a humidified incubate at 37 °C to allow the MTT to be metabolized. After 4 h, the medium was removed and the cells were resuspended in formazan with 100 μL DMSO. The absorbance of the samples was measured at 540 nm by microplate reader (Bio-Rad, model 680, Hercules, CA, USA).
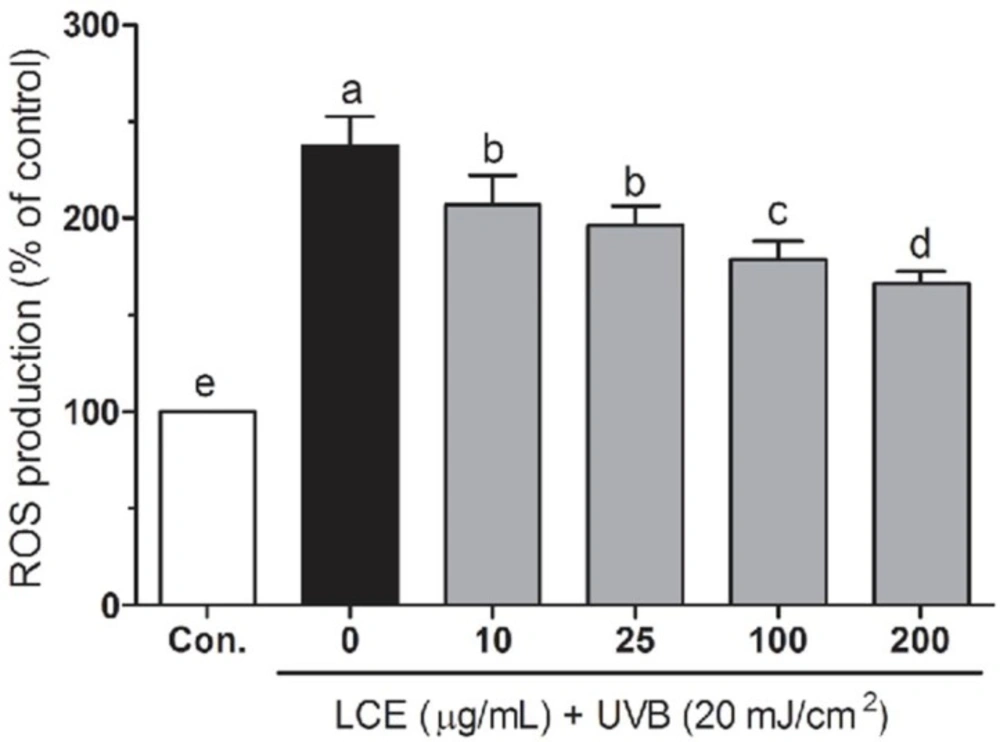
Analysis of intracellular ROS
Intracellular ROS levels were measured using the fluorescent probe dihydrodichlorofluorescein (H2DCF-DA). Following treatment, the HaCaT cells were washed with calcium- and magnesium-free PBS and incubated in H2DCF-DA (20 μM) containing serum- and phenol-red-free DMEM medium for 30 min. After incubation, the medium was removed and the cells were washed twice with PBS. Fluorescence was measured using a FLUOstar OPTIMA fluorescence plate reader (BMG Labtec, Ortenberg, Germany; excitation was read at 485 nm and emission at 535 nm). Relative ROS production (percentage of the control) was expressed as the ratio of fluorescence of the treated samples over the response in the appropriate controls: (fluorescence treatment/fluorescence control) × 100.
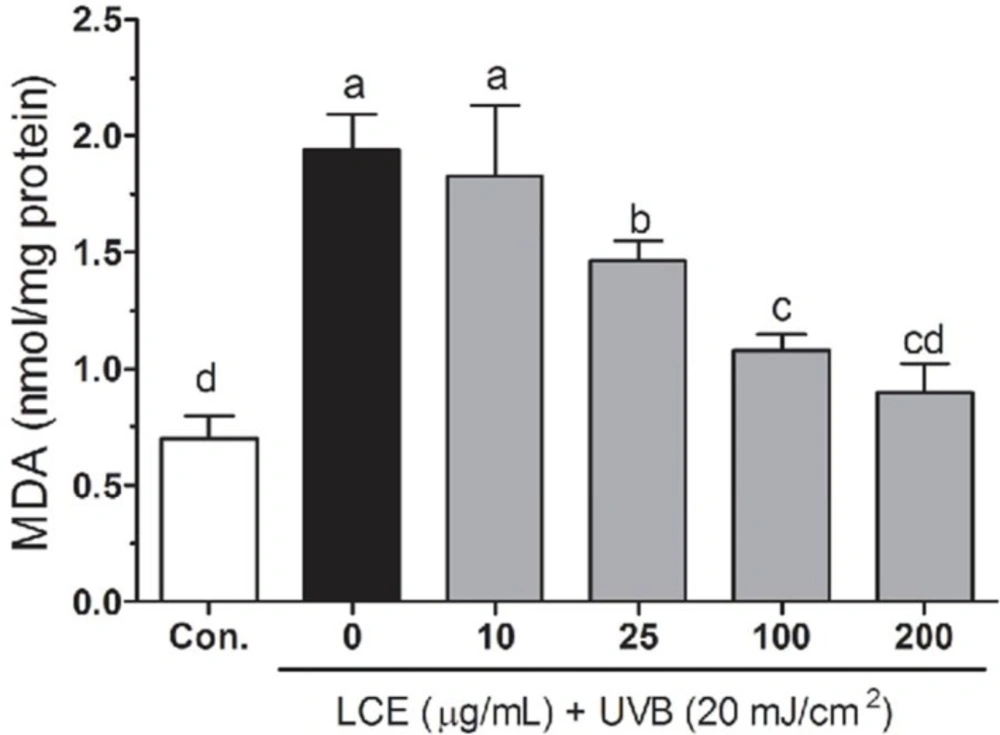
Lipid peroxidation levels
Lipid peroxidation was evaluated by thiobarbituric acid reactive substance (TBARS) assay (
19). In brief, the treated cells were washed with cooled PBS, scarped into TCA (2.8%, w/v) and sonicated, total protein was determined by bicinchoninic acid (BCA) assay. The suspension was mixed with 1 mL TBA (0.67%, w/v) and 1 mL TCA (25%, w/v), heated (30 min, 95 °C) and centrifuged (1,500 rpm, 10 min, 4 °C). TBA reacts with the oxidative degradation products of lipids to yield red complexes that absorb at 535 nm. The amount of TBA reactive substance was determined using UV-2401PC spectrophotometer (Shimadzu, Kyoto, Japan).
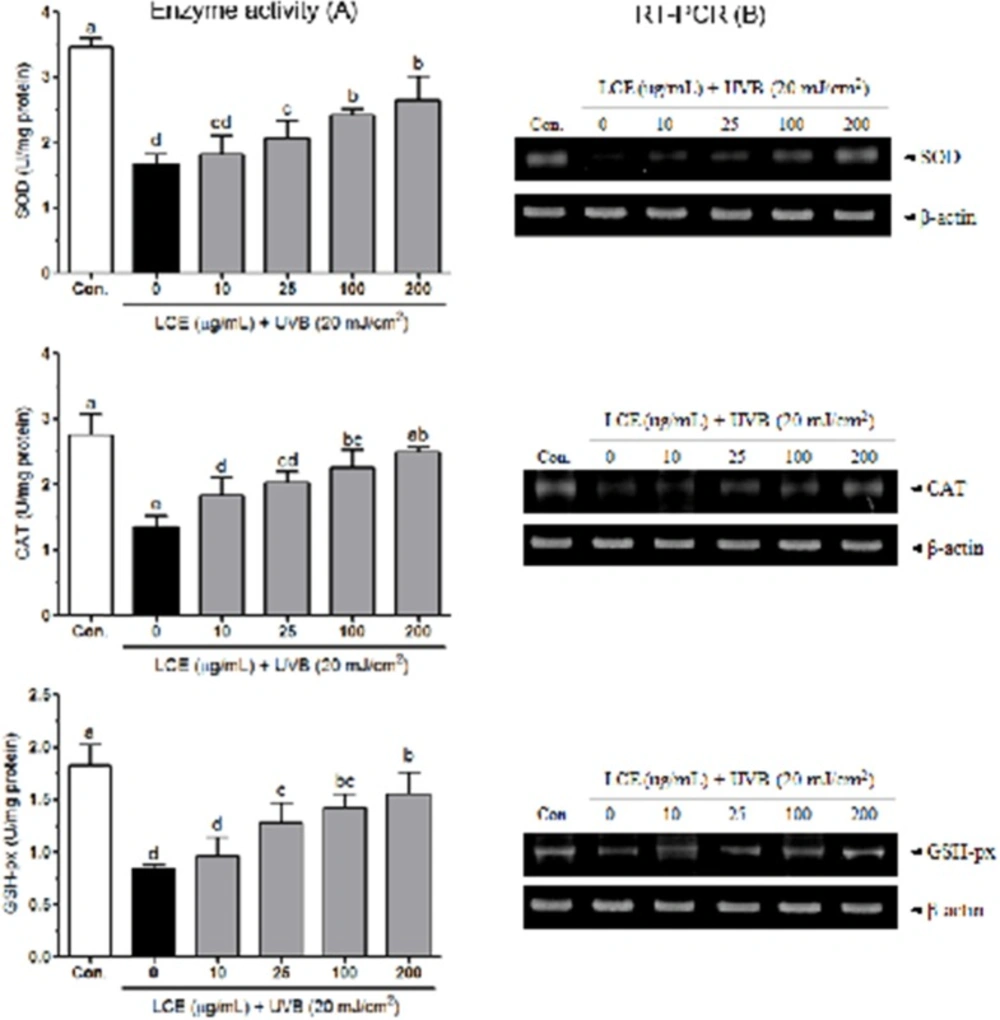
Antioxidant enzymes activities
HaCaT cells grown in 10-cm cell culture dish were pretreated with LCE (10-200 ug/mL) for 24 h and then exposed to UVB for 2 h for further analysis. The cells were washed with PBS, detached by scraping and centrifuged, and the resulting cell pellet stored at -80 °C. Cell pelltes were thawed, resuspended in 300 μL cold lysis buffer (PBS, 1mM EDTA), homogenized and centrifuged (1,200 rpm, 10 min, 4 °C). The resulting supernatants were used for activity measurements. CAT activity (U/mg protein) was according to the method described by Nelson and Kiesow (
20) in which the disappearance of the substrate H
2O
2 was measured spectophotometrically at 240 nm. SOD activity (U/mg protein) was assayed using a modified autoxidation of pyrogallol method (
21). One unit of SOD activity was defined as the amount of enzyme that inhibited the rate of autoxidation rate of pyrogallol by 50%. GSH-px activity (U/mg protein) was assayed by according to the method of Hafemen
et al. (
22). Protein contents were determined by Bio-Rad protein assay kit according to the manufacturer’s instructions.
Reverse transcription polymerase chain reaction (RT-PCR) assay
Total RNA was isolated with Trizol reagent (Invitrogen, Carlsbad, CA, USA) and centrifuged at 12,000 rpm for 15 min at 25 °C following the addition of chloroform. Isopropanol was added to the supernatant at a 1: 1 ratio and the RNA was pelleted by centrifugation (12,000 rpm for 15 min). After washing with ethanol, the RNA was solubilized in diethyl pyrocarbonate-treated RNase-free water and quantified by measuring the absorbance at 260 nm using a UV-2401PC spectrophotometer (Shimadzu, Kyoto, Japan). The primers for SOD, CAT, GSH-px and β-actin were as follows: SOD sense, 5’- ATGGCGACGAAGGCCGTGTG-3’, and antisense, 5’-GACCACCAGTGTGCGGCCAA-3’; CAT sense, 5’-CCTTCGACCCAAGCAACATG-3’, and antisense, 5’-CGAGCACGGTAGGGACAGTTC-3’; GSH-px sense, 5’-CCTGTACCAGTCCAATACCATCCT-3’, and antisense, 5’-TCCTGCTGGTCCTTCCCATA-3’; β-actin sense, 5’-TCCTTCTGCATCCTGTCGGCA-3’, and antisense, 5’-CAAGAGATGGCCACGGCTGCT-3’. Equal amounts of RNA (1 µg) were reverse transcribed in a master mix containing 1 × reverse transcriptase buffer, 1 mM dNTPs, 500 ng of oligodT18 primers(Invitrogen), 140 U of MMLV reverse transcriptase(Invitrogen), and 40 U of RNase inhibitor for 45 min at 42 °C. PCR was then carried out in an automatic thermocycler (Bioneer, Daejeon, South Korea) for 25 cycles (94 °C for 30 s, 60 °C for 30 s, and 72 °C for 40 s) followed by an 8-min extension at 72 °C. The PCR products were separated in 2% agarose gels and visualized by EtBr staining. β-actin was used for normalization.
Measure of cytokines concentration
Pro-inflammatory cytokines (TNF-α, IL-1β and IL-6) productions were measured with an ELISA assay. HaCaT cells grown in 6-cell culture plates were pretreated with LCE (10-200 ug/mL) for 24 h and then exposed to UVB for 2 h. After UVB irradiation, aliquots of samples (100 uL/well) were collected from the experimental medium, and the cytokines (TNF-α, IL-1β and IL-6) productions were measured using a commercially available ELISA kit (R&D Systems, Minneapolis, MN, USA) according to the manufacturer’s instructions.
Statistical analysis
Data are presented as the mean ± SD. Differences between the mean values for individual groups were assessed by a one-way ANOVA with Duncan’s multiple range tests. P<0.05 was considered to indicate a statistically significant difference. The SAS v9.1 statistical software package (SAS Institute Inc., Cary, NC, USA) was used for the analysis.