Optimization of the chromatographic conditions
Optimization of parameters in HPLC was done through investigating the influence of the detection wavelength, mobile phase, buffer solution and chromatographic column, because these four parameters play a key role on resolution and sensitivity. In this work, we chose a mixture of acetonitrile and water as the mobile phase. Considering the presence of flavonoids in the herbal extraction, a little amount of H3PO4 was added to the mobile phase to reduce the ionization and lower the polarity of these compounds. The gradient mode was shown as follows: the analysis was carried out on a SHIMADZU ODS column (250 mm×4.6 mm,5 μm). The chromatographic separation was performed with a gradient elution of (A) 0.4% H3PO4 in water and (B) acetonitrile, 0–8 min, B hold on 9%; 8-20 min, B linear increased from 9 to 14%; 20-40 min,B linear increased from 14 to 20%;40-50 min,B linear increased from 20 to 45%;50-65 min,B linear increased from 45 to 80%;65-88 min,B hold on 80%. The flow rate was set at 0.9mL/min, the column temperature was 30 ℃, injection volume was 10 µL, the wavelengths were selected 273 nm ranging from 0-25 min and 55-88 min, and 360 nm ranging from 25-55 min.
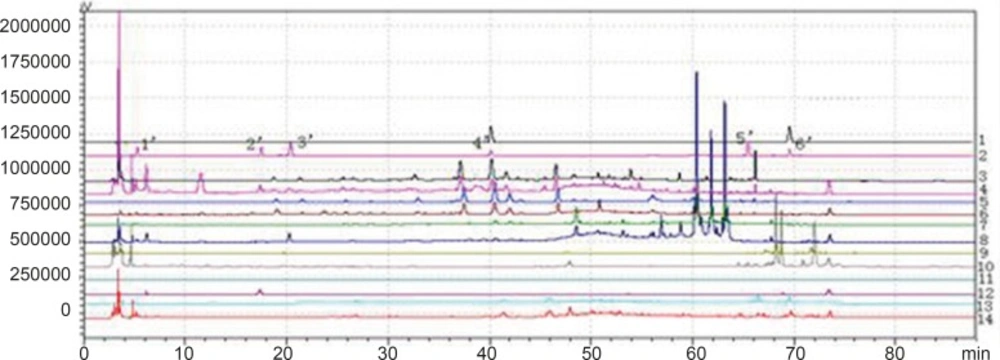
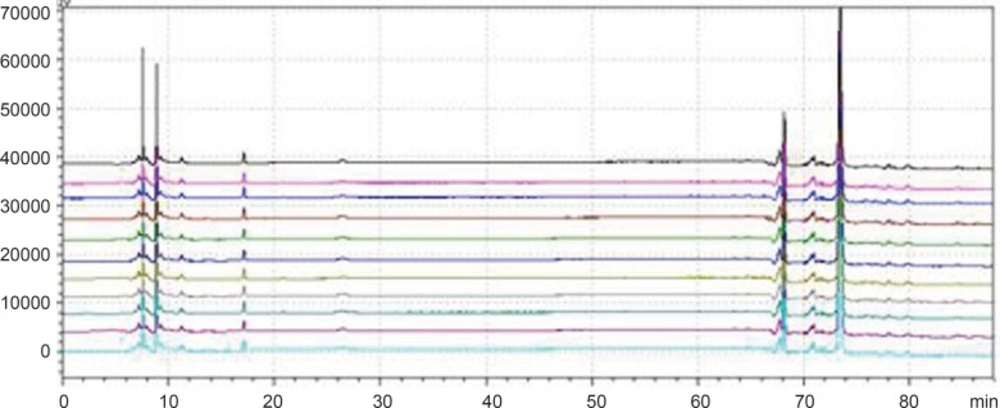
Chromatogram of granule and Chinese herbal medicine in 360 nm and 273 nm Wavelength Note: The number of 1, 3, 5, 7, 9, 11 and 13 were the chromatograms corresponding to mixed standard solution, WWCYNG, Niuerfeng, Laliao, Baishu, Fuling and Guanghuoxiang under 360 nm conditions, respectively. The number of 2, 4, 6, 8, 10 and 12 were the chromatograms corresponding to mixed standard solution, WWCYNG, Niuerfeng, Laliao, Baishu, Fuling and Guanghuoxiang under 273 nm conditions, respectively. The number of 1’, 2’, 3’, 4’, 5’and 6’ were the compents corresponding to Gallic acid (tR:5.337 min), Pachymic acid(tR:17.386 min), Chlorogenic acid (tR:20.314 min), Rutin (tR:40.439 min), Atractylenolide Ⅰ (tR:65.557 min) and Apigenin ( tR:69.453 min), respectively.
Detection wavelength selection
Niuerfeng, Laliao and Guanghuoxiang all contain flavonoids, such as rutin found in Niuerfeng and Laliao, apigenin found in Guanghuoxiang, and their maximum absorption wavelengths are 360 nm or 258 nm, respectively (
9). Laliao also contains phenolic acids such as Gallic acid and Chlorogenic acid, which of maximum absorption wavelengths are 273 nm and 327 nm (
10). Baishu contains the atractylenolide Ⅰ whose maximum absorption wavelength is 220 nm (
11). Fuling contains triterpenoids such as the pachymic acid whose maximum absorption wavelength is 242 nm (
12). It is generally known that the ultraviolet spectra is 200-400 nm. Therefore, after other experimental conditions was fixed, we separately selected one low absorption wavelength(273 nm) and one high absorption wavelength (360 nm). The results were shown
Figure 2.
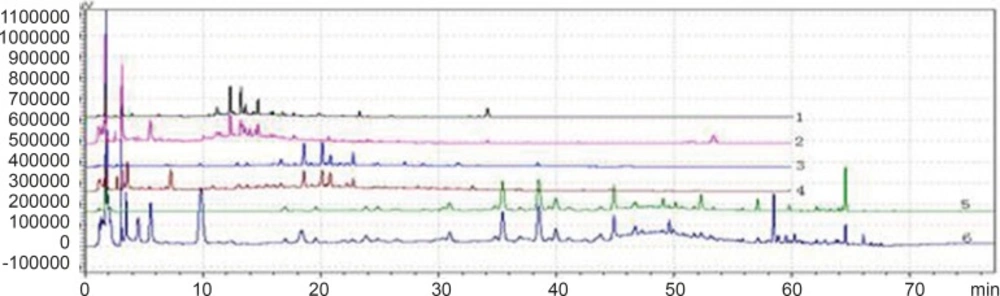
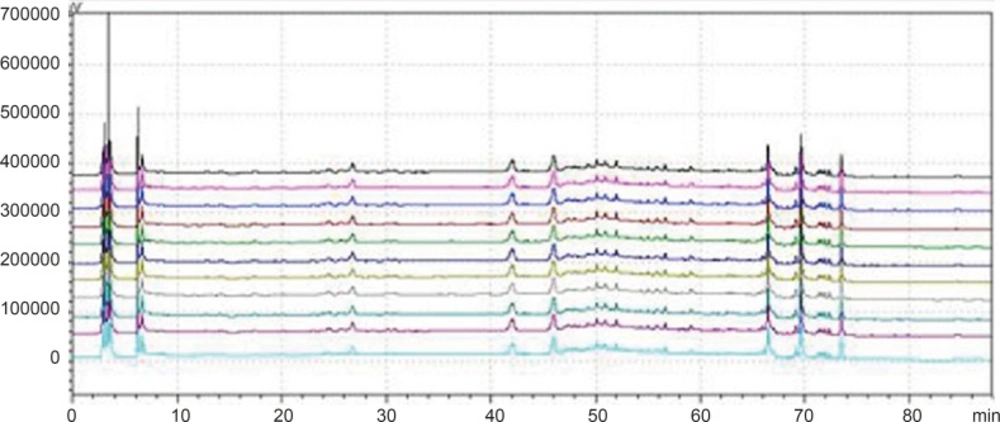
Chromatogram of 3 kinds of gradient elution waies in 360 nm and 273 nm Wavelength (Note: The number of 1,3 and 5 were the WWCYNG chromatograms respectively corresponding to SI, SⅡ and SⅢ under 360 nm conditions. The number of 2, 4 and 6 were the WWCYNG chromatograms respectively corresponding to SI, SⅡand SⅢ under 273 nm conditions
As
Figure 2 was shown, the detection of wavelength was mainly related with the peak number, peak area of the each peak, the baseline noise and baseline drift,
etc. ①Peak number: Under 360nm and 273 nm conditions, the chromatogram results of WWCYNG, Niuerfeng, Laliao, Baishu, Fuling and Guanghuoxiang were 39 and 41, 41and 37, 35 and 30, 10and 22, 10and 14, 26 and 29, respectively. ②Peak area: WWCYNG had 2 large chromatographic peaks when the retention time was respectively 11.532 min and 73.442 min in the low wavelength (See The No. 2 in
Figure 2), while the 5 herbs had one large chromatographic peak when the retention time was 11.532 min (See The No. 4, 6, 8, 10 and 12 in
Figure 2). However, when the wavelength was 360 nm, WWCYNG and the 5 herbs all hadn’t any peak. Therefore, 6 compositions including rutin (Niuerfeng and Laliao), gallic acid (Laliao), chlorogenic acid (Laliao), atractylenolideⅠ(Baishu), pachymic acid (Fuling) and apigenin (Guanghuoxiang), which originated from 5 herbs respectively, were selected as quantitative compositions. The 3 components of gallic acid, pachymic acid and chlorogenic acid almost didn’t appear peak when the detection wavelength was 360 nm, however, they were obvious in the 273 nm UV. Furthermore, the retention time of gallic acid, pachymic acid and chlorogenic acid were 5.337 min, 17.386 min and 20.314 min respectively in the 273 nm UV. So the retention time 25 min was regarded as a switching point,in other words, the detection wavelength was set to 273 nm in 0-25 min. Simultaneously, rutin peak was more obvious in the 360 nm than in the 273 nm, and its retention time was 40.439 min. So the retention time 55 min was regarded as the other switching point. The detection wavelength was set to 360 nm in 25-55 min.
In summary, this study chose 273 nm and 360 nm as the experimental wavelengths. The elution method was determined among 0-25 min and 55-88 min using 273 nm, but in 25-55 min using 360 nm.
Mobile phase selection
The aims of optimization experiment for mobile phase were not only to obtain higher separation efficiency and peak resolution of target compounds, but also to reserve shorter run-time. In this work, we chose a mixture of water and acetonitrile as the mobile phase. Considering the presence of flavonoids and triterpenoids in the WWCYNG and herbal extraction, a small amount of H
3PO
4 was added to the mobile phase to reduce the ionization and lower the polarity of these compounds. The optimum mobile phase was achieved with A (0.4% H
3PO
4+H
2O) and solvent B (acetonitrile) in the gradient mode achieved after many trials (S
I to S
Ⅳ) shown as in
Table 2. The flow-rate was 0.9 mL/min.
| SI | SⅡ | SⅢ | SⅣ |
|---|
| Time/min | B% | Time/min | B% | Time/min | B% | Time/min | B% |
|---|
| 0 | 13 | 0 | 13 | 0 | 13 | 0 | 9 |
| 5 | 13 | 10 | 13 | 5 | 13 | 8 | 9 |
| 25 | 55 | 35 | 45 | 20 | 25 | 20 | 14 |
| 50 | 70 | 45 | 45 | 25 | 25 | 40 | 20 |
| 60 | 90 | 60 | 65 | 45 | 40 | 50 | 45 |
| - | - | - | - | 55 | 60 | 65 | 80 |
| - | - | - | - | 78 | 60 | 88 | 80 |
WWCYNG actually was extracted from the 5 herb, so we firstly selected WWCYNG as the research object of mobile phase selection. The chromatograms of SI S
Ⅱ and S
Ⅲ were merged in one chart, shown in
Figure 3.
The result of SI showed:The peak separation of the overall effect from WWCYNG at high wavelengths (See No.1 in
Figure 3, and the wavelength monitored at 360 nm) and low wavelengths(See No.2 in
Figure 3, and the wavelength monitored at 273 nm) are poor, the peaks are mainly concentrated in the 1.5-10 min and 12-26 min segment. This magnified chromatogram(0-35 min)of granule have a peak in the retention time 6.23 min at 273 nm chromatogram, however there haven’t any peak in the 360 nm chromatograms.
The result of S
Ⅱ showed: The chromatographic peaks had the better separation in the range of 10-35 min both 360 nm (See No.3 in
Figure 3) and 273 nm (See No.4 in
Figure 3). Comparing with the SI whose peaks concentrated in the range of 1 the 1.5-10 min and 12-26 min 0-35 min, the retention time of the corresponding were more reasonable than the retention time of the SI. This magnified chromatogram(0-35 min)of granule can found that the peak number increased more than the SI in the range of 2-10 min at 273 nm chromatogram.
The result of S
Ⅲ showed:The total effects of WWCYNG whether peak resolution, peak numbers or baseline drift significantly increased by the select of the S
Ⅲ (No.5 in
Figure 3 of monitored at 360 nm, No.6 in
Figure 3 of monitored at 273 nm). The only weakness is the retention time of first strong peak in 0.638 min, it means first strong peak is too close the position which the solvents peak may also appear, the results lead to the first peak was accurately judged.
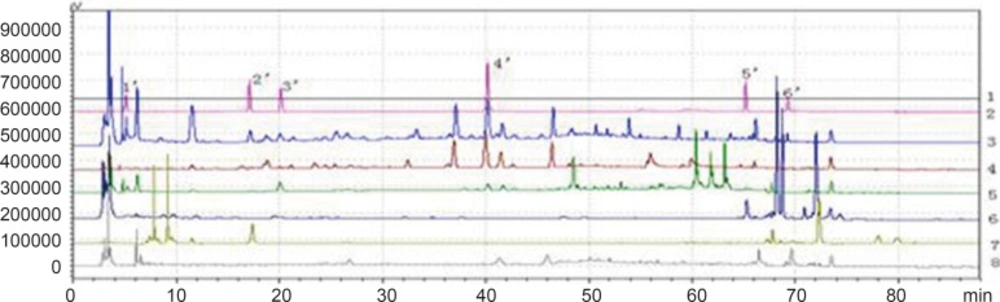
On the base the S
Ⅲ, we selected WWCYNG and 5 herbs as the research object by the selection of mobile phase S
Ⅳ: Double wavelengths switch mode is shown in
Figure 3, by raising the starting proportion of the buffer solution in the mobile phase from 87% to 91%, the retention time of first strong peak changed from 0.638 min to 2.851 min. The results are moderate. Mobile phase S
Ⅳ can basically reflects the information about the WWCYNG and herbs, and can be used as the best choice of detection wavelength and mobile phase elution method in this study.
Chromatogram of the SⅣ gradient elution way in 360 nm and 273 nm Wavelength
Quantitative analysis of reference compounds
The values of RSD of retention times and peak areas were in all cases lower than 1.3%.
Linearity
Linearity was examined with standard solutions. A mixed stock solution, containing 12.1 µg/mL Gallic acid, 70.2 µg/mL Pachymic acid, 5.3 µg/mL Chlorogenic acid, 51.6 µg/mL Rutin, 51.0 µg/mL Atractylenolide Ⅰ and 4.8 µg/mL Apigenin ,was prepared. An aliquot (0.1, 0.5, 1.0, 5, 10 and 20 μL) of each standard working solution was subjected to HPLC-DAD analysis. Each calibration curve contained six different concentrations and was performed in triplicate. The linearity for each compound was established by plotting the peak area (y) versus sample quantity (x) of each analyte which was expressed by the equation given in
Table 1. All calibration curves showed good linear regression (R
2>0.999) within test ranges.
The limit of detection(LOD) and the limit of quantification(LOQ)
LOD and LOQ were the concentrations of a compound at which its signal-to-noise ratios (S/N) were detected as 3:1 and 10:1, respectively. They were determined by serial dilution of sample solution using the described HPLC-DAD conditions. The results were shown in
Table 3.
Recovery and precision
Recoveries were performed employing the method of standard addition. Six portions of WWCYNG were spiked with the mixed standards of four alkaloids. Then the samples were pretreated as described in Section 2.3, and the results were summarized in
Table 3.All recoveries obtained were very well, indicating the good recovery of the method.
| Compound | Linear range(µg) | Linear equation | Regression r2 (n=5) | LOD(µg/ml) | LOQ(µg/mL) | Recovery
|
|---|
| Average (%) | RSD(%) |
|---|
| Gallic acid, | 0.00121-0.242 | Y=895909X-255.1 | r=0.9998 | 0.01581 | 0.05271 | 100.2 | 1.21 |
| Pachymic acid | 0.00702-1.404 | Y=287622X-1876.8 | r=0.9993 | 0.0007197 | 0.002399 | 99.85 | 1.35 |
| Chlorogenic acid | 0.00053-0.106 | Y=3.0×10⁶X-479.5 | r=0.9997 | 0.0007923 | 0.02234 | 100.3 | 0.78 |
| Rutin | 0.00516-1.032 | Y=238127X+109.35 | r=0.9999 | 0.009235 | 0.02671 | 100.6 | 0.81 |
| Atractylenolide Ⅰ | 0.0051-1.02 | Y=558512X+1412.6 | r=0.9998 | 0.00312 | 0.00994 | 99.67 | 0.69 |
| Apigenin | 0.00048-0.096 | Y=2.0×10⁶X-283.1 | r=0.9999 | 0.00117 | 0.03562 | 99.81 | 1.65 |
The content determination of WWCYNG and compending 5 herbs
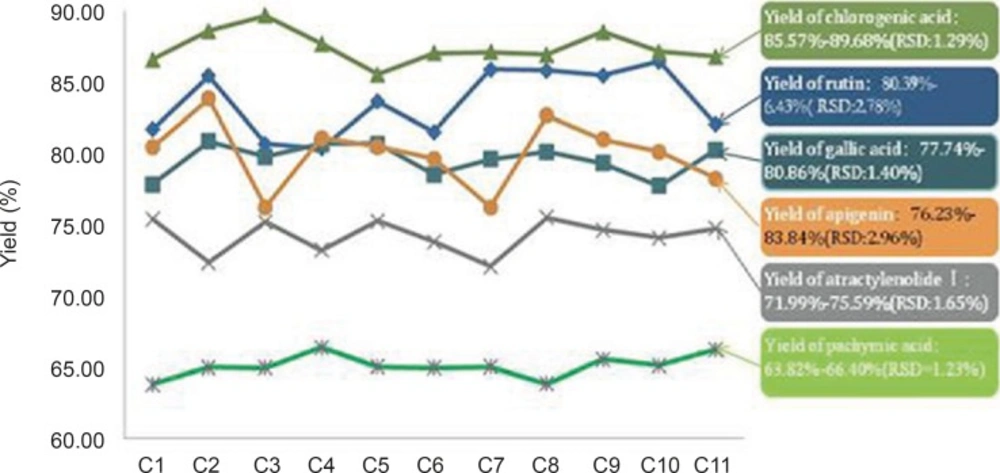
The standard solution and 11 batches herbs of Niuerfeng, Laliao, Baishu, Fuling and Guanghuoxiang, as described in Section 2.3. WCYNG is equivalent and prepared from 2 g Niuerfeng, 1.0 g Laliao, 0.67 g Baishu, 1.0 g Fuling and 0.67 g Guanghuoxiang.
shown, the yield of 11 batches WWCYNG prepared by 5 herbs and the corresponding herbs were as follows:the amount of rutin, gallic acid, chlorogenic acid, atractylenolide Ⅰ, pachymic acid and apigenin were 80.39%-86.43% (RSD=2.78%), 77.74 %-80.86% (RSD=1.40%), 85.57%-89.68% (RSD=1.29%), 71.99 %-75.59% (RSD=1.65%), 63.82 %-66.40%(RSD=1.23%), 76.23%-83.84% (RSD=2.96%), respectively. R.S.D. values of the yield of from herb to WWCYNG in 11 batches samples were less than 3.0 %, which means the content determinations were in good correspondence in all samples
Fingerprint analysis of compound herbal medicine WWCYNG and 5 herbs
Common peaks and non-common peaks
According to the definition of fingerprints of TCM, a chromatographic fingerprint is in practice a chromatographic pattern of some common kinds of pharmacologically active and chemically characteristic components in the TCM. This chromatographic profile should be characterized by the fundamental attributions of “sameness” and “differences”. It is suggested that the authentication and identification of herbal medicines can be accurately conducted by chromatographic fingerprints. The chromatographic fingerprints could demonstrate both the “sameness” and “differences” between various samples successfully (
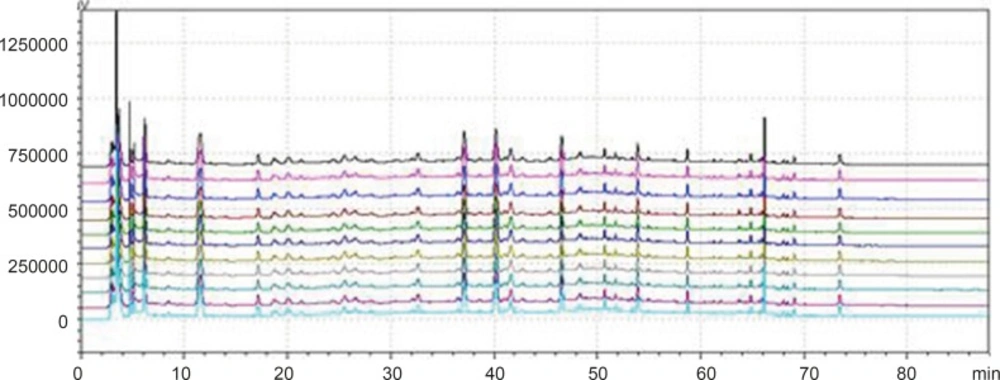
13). With HPLC method, 11 batches of samples from different factories in China were analyzed in the optimum conditions. The average chromatogram from the 11 batches was regarded as the standardized characteristic fingerprint of WWCYNG. Peaks existed in all chromatograms of 11 samples were assigned as “common peaks”, indicating the sameness among various samples. The chromatograms of WWCYNG from the 11 samples consisted of 21 common peaks within 88 min, shown in
Figure 5. Among these components, rutin was detected as a high and stable content, therefore it was chosen as the reference substance. All common peaks’ relative retention time and relative peak area were obtained with reference to this substance. R.S.D. values of the relative retention time of 21 common peaks in 11 batches samples were less than 1.0% which means the common peaks were in good correspondence in all samples (data not shown). Moreover, such low R.S.D. values demonstrated that the fingerprint by HPLC had good stability and reproducibility. So, the fingerprint of WWCYNG was composed of the peak profiles of the 21 components. Likewise, as shown from
Figure 6 to
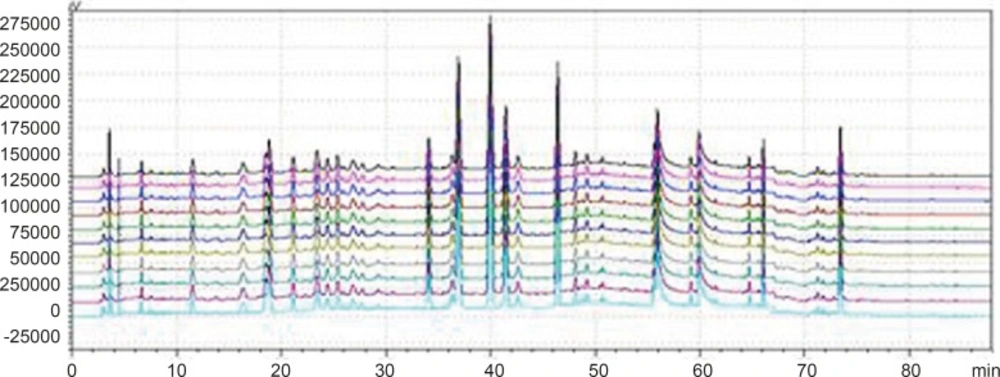
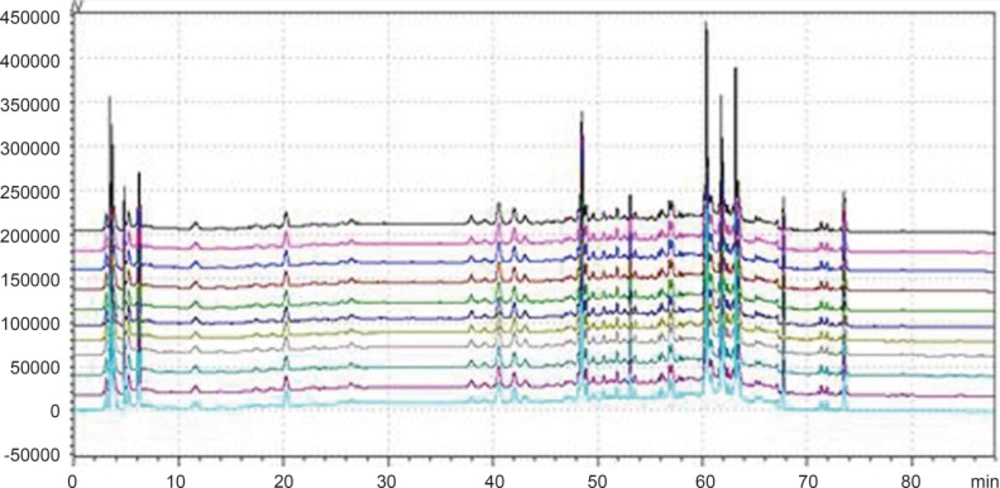
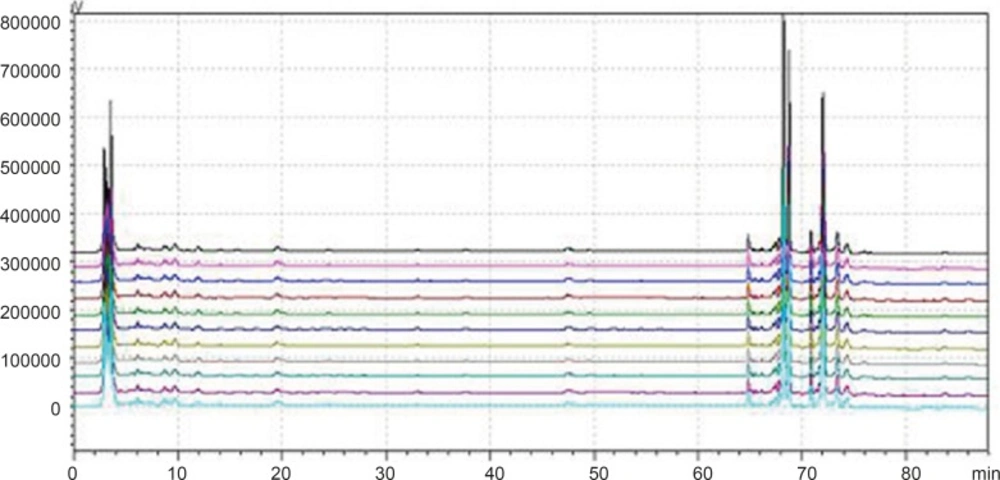
Figure 10,the common peaks of 11 batches about Niuerfeng, Laliao, Baishu, Fuling and Guanghuoxiang, were 19, 15, 12, 7 and 13, respectively.
Peak alignment of fingerprints of granule
Peak alignment of fingerprints of Daphniphullum calucinum Benth
Peak alignment of fingerprints of Polygonum hydropiper L.
Peak alignment of fingerprints of Atractylodes macrocephala Koidz
Peak alignment of fingerprints of Poria cocos(Schw.)Wolf.
Peak alignment of fingerprints of Pogostemon cablin(Blanco)Benth
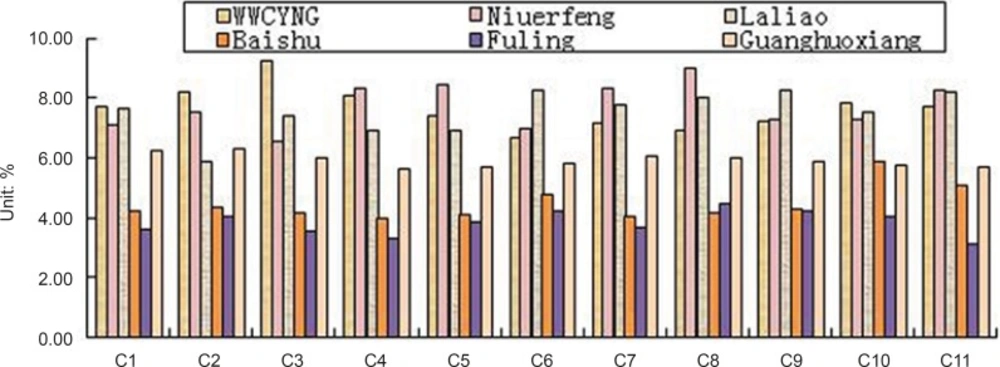
Besides the common peaks, there are non-common peaks in each chromatogram, which represents the fuzziness among the same kind of TCM. The percentages of non-common peaks in granules, Niuerfeng, Laliao, Baishu, Fuling and Guanghuoxiang were 6.72% -9.26%, 6.57%-9.01%, 5.88%-8.22%, 3.98%-5.34%, 3.27% -4.44% and 5.70% -6.32%, respectively. They are less than the national standard of 10 % (see
Figure 11.).
Percentage of unmutual peak area in the total peak area about 11 batches of granules and 5 raw herbs.
Similarity evaluation
SFDA suggested that all of herbal chromatograms should be evaluated by their similarities, which come from the calculation on the correlation coefficient with the professional software named Similarity Evaluation System for Chromatographic Fingerprint of Traditional Chinese Medicine (Version 2004 A) (
14).The fingerprints of 11 batches samples were processed to analyze similarity among these samples. According to the relative peak areas of common peaks, the similarity analysis was conducted (data not shown). The results showed that the similarities of granules, Niuerfeng, Laliao, Baishu, Fuling and Guanghuoxiang are 0.93, 0.93, 0.95, 0.95, 0.94 and 0.92, respectively. All of correlation coefficient of the samples are more than 0.92. These indicated the qualities of WWCYNG and 5 herbs were stable and the products from different pharmaceutical factory were consistent.
The correlation between WWCYNG preparations and their raw herbal medicines
The chromatograms of Niuerfeng, Laliao, Baishu, Fuling, Guanghuoxiang and WWCYNG were shown in
Table 4. The relative retention time of peaks in WWCYNG fingerprint was compared with that in 5 herbs. It could be found that there were 10, 9, 3, 3 and 5 common peaks in Niuerfeng, Laliao, Baishu, Fuling and Guanghuoxiang, respectively. The correspondence of peaks between in WWCYNG and in raw herbs was shown in details in
Table 4.
| Medicines | Peak No. |
|---|
| WWCYNG | 1 | 2 | 3 | 4 | 5 | 6 | 7 | 8 | 9 | 10 | 11 | 12 | 13 | 14 | 15 | 16 | 18 | 19 | 20 | 21 |
| Niuerfeng | 1 | - | - | - | 2 | 3 | - | - | 9 | 10 | 11 | 12 | 13 | 15 | - | - | - | - | - | 19 |
| Laliao | 1 | - | 3 | 4 | 5 | - | - | 6 | - | - | - | 7 | - | - | - | 10 | 11 | - | - | 15 |
| Baishu | - | 2 | - | - | - | - | - | - | - | - | - | - | - | - | - | - | - | 7 | - | 12 |
| Fuling | - | - | - | - | 1 | - | 4 | - | - | - | - | - | - | - | - | - | - | - | - | 7 |
| Guanghuoxiang | 2 | - | - | - | 3 | - | - | - | - | - | - | - | - | - | 8 | - | - | - | 12 | 13 |