Reagents Resveratrol was purchased from Selmedica Healthcare (Korea). 2-Thio-barbituric acid (TBA) was purchased from Sigma chemicals Co (Germany). All other chemicals were of analytical grade.
Animals and treatment
Male Wistar rats from Pasteur Institute; Tunis (220–240 g) were used in these experiments in accordance with the Ethic Committee of Tunis University for the care and use of animals in conformity with NIH guidelines. They were provided with food and water ad libitum and maintained in animal house at fixed temperature of 22 ± 2°C with a 12 h light–dark cycle. Animals were divided into two groups of 6 animals each. Groupe 1: control injected with 10% ethanol 10% and group 2, resveratrol treated (25 mg/kg bw) daily administered by intraperitoneal injection for 7 days.
Heart perfusion and hemodynamic assessment
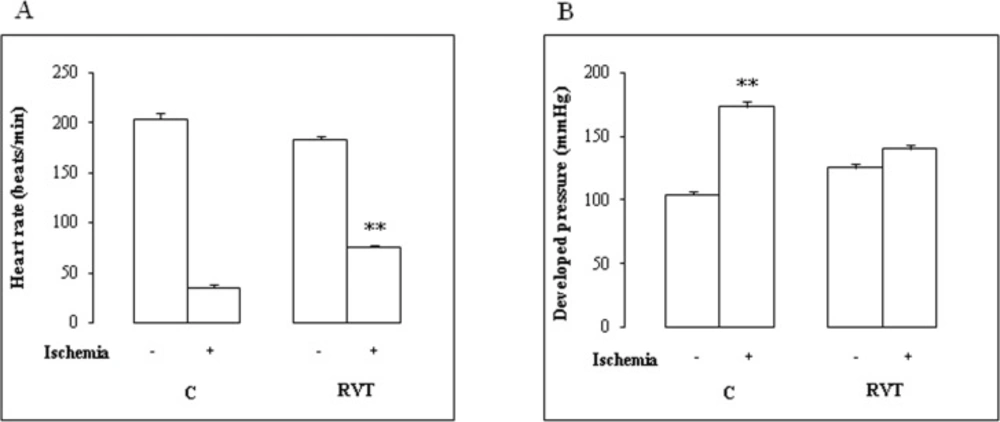
24 h after the last injection, rats were anesthetized with 0.5 mL urethane (40 mg/mL) and heparinized (1.1 U/L). Hearts were rapidly isolated and arrested in ice-cold perfusion krebs-Henseleit (KH) buffer. The aorta was cannulated and the heart was Langendorff-perfused at a constant pressure of 70 mmHg in continuously gassed prewarmed KH buffer. Hearts were subjected to stabilization for 10 min before a global ischemia period of 45 min followed by 10 min reperfusion. Hemodynamic parameters were monitored as described previously (Mokni et al., 2007 b). At the end of ischemia/reperfusion (I/R) damage, hearts were weighed, homogenized in phosphate buffer saline pH 7.4 with an ultrathurax T25 homogenisator, centrifuged (10 min at 10 000 g, 4°C) and supernatant used for measurement of free iron level, malondialdehyde (MDA) and antioxidant enzyme activities.
Free iron determination
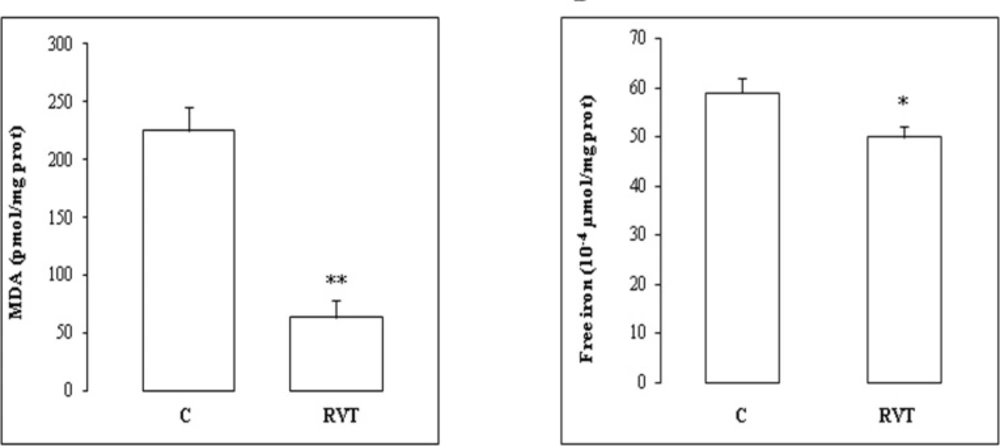
Myocardial free iron was determined according to Leardi et al. (1998) using a commercially available kit from Biomaghreb (Ariana, Tunisia). Briefly, at acidic pH 4.8 all Fe3+ released from transferrine were reduced by ascorbic acid into Fe2+, which constitutes with ferrozine a purple colourful complex measurable at 560 nm. Heart extract was added to 250 μl of reaction mixture containing ascorbic acid (5 g/L) and ferrozin (40 mM), and incubation was performed at 37°C for 10 min.
Lipoperoxidation determination
Lipid peroxidation was determined by malondialdehyde (MDA) measurement according to the double heating method (Draper and Hadley, 1990). Briefly, aliquot from heart homogenate was mixed with BHT-TCA solution containing 1% BHT (m/v) dissolved in 20% TCA (m/v) and centrifuged at 1000 g for 5 min at 4°C. The supernatant was blended with 0.5N HCl, and 120 mM TBA in 26 mM Tris, and then heated at 80°C for 10min. After cooling, absorbance of the resulting chromophore was determined at 532 nm using a Bio-Rad UV-visible spectrophotometer. MDA levels were determined by using an extinction coefficient for MDA-TBA complex of 1.56 105 M-1cm-1.
Antioxidant enzyme activity assays
All spectrophotometric analyses of antioxidant enzyme activities were performed with a SmartSpec 3000 Bio-Rad UV-visible spectrophotometer (Germany).
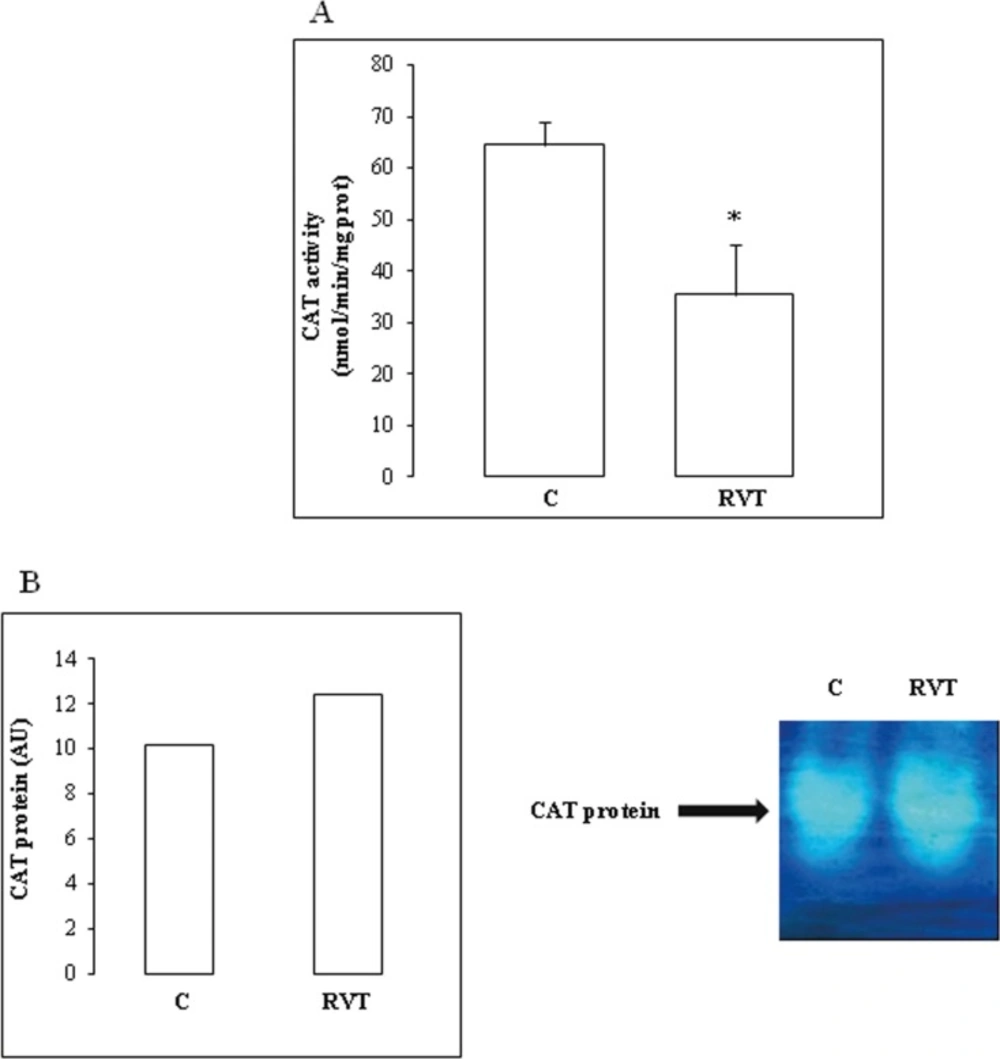
Catalase (CAT) activity was assayed by measuring the initial rate of H2O2 disappearance at 240 nm (Aebi, 1984). The reaction mixture contained 33 mM H2O2 in 50 mM phosphate buffer (pH 7.0) and heart extract. CAT activity was calculated using an extinction coefficient of 40 mM-1cm-1 for H2O2.
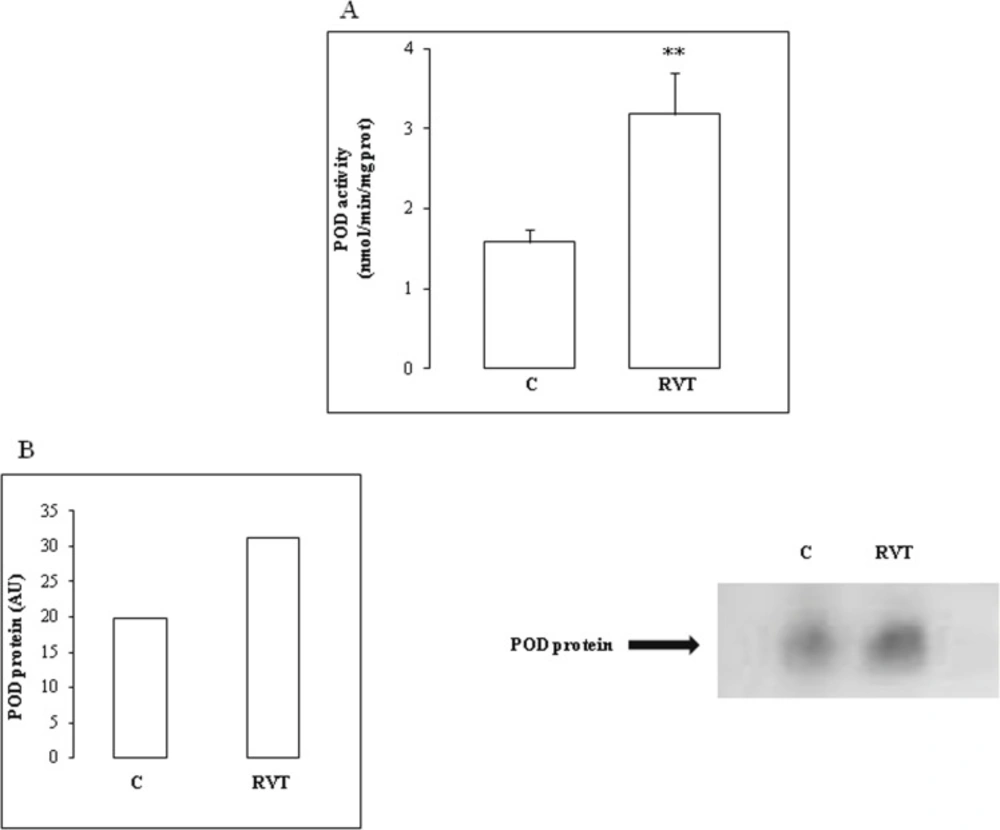
Peroxidase (POD) activity was measured at 25°C using guaiacol as the hydrogen donor. The reaction mixture contained 9 mM guaiacol, 19 mM H2O2 in 50 mM phosphate buffer pH 7 and 50 μL of heart homogenate extract in a final volume of 1 mL. The reaction was initiated by the addition of H2O2 and monitored by measuring the increase in absorbance at 470 nm every 30 sec for 3 min. POD activity was expressed as nmol of guaiacol oxidized per min and calculated using a molecular extinction coefficient of 26.2 mM-1 (Chance and Maehly, 1955).
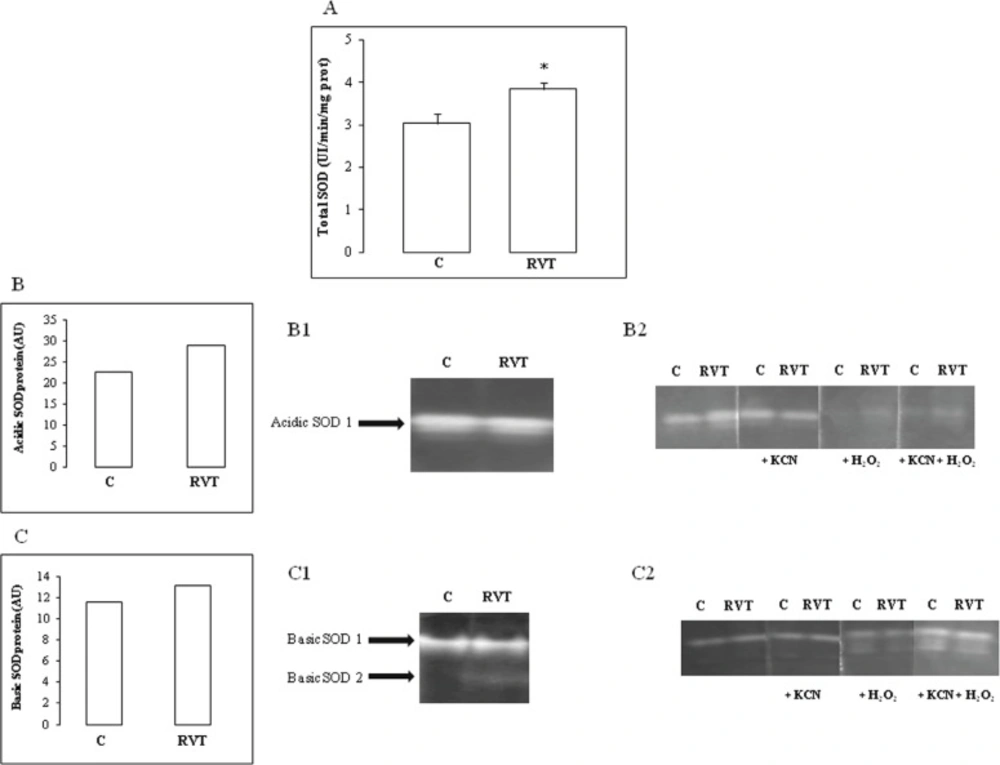
Superoxide dismutase (SOD) activity was determined by using a modified epinephrine assay (Misra and Fridovich, 1972). At alkaline pH, superoxide anion (O2-) causes the auto-oxidation of epinephrine to adenochrome. One unit of SOD is defined as the amount of extract that inhibits the rate of adenochrome formation by 50%. Heart homogenate was added to a 2 mL reaction mixture containing 10 μl bovine catalase (0.4 U/μL), 20 μL epinephrine (5 mg/ml) and 62.5 mM sodium carbonate-sodium bicarbonate buffer (pH 10.2). Changes in absorbance were recorded at 480 nm.
Analysis of antioxidant isoenzyme activities by Polyacrylamide gel electrophoresis (PAGE) Antioxidant SOD isoforms were analyzed by native PAGE. Acidic isoforms were resolved in 4% stacking and 10% separating gel according to Davis (1964). Basic isoforms were resolved in 4% stacking and 10% separating gel according to Reisfeld et al. (1962) with slight modifications. Briefly, gels were prepared in 25 mM acetic acid/KOH pH 6 buffer system and migration was conducted in 40 mM glycine/HCl pH 4 at 120 V for 3 h at 4°C. Electrophoresis were carried out toward the cathode allowing only neutral and basic proteins separation.
SOD activity was revealed after incubation of gels in 2.5 mM nitroblue tetrazolium (NBT) solution for 30 min and stained with 28 mM Temed and 28 μM riboflavin in 50 mM potassium phosphate buffer pH 7.8 (Beauchamp and Fridovich, 1971). Characterization of SOD isoforms was performed using KCN (5 mM) which inhibited Cu/Zn-SOD or with H2O2 (5 mM) affecting both Cu/Zn-SOD and Fe-SOD. Whereas, Mn-SOD was insensitive to both inhibitors (Loukhili et al., 1999).
CAT isoenzymes were separated by native or SDS 7% PAGE according to Davis (1964). CAT activity was visualized after soaking the gel in 3.27 mM H2O2 for 30 min, washing in double distilled water and stained with a mixture of 1% (w/v) potassium ferricyanide and 1% (w/v) ferric chloride (Woodburry et al., 1971).
POD isoforms were analyzed by native 10% PAGE according to Davis (1964). POD activity was revealed after incubating the gel for 5 min in 100 mM sodium acetate buffer pH 5 containing 2.17 mM benzidine, 1% guaiacol and 0.5% H2O2 according to Lee et al. (2001).
Densitometry
Densitometric values of the protein band activities were evaluated using image J software and expressed in arbitrary units (AU).
Statistical analysis
Data were analyzed by unpaired Student’s t-tests or one-way analysis of variance (ANOVA) and expressed as means ± standard error of the mean (SEM). All statistical tests were 2-tailed, and results with a p-value < 0.05 were considered significant.