Inhibition of the fKv1.4ΔN currents by verapamil and diltiazem
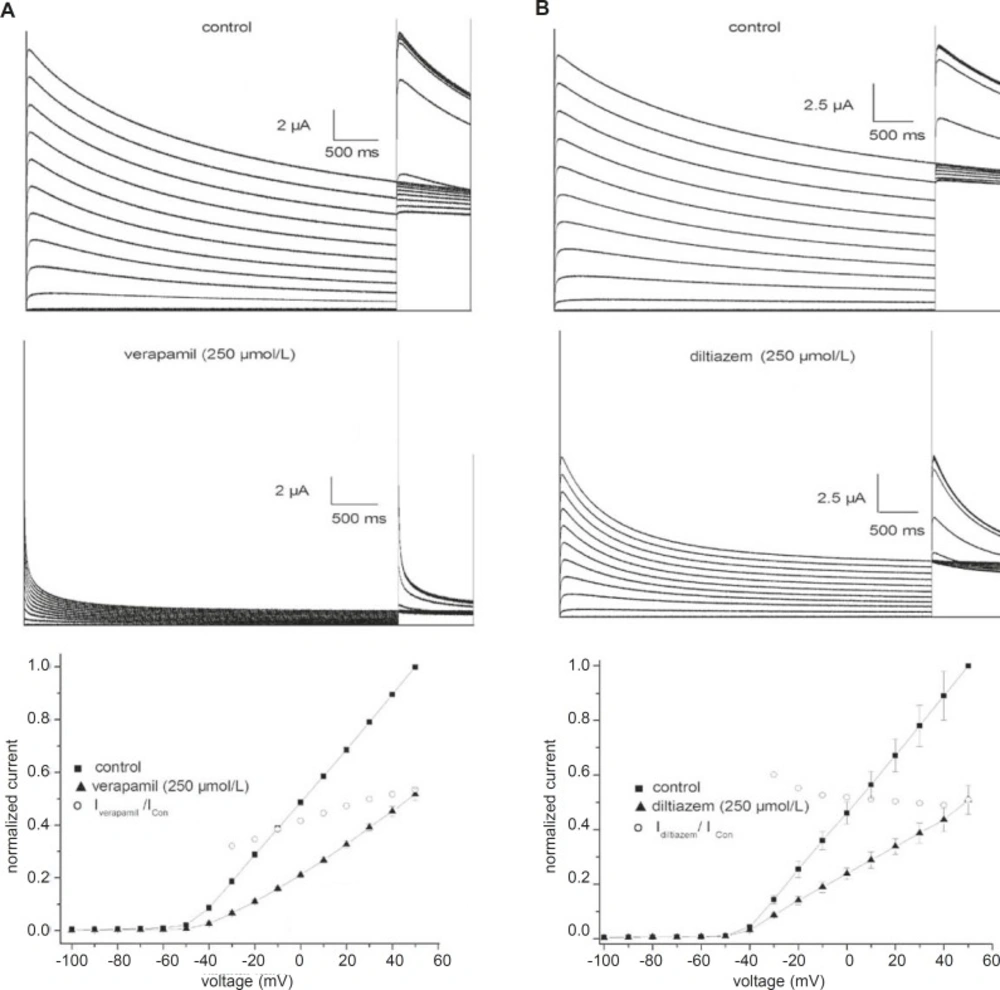
Figure 1 shows traces of currents from fKv1.4ΔN channels expressed in Xenopus oocytes under control conditions and in the presence of verapamil (A) or diltiazem (B). The cells were held at –90 mV and given 5-sec depolarizing pulses from –100 to +50 mV. Outward currents were followed by outward tail currents upon repolarization to +50 mV. Under control conditions (
Figure 1, upper panels), positive depolarization to –40 mV elicited outward currents that declined slowly during the maintained depolarization (slow C-type inactivation). The middle panels of
Figure 1 show the differential effectiveness of verapamil and diltiazem at an identical concentration (250 μmol/L). Both drugs not only reduced the current amplitude, but also accelerated the inactivation. Verapamil and diltiazem reduced by 53.5 ± 6.2% and 52.2 ± 4.6% (n = 5), respectively, the peak current elicited by pulses to +50 mV. The peak currents in the presence of verapamil and diltiazem were poorly resolved from the capacitance transient on the time scale. Verapamil and diltiazem showed similar potencies in inhibiting fKv1.4ΔN currents, and the inhibitory effects were completely abrogated by a 10 min washout of drug (data not shown).
Effects of verapamil (A) and diltiazem (B) on fKv1.4ΔN channels expressed in Xenopus oocytes. Representative curves are shown for 5-second depolarizing pulses from -90 mV to voltages between –100 and +50 mV in steps of 10 mV. Upper panels: traces recorded under control conditions. Middle panels: current traces obtained in the presence of 250 μmol/L verapamil or 250 μmol/L diltiazem. The peak currents in the presence of verapamil and diltiazem were poorly resolved from the capacitance transient on this time scale. Bottom panels: effects of 250 μmol/L verapamil and 250 μmol/L diltiazem on the peak current-voltage (I-V) relationships. Currents were normalized to the peak current at +50 mV under control conditions. The IDrug/IControl ratio was plotted as a function of the membrane potential. Data are shown as mean ± SEM (n = 5).
The effects of 250 μmol/L verapamil and 250 μmol/L diltiazem on the peak current-voltage (I-V) relationships for the fKv1.4ΔN channel are shown in
Figure 1 (bottom panel). The I-V relationships were constructed by plotting the normalized currents as a function of the membrane potential. Verapamil and diltiazem induced a voltage-dependent inhibition of the fKv1.4ΔN currents. To quantify the voltage dependency of fKv1.4ΔN block, the relative current (I
Drug/I
Con) was plotted as a function of the membrane potential. The current begins to activate at the activation threshold (between –40 and –20 mV), and both drugs decreased the peak current at potentials positive to the level of the activation threshold. The blockade remained constant at voltages above –20 mV.
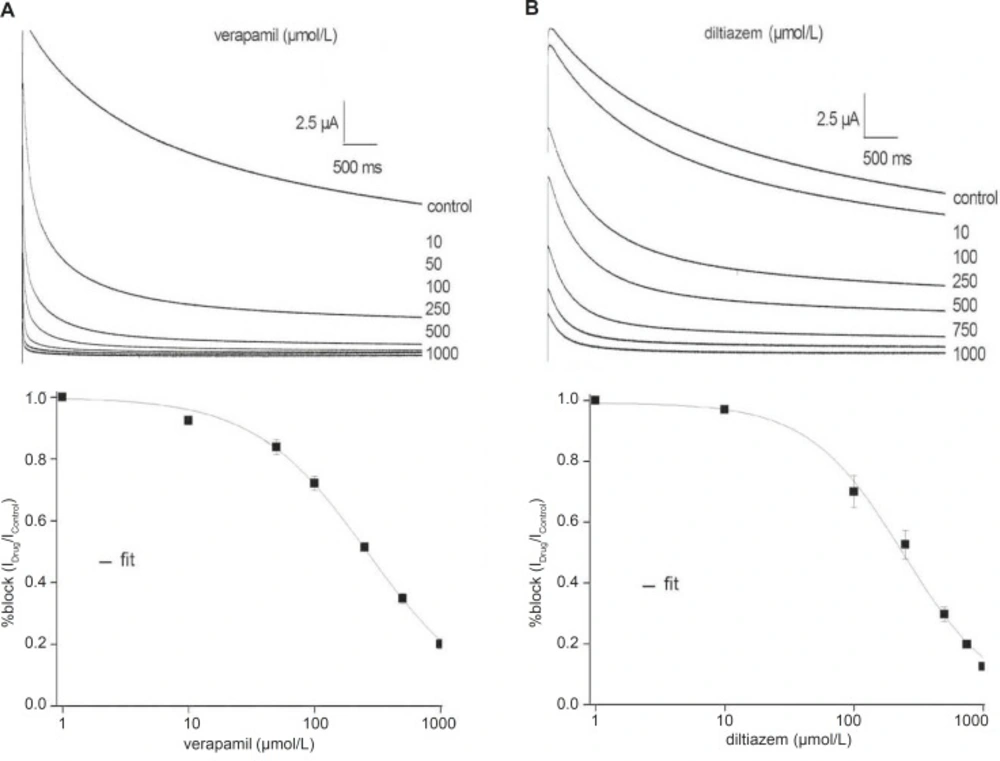
Verapamil and diltiazem inhibit the fKv1.4ΔN currents in a concentration-dependent manner
Figure 2 shows representative fKv1.4ΔN currents superimposed on the variable concentrations of verapamil and diltiazem, between 0 and 1000 μmol/L, in order to evaluate concentration-dependency. The fKv1.4ΔN currents were recorded by depolarizing pulses to +50 mV from a holding potential of –90 mV. For steady-state inhibition, a nonlinear least-squares fit of concentration-response data at +50 mV to the Hill yielded a K
D value of 260.71 ± 18.50 μmol/L (verapamil) and 241.04 ± 23.06 μmol/L (diltiazem) (n = 5).
Concentration-response relationships for the inhibition of the fKv1.4ΔN currents by verapamil (A) and diltiazem (B). Upper panels: Representative current traces were elicited in the absence and presence of increasing concentrations of verapamil (A) and diltiazem (B). Currents were recorded by depolarizing pulses to +50 mV from a holding potential of –90 mV. Lower panels: The peak currents were normalized the maximum peak current under control conditions and plotted against verapamil (A) and diltiazem (B) concentrations. The curves were derived by fitting data to the Hill equation: f = KD/ (KD + D), where f is fractional current, KD is the apparent dissociation constant, and D is the drug concentration. Symbols and error bar are mean ± SEM (n = 5).
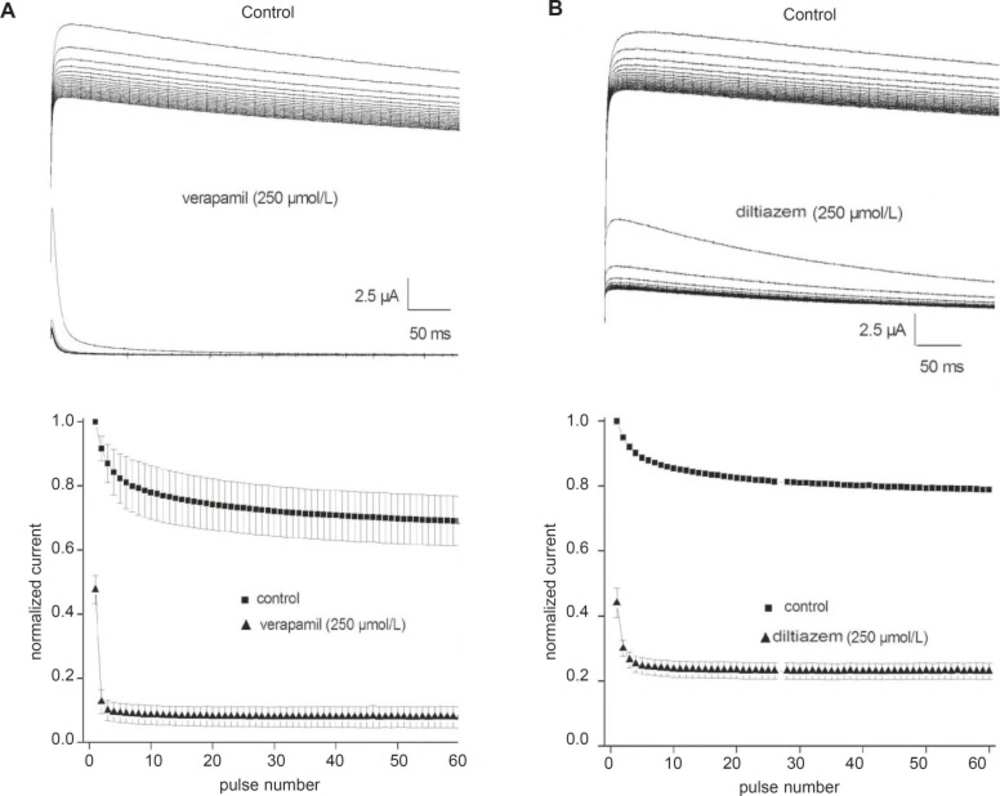
Use-dependent block of the fKv1.4ΔN currents by verapamil and diltiazem
Although 250 μmol/L verapamil and 250 μmol/L diltiazem induced approximately 50% steady-state block, this degree of block may not be attained during a single action potential. Therefore, we tested whether channel blockade by verapamil and diltiazem displayed use-dependence. Trains of 60 depolarizing pulses of 500 ms duration from –90 to +50 mV were applied at a stimulation frequency of 1 Hz, with a 1 min rest period between successive trains. The top panels in
Figures 3A and B show original current records obtained after applying a pulse train protocol in the absence and presence of either 250 μmol/L verapamil or 250 μmol/L diltiazem, respectively. The peak currents were normalized to the maximum control value without drug and plotted in the bottom panels (
Figure 3). Under control conditions, the fKv1.4ΔN currents were decreased by 20- 30%. However, fKv1.4ΔN currents in the presence of verapamil and diltiazem showed greater decay than under control conditions until reaching a steady-state block. The peak amplitudes of the fKv1.4ΔN currents after 60 depolarizing pulses were reduced by 83.4% in the presence of verapamil and by 47.8% in the presence of diltiazem. The degree of use-dependent block induced by verapamil was significantly greater than that induced by diltiazem.
Use-dependent block of fKv1.4ΔN currents by verapamil (A) and diltiazem (B). Upper panels: Sixty repetitive depolarizing pulses from –90 to +50 mV for 500 ms each were applied in the absence and in the presence of verapamil (A) and diltiazem (B). Lower panels: Each peak current was normalized to the peak current at the first pulse under control conditions and then plotted against the number of pulses. Data are shown as mean ± SEM (n = 5).
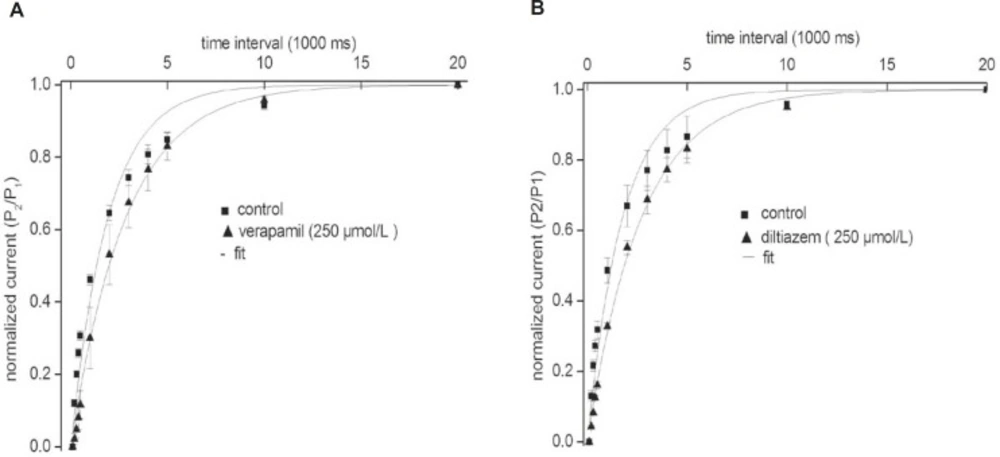
Our results indicate that the recovery of the fKv1.4ΔN channel in the presence of either verapamil or diltiazem was slower than that in the absence of drugs. To investigate this result in more detail, we measured the recovery time from inactivation using a standard gapped-pulse protocol with a variable inter-stimulus interval. The ratio of the magnitude of the first to the second pulse peak current was used as an indication of the degree of the recovery from inactivation.
Figure 4 shows representative curves that were fitted with a mono-exponential function in the absence and in the presence of either 250 μmol/L verapamil (A) or 250 μmol/L diltiazem (B). The recovery time constant was slower in the presence of both drugs: (verapamil) 2.84 ± 0.17 sec, (control) 1.92 ± 0.12 sec (n = 5, p < 0.05); and (diltiazem) 2.66 ± 0.14 sec, (control) 1.73 ± 0.10 sec (n = 5, p < 0.05). Our findings showed that the rates of recovery of the fKv1.4ΔN channel from inhibition by verapamil and diltiazem were slower than the transition rate between the open and closed states in the absence of drugs, which may indicate that both drugs evoke use-dependent inhibition of fKv1.4ΔN currents.
Effects of verapamil (A) and diltiazem (B) on the kinetics of the fKv1.4ΔN channel recovery from steady inactivation. The degree of recovery was measured by following a standard variable interval gapped pulse protocol. An initial 5-second pulse (P1) from –90 to +50 mV was followed by a second pulse (P2) to +50 mV after an interval of between 0.1 and 20 sec. The ratio of the peak current elicited by the P1 and P2 pulses (P2/P1) is plotted as a function of the various interpulse intervals. The continuous line represents the fit of the data to the equation: f = 1 - A*exp(–τ/t), where t is duration (in sec), τ is the time constant, A is the amplitude of the current. Data were normalized between 0 and 1 presented with intervals on a log scale. Data are shown as mean ± SEM (n = 5).
Effects of verapamil and diltiazem on the activation of the fKv1.4ΔN currents
Figure 5 shows representative currents and steady-state activation relationships. The activation curves were measured in the absence and presence of either 250 μmol/L verapamil (A) or 250 μmol/L diltiazem (B), respectively. The peak currents were normalized to the peak current measured at +50 mV and were plotted as a function of the holding potential.
Effects of verapamil (A) and diltiazem (B) on the activation of the fKv1.4ΔN currents. Current traces were obtained by applying 80 ms pulses to potentials ranging from –100 to +50 mV and were followed by tail currents upon repolarization to –40 mV in the absence (upper panels) and in the presence of 250 μmol/L verapamil and 250 μmol/L diltiazem (middle panels). Bottom panels: steady-state activation relationships. The peak currents (measured at +50 mV) are plotted as a function of the holding potential. Continuous lines represent the fit of the data to a Boltzmann equation: f = 1/{1 + exp*[(V – V1/2)/k)]}, where V represents the test potential, V1/2 is the mid-point of activation, and k is the slope factor. Average data are shown as mean ± SEM (n = 5).
We found that verapamil shifted the fKv1.4ΔN steady-state activation curve to the right, with a significant change in V1/2: V1/2 Control = 1.94 ± 1.10 mV; V1/2 Verapamil = 8.97 ± 1.08 mV (n = 5). However, diltiazem did not shift fKv1.4ΔN steady activation curve, and had no significant effect on V1/2: V1/2 Control = 4.03 ± 1.04 mV; V1/2 Diltiazem = 2.08 ± 1.05 mV (n = 5). Thus, there was no effect of diltiazem on the steady activation of the fKv1.4ΔN channel.
Changes in the inactivation kinetics of the fKv1.4ΔN currents by verapamil and diltiazem
To evaluate whether verapamil affects the kinetic properties of the fKv1.4ΔN currents, we analyzed the time course of inactivation and the steady-state inactivation curve in the absence and presence of 250 μmol/L verapamil (
Figure 1). After exposure to 250 μmol/L verapamil, inactivation of the fKv1.4ΔN channel was clearly accelerated. Under control conditions, the inactivation of fKv1.4ΔN fitted well to a single exponential function with a time constant of 2.20 ± 0.07 seconds at +50 mV (n = 5). After exposure to 250 μmol/L verapamil, the time constant was 0.27 ± 0.04 seconds at +50 mV (n = 5). Diltiazem also produced the same effect, as described previously in detail by us (9). After addition of 250 μmol/L diltiazem, the time constant was 1.78 ± 0.29 seconds at +50 mV (n = 5).
We then examined and compared the effects of verapamil and diltiazem on the steady inactivation curve for the fKv1.4ΔN channel (
Figure 6). The membrane potential was held at various levels between –100 mV and +50 mV, and tail currents were obtained upon repolarization to +50 mV. The peak currents were normalized, plotted against the membrane potential, and fitted to a Boltzmann equation. The steady-state inactivation relationships were normalized, as shown in
Figure 6 (upper panels). In the presence of 250 μmol/L verapamil, the steady inactivation curve was shifted to the left: V
1/2 Control = -41.47 ± 4.25 mV; V
1/2 Verapamil = -50.83 ± 4.58 mV (n = 5, p < 0.05). Although 250 μmol/L diltiazem also slightly shifted the steady inactivation curve to the left, V
1/2 was not obviously changed: V
1/2 Control = -38.38 ± 0.81 mV; V
1/2 Diltiazem = –39.23 ± 0.85 mV (n = 5, p > 0.05). These results indicate that verapamil but not diltiazem alters the voltage-dependency of the steady-state inactivation of the fKv1.4ΔN channel.
Changes in the inactivation kinetics of fKv1.4ΔN currents by verapamil (A) and diltiazem (B). Upper panels: Steady-state inactivation was studied using a two-pulse voltage protocol. Currents were measured at +50 mV, and the 5-sec pre-pulses to potential varied from –100 to +50 mV in steps of 10 mV. The curves for steady-state inactivation were fitted with the Boltzmann equation: f = 1/{1 + exp*[(V – V1/2)/k)]}. Where V represents the test potential, V1/2 is the mid-point of inactivation, and k is the slope factor. Lower panels: time constant of inhibition as a function of the drug concentration. Time constants (τblock) were estimated from a single or double exponential fits to the tracings shown in Figure 2. The apparent rate constants for association (k+1) and dissociation (k–1) were obtained from the equation: 1/τblock = k+1[d] + k–1. Data are shown as mean ± SEM (n = 5).
Inactivation of the fKv1.4ΔN currents was best fitted by a single exponential function with a time constant of 2.20 ± 0.07 seconds at +50 mV (n = 5). In the presence of verapamil, the inactivation was best fitted to a bi-exponential function, as the inactivation processes were composed of fast and slow components. The slow component (τslow) was regarded as intrinsic C-type inactivation of the fKv1.4ΔN channel. The fast component (τfast) was thought to represent the time constant for drug-induced blockade of the fKv1.4ΔN currents. After application of 250 μmol/L verapamil, τfast was 0.01 ± 0.002 sec and τslow was 0.27 ± 0.04 seconds (at +50 mV, n = 5). In the presence of diltiazem, the inactivation of fKv1.4ΔN was well fitted to a bi-exponential function, with τfast = 0.41 ± 0.04 sec and τslow = 1.78 ± 0.29 seconds at +50 mV (n = 5). We found that 250 μmol/L verapamil and 250 μmol/L diltiazem accelerated intrinsic C-type inactivation.
The bottom panels of
Figure 6 show τ
fast at +50 mV plotted against the various drug concentrations (τ
fast values were not shown). From this fit (left panel), in the presence of verapamil, an apparent association (k
+1) of 0.07 ± 0.02 μmol/L
–1s
–1, and (k
–1) of 17.16 ± 7.67 s
–1 were obtained. The k
D value derived on the basis of a first-order reaction between the drug and the channel was 242 μmol/L in the presence of verapamil. The k
D value of diltiazem was 267 μmol/L, as described in our previous studies (9).

![Effects of verapamil (A) and diltiazem (B) on the activation of the fKv1.4ΔN currents. Current traces were obtained by applying 80 ms pulses to potentials ranging from –100 to +50 mV and were followed by tail currents upon repolarization to –40 mV in the absence (upper panels) and in the presence of 250 μmol/L verapamil and 250 μmol/L diltiazem (middle panels). Bottom panels: steady-state activation relationships. The peak currents (measured at +50 mV) are plotted as a function of the holding potential. Continuous lines represent the fit of the data to a Boltzmann equation: f = 1/{1 + exp*[(V – V<sub>1/2</sub>)/k)]}, where V represents the test potential, V<sub>1/2</sub> is the mid-point of activation, and k is the slope factor. Average data are shown as mean ± SEM (n = 5).](https://brieflands.com/journals/ijpr/articles/125756/figures/ijpr-12-855-g005-preview.webp)
![Changes in the inactivation kinetics of fKv1.4ΔN currents by verapamil (A) and diltiazem (B). Upper panels: Steady-state inactivation was studied using a two-pulse voltage protocol. Currents were measured at +50 mV, and the 5-sec pre-pulses to potential varied from –100 to +50 mV in steps of 10 mV. The curves for steady-state inactivation were fitted with the Boltzmann equation: f = 1/{1 + exp*[(V – V<sub>1/2</sub>)/k)]}. Where V represents the test potential, V<sub>1/2</sub> is the mid-point of inactivation, and k is the slope factor. Lower panels: time constant of inhibition as a function of the drug concentration. Time constants (τ<sub>block</sub>) were estimated from a single or double exponential fits to the tracings shown in Figure 2. The apparent rate constants for association (k<sub>+1</sub>) and dissociation (k<sub>–1</sub>) were obtained from the equation: 1/τ<sub>block</sub> = k<sub>+1</sub>[d] + k<sub>–1</sub>. Data are shown as mean ± SEM (n = 5).](https://brieflands.com/journals/ijpr/articles/125756/figures/ijpr-12-855-g006-preview.webp)
