Chemicals
Linoleic acid (cis-9,cis-12-octadecadienoic acid), p-nitro-blue tetrazolium chloride (NBT), 5-methylphenazinium methyl sulfate (PMS), nicotinamide adenine dinucleotide (NADH), absolute ethanol, hydrogen peroxide, 2,2-diphenyl-1-picryl-hydrazyl (DPPH•), polyoxyethylene sorbitan monolaurate (Tween-20), 3-(2-pyridyl)-5,6-bis(4-phenyl-sulfonic acid)-1,2,4-triazine (ferrozine), Folin and Ciocalteu’ s phenol reagent (Folin C), α-tocopherol, butylated hydroxyanisole (BHA), and trichloracetic acid (TCA) were purchased from Sigma (Sigma-Aldrich GmbH, Germany). Ammonium thiocyanate, ferrous chloride, potassium hexacyanoferrate (III), ferric chloride and butylated hydroxytoluene (BHT) were purchased from E. Merck. All other chemicals were of analytical grade and obtained from either Sigma-Aldrich or Merck.
Plant material and extraction
UD and MN plants were collected from the Samsun, Turkey, in July-August (2007), and authenticated by Prof. Dr. H. Güray Kutbay, Department of Biology, Faculty of Science and Arts, Ondokuz Mayis University. Then, plants were left on a bench to dry. The dried samples were chopped into small parts with a blender. All the samples were subjected to extraction using soxhlett extractor, with a mixture of ethanol and double-distilled water (4:1, 3x). Then the extracts were filtered over Whatman No.1 paper. The filtrates were frozen and lyophilized in a lyophilizator (Christ Alpha 1-2 LD Plus) at 10 μmHg pressure at - 50oC. The extracts of plants were placed in a plastic flask, and then kept at - 20oC until used.
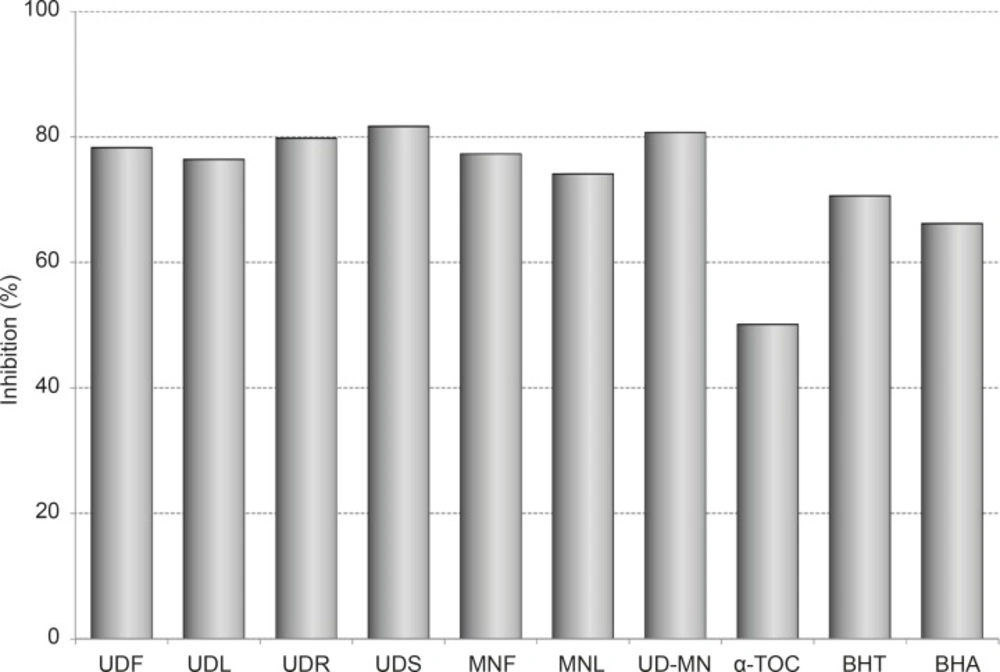
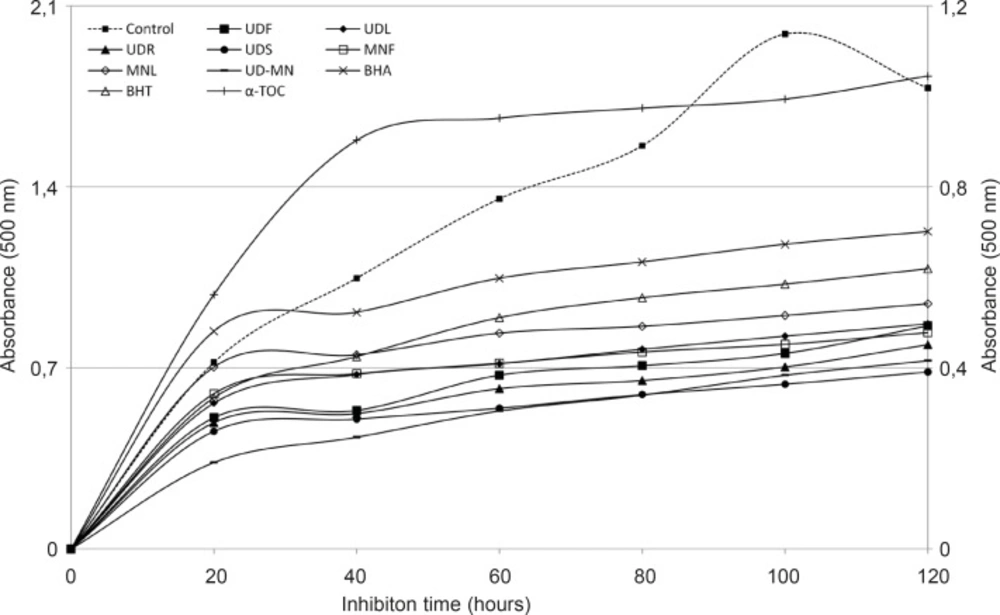
Total antioxidant activity determination
Total antioxidant activity of extracts was determined according to the FTC method (
22). For stock solutions, 10 mg of each extracts were dissolved in 10 mL of distilled water. A volume of 2.5 mL extract or standard solutions at the same concentration (100 μg/mL), was added to linoleic acid emulsion in phosphate buffer (0.02 M, pH = 7.0). Each solution was then incubated at 37
oC in the dark. A mixture of 0.1 mL of this incubation solution, 0.1 mL of FeCl
2 (0.02 M) and 0.1 mL of ammonium thiocyanate (30% w/v) was transferred to the test tubes, which containing 4.7 mL of ethanol (75% w/v). Then, these solutions were incubated for 3 min. Finally, the peroxide level was determined through reading the absorbance at 500 nm in a spectrophotometer (Unicam UV2-100). This step was repeated every 10 h until the control reached its maximum absorbance value. All data on total antioxidant activity are the average of duplicate analyses. The inhibition of lipid peroxidation in percentage was calculated through the following equation:
%Inhibition = [1 - (As/Ac)] × 100
Here,
Ac is the absorbance of control reaction which contains only linoleic acid emulsion and phosphate buffer and
As is the absorbance of samples (extracts) or standards (
23).
Ferric ions (Fe3+) reducing antioxidant power assay (FRAP)
Reducing the power of extracts was determined according to the method of Oyaizu (
24). The different concentrations (50-250 μg/mL) of extracts were mixed with 2.5 mL of phosphate buffer (0.2 M, pH = 6.6) and 2.5 mL of potassium hexacyanoferrate (III) (1%). The mixture was incubated at 50
◦C for 20 min. A portion (2.5 mL) of TCA (10%) was added to the mixture, which was then centrifuged for 10 min at 3000 rpm (MSE Mistral 2000, UK). The upper layer of solution (2.5 mL) was mixed with 2.5 mL of distilled water and 0.5 mL of FeCl
3 (0.1%). The Fe
3+/Fe
2+ transformation was investigated in the presence of extracts or standards and the absorbance values were measured at 700 nm in a spectrophotometer.
Reducing Power (%) = (As / Ac) × 100
Here, Ac is the absorbance of control (L-ascorbic acid) and As is the absorbance of samples (extracts) or standards.
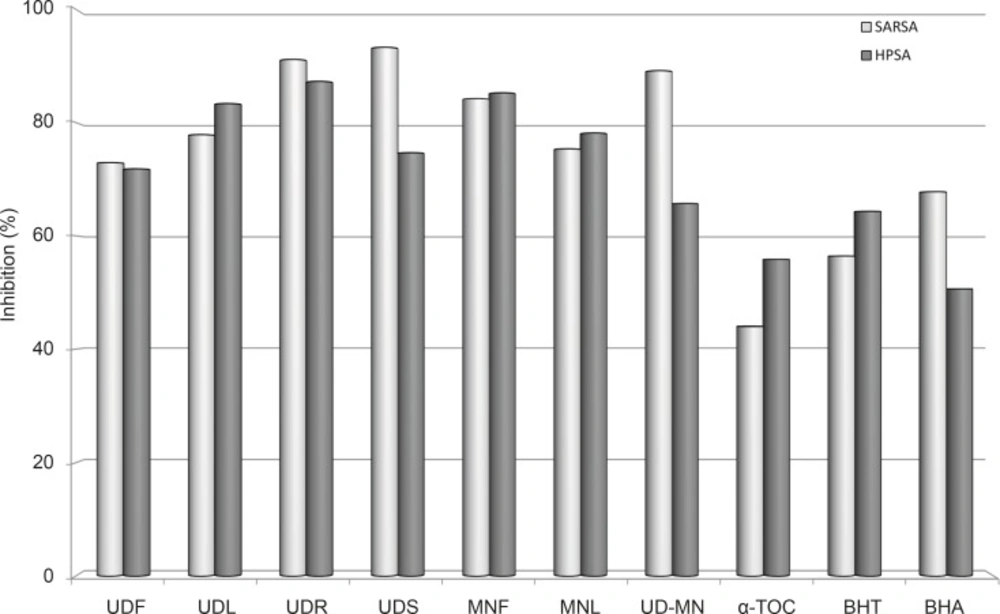
Superoxide anion radical scavenging activity
Superoxide anion scavenging activity of extracts was determined according to the method of Liu (
25). In this experiments, the superoxide radicals were produced in 3 mL of Tris-HCl buffer (16 mM, pH = 8.0) containing 1 mL of NBT (50 μM) solution, 1 mL of NADH (78 μM) solution and 1 mL of extract solutions (100 μg/mL) were mixed. The reaction was started by adding 1 mL of PMS solution (100 μM) to the mixtures. The reaction mixtures were incubated at 25
oC for 5 min and the absorbance was measured at 560 nm in a spectrophotometer. The inhibition was calculated from the following formula:
Inhibition of superoxide anion generation (%) = [1 - (As / Ac)] × 100
Here,
Ac is the absorbance of the control, and
As is the absorbance of samples (extracts) or standards (
26).
Hydrogen peroxide scavenging activity
The activity of the extracts to scavenge the hydrogen peroxide was determined according to the method of Ruch (
27). Extract solutions (100 μg/mL) were added to 0.6 mL of hydrogen peroxide solution (40 mM, in phosphate buffer with pH of 7.4). Hydrogen peroxide concentration was determined after 10 min against a blank solution with measurement of absorbance at 230 nm in a spectrophotometer. The percentage of scavenging the hydrogen peroxide of extracts and standards were calculated using the following equation:
Scavenged % (H2O2) = [1 - (As/Ac)] × 100
Here, Ac is the absorbance of the control and As is the absorbance in the presence of the samples (extracts) or standards. Triplicate samples were run for each set and averaged.
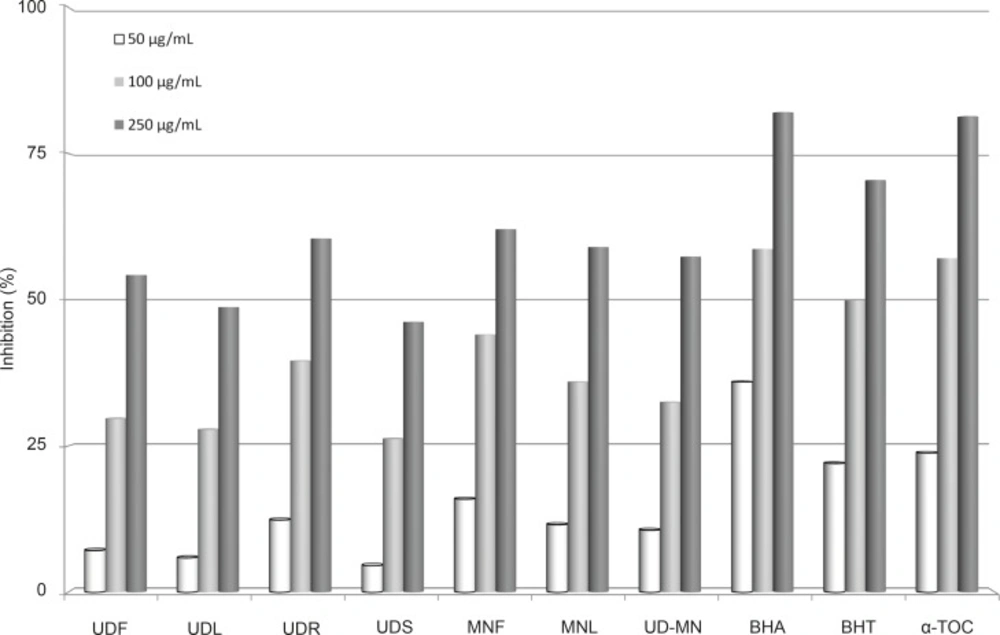
Free radical scavenging activity
The free radical scavenging activity of extracts was measured by DPPH
• using the method of Shimada (
28). 1 mL of DPPH
• solution (0.2 mM, in ethanol) was added to 3 mL of extract solutions at different concentrations (50-250 μg/mL). The mixtures were shook forcefully and allowed to stand at room temperature for 30 min. Then the absorbance was measured at 517 nm in a spectrophotometer. Control tube (containing no sample or standard) was also noted like these of samples.
Free Radical Scavenging Activity % (DPPH•) = [1 - (As / Ac)] × 100
Here, Ac is the absorbance of the control and As is the absorbance of the samples (extracts) or standards.
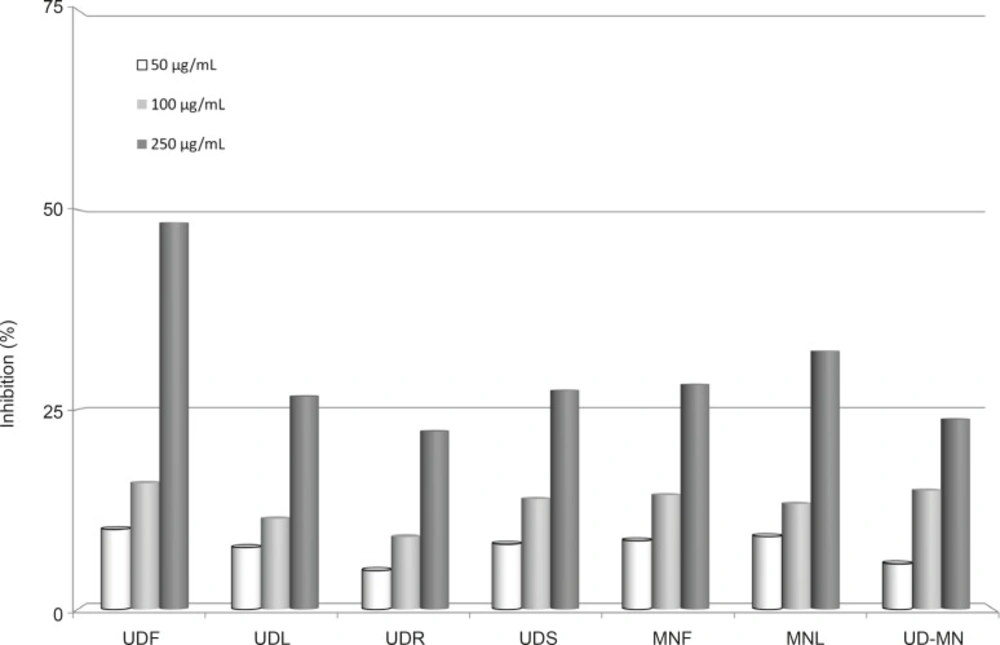
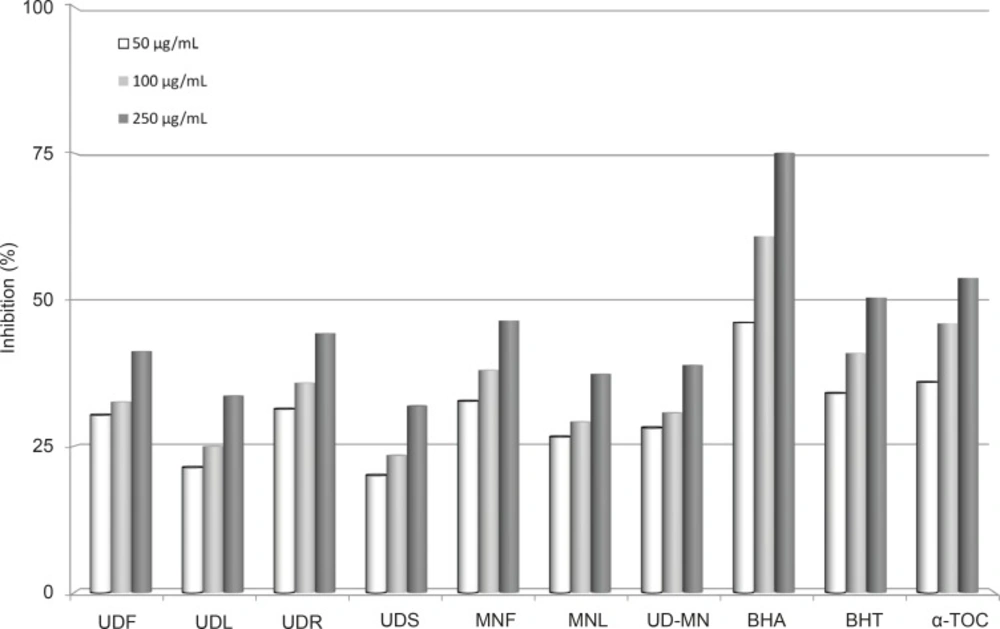
Metal chelating activity
Metal chelating of ferrous ions by the extracts and standards was estimated through the method of Dinis (
29). A volume of 0.1 mL FeCl
2 solution (2 mM) was added to 5 mL of extract solutions at different concentrations (50-250 μg/mL). The reaction was started via the addition of 0.2 mL ferrozine (5 mM) and the mixtures were shaken forcefully and left standing at room temperature for 10 min. The absorbance was measured at 562 nm in a spectrophotometer. The control contained FeCl
2 and ferrozine with complex formation molecules.
Inhibition (%) = [1 - (As/Ac)] × 100
Here, Ac is the absorbance of the control and As is the absorbance of the samples (extracts) and standards. Triplicate samples were run for each set and averaged.
Determination of total phenolic compounds
Total phenolic compounds were determined with Folin C reagent according to the method of Slinkard and Singleton (
30). The solutions of extract (1000 μg/mL) were prepared and each solution was diluted with 46 mL of distilled water. A volume of 1 mL Folin C reagent was added and the content of the flask mixed thoroughly. After 3 min, 3 mL of Na
2CO
3 (2 %) was added and then allowed to stand for 2 h with intermittent shaking. The absorbance was measured at 760 nm in a spectrophotometer. The total phenolic compounds determined as microgram of catechin equivalent that was obtained from standard graph (
r2 = 0.9941).
Determination of total flavonoid contents
The total flavonoid was determined according to the colorimetric method (
31). First of all, each powder product (0.1 g) derived from lyophilized plant extracts was dissolved in 0.1 mL of ethanol. This solution was placed in a 10 mL volumetric flask. Double-distilled water (ddH
2O) was added to make 5 mL and 0.3 mL of 20% NaNO
2 was added. Then, 3 mL of 10% AlCl
3.6H
2O was added 5 min later. After 6 min, 2 mL of NaOH (1 M) was added and the total volume was made up to 10 mL with ddH
2O. The solution was mixed well again and the absorbance was measured at 510 nm in a spectrophotometer. The total flavonoid contents determined as microgram of catechin equivalent that was obtained from standard graph (
r2 = 0.9978).
Statistical analysis
Experimental results were given as mean ± SD of the three parallel measurements. The experimental values were evaluated using the one-way analyses of variance (Tukey test). P-values < 0.01 were regarded as very significant and p-values < 0.05 were regarded as significant. Both operations were done with SPSS 11.5.