
Introduction
Stress-induced hyperglycemia is a common finding in critically ill patients (1). Although hyperglycemia is frequently seen in patients with diabetes mellitus (2), approximately 12% of hyperglycemic patients admitted to tertiary care facilities had no prior history of diabetes (3). Hyperglycemia in critically ill patients increases susceptibility to infections and vital organs deficiency (4).
Systemic inflammatory response to infection is frequently associated with tissue injury and organ failure in critically ill patients (5). In some patients, balance between pro-inflammatory and anti-inflammatory mediators is upset with an excessive pro-inflammatory response resulting in the systemic inflammatory response syndrome (SIRS), multi-system organ dysfunction and ultimately death (6).
Insulin administration is used in critically ill patients to improve clinical outcomes (7). It has been suggested that glycemic control with intensive insulin therapy may restore the balance between pro-inflammatory and anti-inflammatory mediators, and decrease mortality in critically ill patients (8). However, insulin resistance is a central feature of stress metabolism in postoperative patients, trauma patients, sepsis and critical illness in general (1, 9). It has been shown that metformin as an oral anti-hyperglycemic agent increases glucose uptake during insulin resistance (10).
Insulin resistance and hyperglycemia in intensive care units (ICU) is seen along with systemic inflammatory response (5). It has been stated that insulin resistance and hyperinsulinemia can lead to an increased risk of microalbuminuria and progressive loss of renal function (11). Microalbuminuria was initially used to predict the onset of chronic renal failure in diabetic patients, but there are several studies that have described a rapid increase in urine albumin excretion in acute inflammatory conditions, which appears to be related to systemic vascular damage (12, 13). The aim of the present study was to evaluate the microalbuminuria as a predictor of outcome in critically ill patients with SIRS and hyperglycemia, for which two different types of anti-hyperglycemic treatments, insulin or metformin were administered.
Experimental
Between April 2006 and October 2007, this cross-sectional study was carried out in the ICU of our university hospital. The included criteria consisted of patients admitted because of trauma, no history of diabetes mellitus, blood sugar (BS) level more than 130 mg/dL, and presence of SIRS. This syndrome was defined as presence of at least two of the following criteria (14): fever or hypothermia (38 °C < T < 36 °C), leukocytosis or leucopenia (12000/mm3 < white blood cell count < 4000/mm3 or Band cell > 10%), tachypnea (RR > 20/min or PCO2 < 32 mmHg), and tachycardia (HR > 90 beat/min). The excluded criteria were consisted of age less than 18 or more than 75 years old, chronic renal failure (CRF, Creatinine > 1.2 mg/dL), bicarbonate < 13 meq/L, lactate > 4.5 mmol/L, mean arterial pressure (MAP) < 70 mmHg, creatinine clearance < 70 mL/min, pH < 7.3, and diabetic patients.
From the thirty-one included patients, eight of them were dropped out during the first 12 h of the study due to severe hemodynamic instability. Therefore, 23 patients remained until the end of the study period (three days). These patients were randomized to receive one of the following two treatments:
1. Intravenous administration of insulin (50 IU regular insulin); the rate of insulin infusion started in accordance with the first BS. The subsequent adjustments of insulin infusion rate were carried out based on the BS levels, which were checked every two hours by glucometer (Roche Accu-Check comfort or active system). If insulin therapy lowered BS, then its infusion would decrease. In contrast, the rate of insulin infusion would increase if the BS level increased or if insulin resistance existed.
2. Oral metformin that was administered twice daily (1000 mg). If the amount of BS in two subsequent evaluations were more than 300 mg/dL, that patient would be excluded from the study.
Physiologic condition of patients was assessed by APACHE II (acute physiological and chronic health evaluation) (15). This system measures the severity of disease in scales between 0 and 71, where the increase of score shows severity of disease and risk of death. APACHE derives from twelve routine physiological assessments including: blood pressure, temperature (rectal), heart rate, respiratory rate, oxygenation (PaO2 and FIO2), arterial pH, serum HCO3-(mEq/L), serum sodium (mEq/L), serum potassium (mEq/L), serum creatinine (mg/dL), hematocrit (%) and white blood count.
For determination of patients’ consciousness level, GCS (glasgow coma scale) was applied. This neurologic scale ranges from 3 (deep coma or death) to 15 (complete consciousness).
Measurement of microalbumine and creatinine in urine and microalbumine to creatinine ratio (MACR)
Urine samples were collected from patients in the times of 0 (before starting the treatments) and 4, 6, 12, 24, 36, 48, 50 and 72 h after the first dose administration in each protocol. Technicon RA-XT autoanalyzer (Technicon Corp., NY, USA) was used for measuring microalbumine by immunoassay turbidimetric method (mg/L) and creatinine by Jaffe method (mg/dL). Microalbuminuria/creatinine ratio (MACR) was calculated using the values of microalbumine and creatinine in each evaluated time.
Statistical analysis
The data were analyzed using SPSS for Windows Version 13 (SPSS Inc, Chicago, IL, USA). Mann-Whitney Test was used for evaluation of statistical differences between continuous data of both groups. Linear correlation between MACR and other experimental and clinical variables was assessed using the Spearman’s correlation coefficient. Values for p less than 0.05 were considered statistically significant.
The study protocol was in conformity with the ethical guidelines of the 1975 Declaration of Helsinki (16).
Results
Thirteen patients were treated by insulin (protocol A) and 10 patients by metformin (protocol B). There was no significant difference regarding the clinical and experimental findings between the two studied groups at the beginning (Table 1).
| Insulin (Protocol A) | Metformin (Protocol B) | |||
|---|---|---|---|---|
| Day 0 | Day 3 | Day 0 | Day 3 | |
| Age (year) | 45.23 ± 7.14 | 39.47 ± 6.82 | ||
| Mean arterial pressure, mmHg | 89.64 ± 18.9 | 90.41 ± 15.9 | 91.75 ±11.73 | 87.81 ± 16.37 |
| HCO3 | 23.51 ± 2.21 | 21.80 ± 1.5 | 23.81 ± 1.11 | 23.16 ± 2.8 |
| pH | 7.39 ± 0.09 | 7.37 ± 0.08 | 7.38 ± 0.07 | 7.40 ± 0.1 |
| WBC | 6300 ± 320 | 5200 ± 211* | 7600 ± 349 | 5100 ± 226* |
| Sodium (mEq/L) | 149.77 ± 10.3 | 148.27 ± 6.3 | 147.33 ± 12.51 | 145.19 ± 8.66 |
| Potassium (mEq/L) | 3.6 ± 0.84 | 4.12 ± 0.92 | 4.33 ± 1.06 | 4.1 ± 0.88 |
| Blood sugar mg/dL | 152.3 ± 15.32 | 136.7 ± 10.2 | 171.69 ± 28.5 | 131.8 ± 18.0* |
| creatinine mg/dL | 0.72 ± 0.07 | 0.74 ± 0.06 | 0.7 ± 0.07 | 0.72 ± 0.08 |
| GCS | 9.0 ± 3.12 | 10.02 ± 4.63 | 8.47 ± 4.63 | 9.73 ± 5.12 |
| APACHE II | 21.36 ± 5.42 | 21.53 ± 6.1 | 19.11 ± 3.42 | 20.41 ± 3.45 |
Clinical and laboratory findings in patients of metformin or intensive insulin treatment groups before and after treatment
Comparison of urine volume, microalbuminuria, creatinine, and MACR between the two studied groups at the beginning of the study did not show any statistically significant difference as well.
Figure 1 shows urine volume during the three-day period in the two studied group. No statistically significant difference was observed with regard to this variable between two groups.
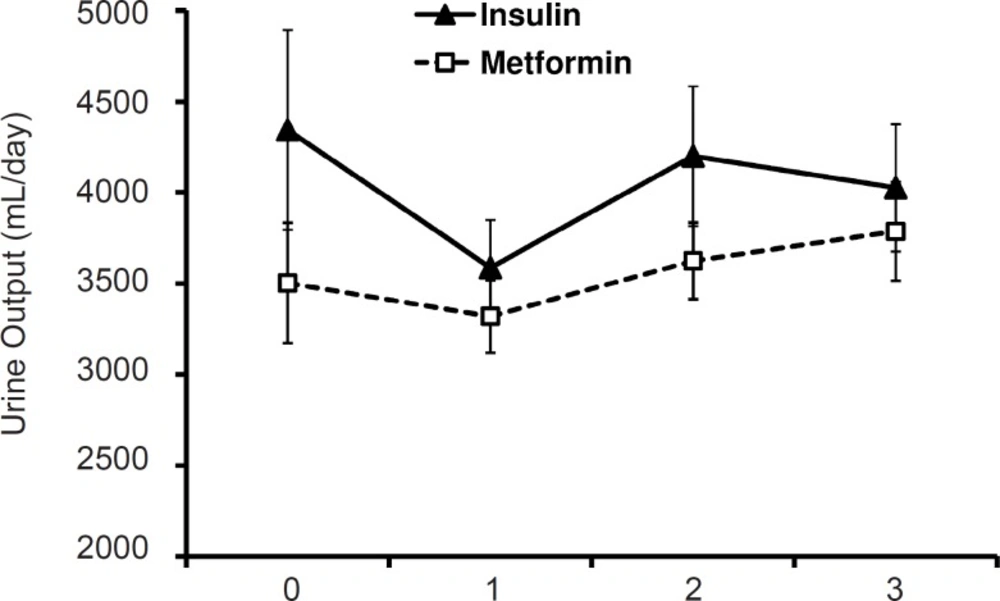
Mean urinary output in the two groups during the study period
MACR (mg/mmol)
Comparing mean values of different times of evaluations in insulin treated group MACR was not significant. Similar results were also obtained for metformin treated group. Comparison of MACR between insulin and metformin groups, also did not show any significant difference, but in the time of 6 and 48 h the difference was significant (p < 0.01, Figure 2). The value of MACR on 6 and 48 h after first administration was 17.72 ± 1.53 and 25.85 ± 2.81 in insulin treated patients, and 13.02 ± 2.11 and 18.94 ± 1.36 in metformin treated group. Total mean of MACR was 21.03 ± 1.16 and 18.68 ± 1.5 in insulin and metformin treated patients respectively (Figure 2).
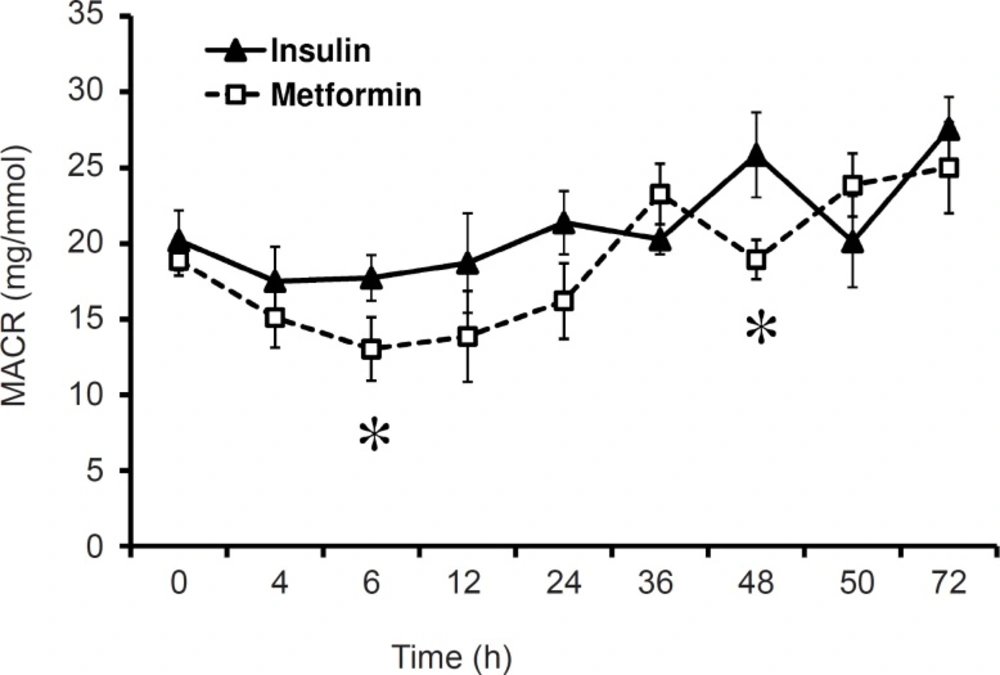
Mean values of microalbumine to creatinine ration (MACR) in the two groups
Blood sugar correlation with MACR
The mean level of BS along three days of treatment was 140 mg/dL in insulin treated group and 148 mg/dL in metformin treated group. Although the mean level of BS in metformin treated group was more than that of insulin treated groups, the difference was not significant (Table 1). In insulin treated group the mean level of BS in the first day of admission was 152.36 ± 15.32 mg/dL which decreased to 136.75 ± 10.27 mg/dL in the third day of insulin treatment and the difference was not considerable. In metformin treated group, metformin reduced BS from 171.69 ± 18.5 mg/dL in the first day of admission to 131.88 ± 8.06 mg/dL in the third day (p < 0.05) (Table 1).
There was a significant positive correlation between BS levels and MACR in insulin treated group (pearson correlation p < 0.05, R2 = 0.131) (Figure 4) and metformin treated patients (Pearson correlation p < 0.05, R2 = 0.127) (Figure 3).
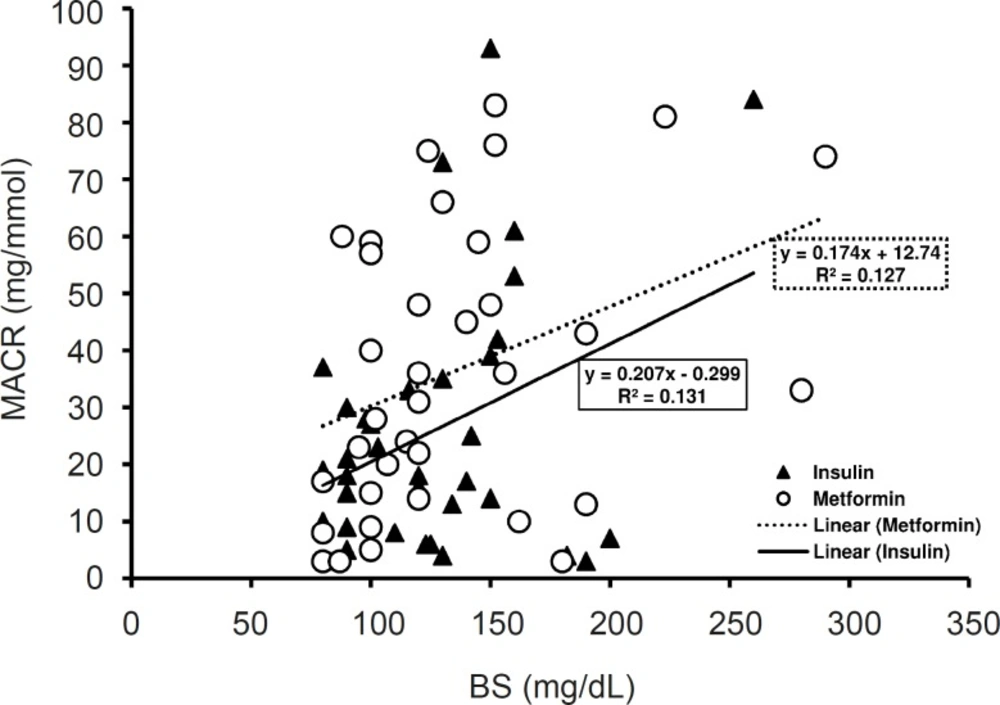
Correlation between blood sugar levels and microalbumine to creatinine ration (MACR) in the two studied groups
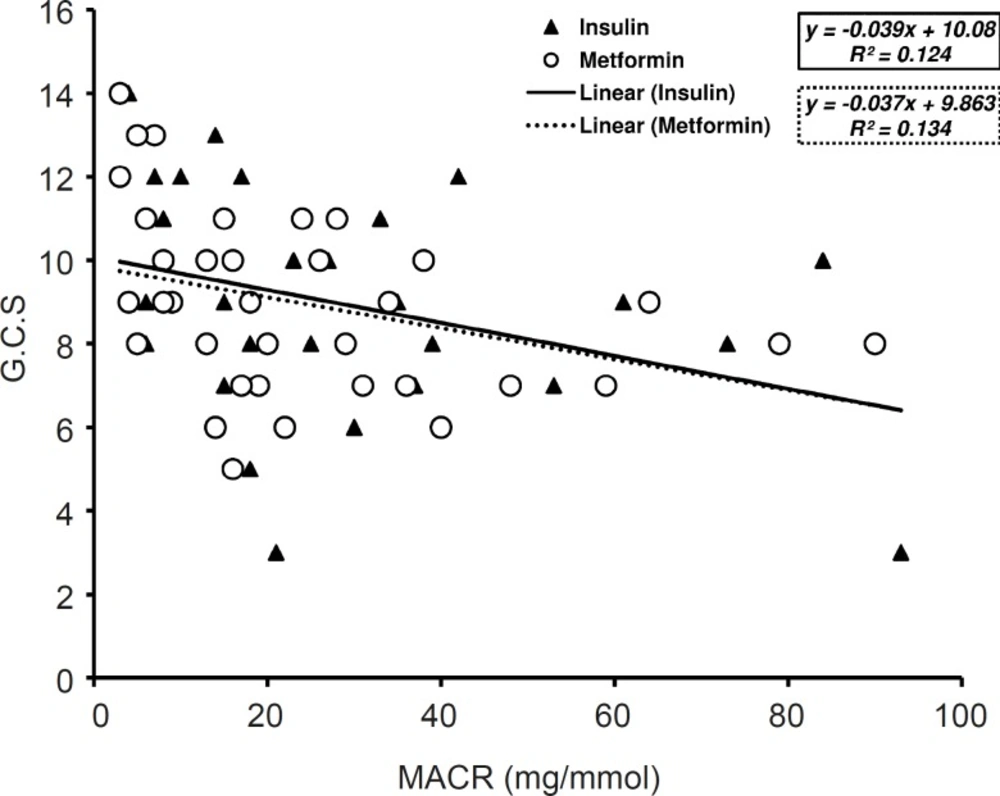
Correlation between microalbumine to creatinine ration (MACR) and Glasgow Coma Scale in the two studied groups
MACR correlation with APACHE II and GCS
Along three days of treatment, APACHE II did not change significantly either in insulin treated group or in metformin administrated patients. GCS value was increased by insulin or metformin treatment after three days of treatment but there was no major difference between in both groups. The value of GCS along three days of treatment with insulin was greater than the values on metformin treated patients (9.05 ± 2.55 and 8.94 ± 2.16) however; statistical analysis has not shown any significant difference between groups.
GCS and APACHE II values have considerable correlation with MACR in metformin treated patients (p < 0.05, R2 = 0.134) (Figure 4) and (p < 0.05, R2 = 0.149) (Figure 5). Nevertheless, in insulin treated patients only the values of GCS had significant correlation with MACR data (p < 0.05, R2 = 0.124) (Figure 4) and there was not significant correlation between those of APACHE II and MACR in this group (R2 = 0.088) (Figure 5).
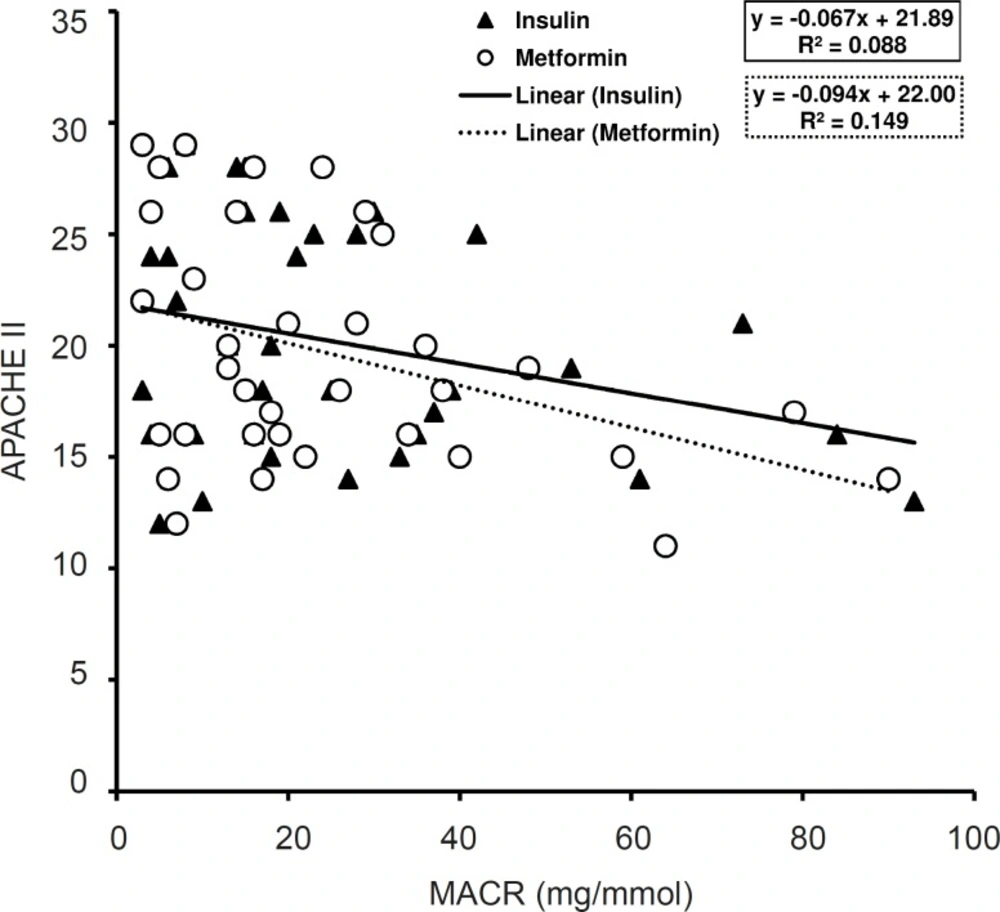
Correlation between microalbumine to creatinine ration (MACR) and APACHE II in the two studied groups
Other experimental evaluations
Other experiments include those mentioned on the Table 1, statistically remained unchanged along three days of treatment, except the WBC that reduced significantly both in insulin treated group and metformin treated patients after three days of treatment (p < 0.05) (Table 1) where the differences between two groups of treatment was not considerable. Moreover, there was not any significant correlation between these factors and the values of MACR along three days of treatment with insulin and metformin.
Discussion
It was found that mean MACR had positive correlation with BS levels in traumatized critically ill patients with SIRS that treated with metformin or insulin for three days. The effect of metformin treatment on reducing mean MACR was higher than that of insulin. The severity of disease measured by APACHE II and GCS reciprocally correlated with MACR values and this correlation was greater in metformin treated patients than that of insulin group.
Our findings are in accordance with that of previous studies. In a study of 140 patients admitted to ICU, microalbuminuria was compared with mortality and APACHE II and showed that for surgical, trauma, and burn patients, microalbuminuria within 15 min of ICU admission predicted death as well as APACHE II calculated after 24 h. It was suggested that MACR could be a predictor of clinical outcome (17). In another study, probability of death for patients with high MACR was calculated and it was proposed that a rapid indication of outcome could be obtained within 6 h of ICU admission using this parameter (18). In septic surgical patients, MACR significantly increased as soon as sepsis appeared and the MACR positively correlated to the sepsis severity score while patients that had not been developing sepsis did not show any increase in the MACR (19).
Insulin resistance is a central feature of stress metabolism in postoperative patients, trauma patients, sepsis, and critical illness in general (9). A recent study by Whaley-Connell et al. (11) revealed that insulin resistance and hyperinsulinemia could lead to an increased threat of microalbuminuria and progressive loss of renal function. Likewise, results of the present study showed significantly higher levels of MACR in insulin treated group when compared to MACR levels in metformin treated patients at 6 and 48 h after the beginning of treatments. In a study carried out to determine correlation between microalbuminuria and outcome in patients with extensive burns, it was demonstrated that mean MACR of more than 20 mg/mmol is associated with poorer outcome and mortality (20).
It has been shown that glucose is a powerful pro-inflammatory mediator (21), and tight glucose control below 110 mg/dL exerted anti-inflammatory effects in the critically ill patient (22). In addition, it has been shown that in healthy volunteers, oral administration of glucose increased reactive oxygen species (ROS) generation by immune cells (23). Metformin has been showed that significantly accelerates glucose clearance and attenuates hyperglycemia, predominantly by improving hepatic and peripheral tissue sensitivity to insulin without affecting the secretion of this hormone (24). Furthermore, it has been shown that in patients with hyperinsulinemia, glucose uptake significantly increases by metformin treatment (25, 26). Co-administration of metformin plus insulin appears to decrease the incidence of insulin resistance, decrease insulin requirement and consequently decrease the incidence of adverse effects related to high-dose insulin therapy (27). All of these previous studies confirm the low level of MACR in metformin treated critically ill patients when compared to insulin group.
In conclusion, the results of this study suggested a useful predictor role for MACR that could be used instead of the widely used APACHE II score, which requires input of a large number of variables derived from the patient’s history, physical examination, and initial laboratory data. Moreover, the main finding of the present study was the considerable role of metformin compared to that of insulin in treatment of hyperglycemia and reduction of MACR in traumatized critically ill patients. However, a limitation of this study included small sample size, and therefore prospective trials with larger sample size of patients should be carried out.
