
Introduction
Chitinases are the enzymes responsible for the biological degradation of chitin (1). These enzymes are produced by a wide range of organisms including bacteria, fungi, plants, insects, crustaceans and vertebrates (2-5). Bacteria produce chitinolytic enzymes to meet nutritional needs. In fungi, insects and crustaceans, these enzymes are involved in morphogenesis. In plants and probably vertebrates, they play a role in defense mechanism against pathogens. Chitinases have found many industrial and pharmaceutical applications including biocontrol of plant pathogenic fungi and insects, production of chitooligosaccharides, and management of chitinous wastes (6, 7).
In microorganisms, chitinase production is controlled by a receptor-inducer system; therefore, the composition of the culture medium can affect chitinase production (7). The conventional method for medium optimization involves changing one parameter at a time while keeping all others constant. This method may be very expensive and time consuming. In addition, it fails to determine the combined effect of different factors. A number of statistical experimental designs have been used to address these problems (8). Among theses, full factorial designs provide more complete information, but they require lots of experiments (Lk, where k is the number of variables and L is the number of levels for each variable) which makes them impractical when a large number of variables are to be studied. The Plackett-Burman design (9), as a two level fractional factorial design, is especially useful in screening studies by estimating the main effects of k variables in just k + 1 experiments according to a linear model. However, this design does not consider the interaction between variables. The variables screened by Plackett-Burman design may be optimized by using statistical and mathematical optimization tools such as Response Surface Methodology (RSM) (10). This empirical technique enables to evaluate the relationship between independent variables and to predict the response in an effective experimental design. In recent years, the use of statistical experimental design in medium optimization has gained considerable attention and a number of publications describing the application of such methods in chitinase production have appeared in the literature (11-19). The aim of this study was to screen and optimize the most important factors affecting the production of chitinase by Bacillus pumilus using Plackett-Burman design and RSM. To our knowledge, this approach has not been used in medium optimization for the production of chitinase by this microorganism.
Experimental
Media and Culture condition
The basal medium used for fermentation contained the following constituents (g/L): powder chitin (2.5), yeast extract (0.25), (NH4)2SO4 (0.1), MgSO4.7H2O (0.05), CaCl2.2H2O (0.025), NaCl (0.5), KBr (0.05), MnCl2.4H2O (0.0005), ZnSO4.7H2O (0.0005), and FeSO4.7H2O (0.01), pH 6.5. Chitin agar medium containing (g/L): Na2HPO4 (0.65), KH2PO4 (1.5), NaCl (0.5), NH4Cl (0.25), MgSO4.7H2O (0.12), CaCl2.2H2O (0.005), colloidal chitin (5.0), and agar (20), pH 6.5 was used for screening the bacterial strains in plates (20).
A single colony of U5 was inoculated into 25 mL nutrient broth medium and incubated at 30°C until optical density at 600 nm reached 1. This pre-culture was used to inoculate 100 mL of the production medium in a ratio of 5% (v/v). Cultures were then incubated at 30°C, 150 rpm for 8 days using 500 mL Erlenmeyer flasks. All experiments were carried out in triplicates.
Screening for chitinase producing microorganisms
Soil samples (1 g) were shaken in sterile distilled water (100 mL) containing Tween 80 (0.5%, v/v) for 30 min, and 0.1 mL of the suspension was inoculated onto chitin agar plates, followed by incubation at 30°C for 10 days. After this period, plates were examined for formation of clearing zones (CZ). Both the size of the CZ and the colony size (CS) were determined.
Identification of the isolate
The isolate used in this study was identified as B. pumilus based on 16S rDNA sequence analysis. In order to obtain genomic DNA bacterial cells were harvested from an overnight culture, washed three times with apyrogen sterile distilled water, and boiled for 10 min to release DNA. The suspension was centrifuged at 14000 rpm for 5 min and the supernatant was used as DNA template for PCR amplification of the 16s rDNA gene. A large fragment of the 16s rDNA gene was amplified using primers 27F (5’-AGAGTTTGATCCTGGCTCAG-3›) and 1492R (5›-TACGGTTACCTTGTTACGACTT-3›), and the first 500 bp were sequenced with primers 27F and 517R (5›-GTATTACCGCGGCTGCTGGC-3›) (21). The PCR amplification program included an initial denaturation at 94°C for 180s , 30 cycles of [denaturation 94°C for 60 s, annealing 60°C for 45 s, and extension 72°C for 90 s], and a final extension at 72°C for 90 s. The obtained sequence was subjected to an NCBI BLAST search.
Enzyme assay
The culture broth was centrifuged at 14000 rpm for 5 min and the supernatant was used as enzyme solution for determining enzyme activity. Chitinolytic activity was determined by estimating the amount of p-nitrophenol (pNP) released from p-nitrophenyl-N-acetyl-β-D-glucosaminide (pNP-GlcNAc) according to the method of Roberts and Selitrennikoff (22) with minor modifications. The reaction mixture consisted of 0.5 mL enzyme solution, 0.5 mL 10 mM pNP-GlcNAc solution, and 0.5 mL 0.1 M citrate-phosphate buffer pH 5.5. The mixture was incubated at 60°C for 30 min. The reaction was stopped by adding 0.5 mL 1 M Na2CO3 to the mixture. The release of pNP was spectrophotometrically measured at 400 nm, and enzyme activity was calculated using a standard curve for known concentrations of pNP. One enzyme unit was defined as the amount of enzyme that can release 1 μmole pNP per hour under assay conditions.
Experimental design and statistical analysis for optimization
Optimization of medium components for chitinase production by B. pumilus isolate U5 was performed in two stages. At the first stage, the components that have significant effect on enzyme production were identified. At the second stage, the optimum values of these components for chitinase production were determined.
Screening design
Initial screening of the most important components affecting chitinase production by B. pumilus was performed by Plackett-Burman design. A total number of ten components were selected for this study, with each being represented at two levels, high (+1) and low (-1) as shown in Table 1.
Table 1Values for the Plackett-Burman design
| Variable | Component | -1 Value (g/L) | +1 Value (g/L) |
|---|---|---|---|
| X1 | Powder chitin | 0.500 | 5.00 |
| X2 | Yeast extract | 0.020 | 0.50 |
| X3 | (NH4)2SO4 | 0.020 | 0.20 |
| X4 | MgSO4.7H2O | 0.010 | 0.10 |
| X5 | CaCl2.2H2O | 0.005 | 0.05 |
| X6 | NaCl | 0.010 | 1.00 |
| X7 | KBr | 0.010 | 0.10 |
| X8 | MnCl2.4H2O | 0.0001 | 0.001 |
| X9 | ZnSO4.7H2O | 0.0001 | 0.001 |
| X10 | FeSO4.7H2O | 0.0020 | 0.02 |
In this design, it is assumed that the main factors have no interactions and a first-order multiple regression model is appropriate:
Y = β◦ + Σβixi (i = 1, …, k) Equation (1)
Where Y is the response function (chitinase production) and βi is the regression coefficient. In Table 2, the design matrix built by the statistical software package Design-Expert 7.0.0 (Stat-Ease, Inc., Minneapolis, MN, USA) for the evaluation of eleven variables in twelve experiments is presented. Variables X1 through X10 represent the medium components and D represents a dummy variable. In order to detect the curvature that may exist in the model, five replicates in the center point were also performed (trials 13 to 17). The main effect of each variable was determined according to Equation 2.
Equation (2)
Table 2Plackett-Burman design matrix (trails No. 1 to 12) and center point experiments (trails No. 13 to 17) with corresponding results
| Trial No. | Variable | Chitinase activity (U/100 mL) | ||||||||||
|---|---|---|---|---|---|---|---|---|---|---|---|---|
| X 1 | X2 | X3 | X4 | X5 | X6 | X7 | X8 | X9 | X10 | D | ||
| 1 | +1 | +1 | -1 | +1 | +1 | +1 | -1 | -1 | -1 | +1 | -1 | 94.49 |
| 2 | -1 | +1 | +1 | -1 | +1 | +1 | +1 | -1 | -1 | -1 | +1 | 69.86 |
| 3 | +1 | -1 | +1 | +1 | -1 | +1 | +1 | +1 | -1 | -1 | -1 | 76.73 |
| 4 | -1 | +1 | -1 | +1 | +1 | -1 | +1 | +1 | +1 | -1 | -1 | 55.50 |
| 5 | -1 | -1 | +1 | -1 | +1 | +1 | -1 | +1 | +1 | +1 | -1 | 15.98 |
| 6 | -1 | -1 | -1 | +1 | -1 | +1 | +1 | -1 | +1 | +1 | +1 | 20.66 |
| 7 | +1 | -1 | -1 | -1 | +1 | -1 | +1 | +1 | -1 | +1 | +1 | 85.20 |
| 8 | +1 | +1 | -1 | -1 | -1 | +1 | -1 | +1 | +1 | -1 | +1 | 113.36 |
| 9 | +1 | +1 | +1 | -1 | -1 | -1 | +1 | -1 | +1 | +1 | -1 | 96.16 |
| 10 | -1 | +1 | +1 | +1 | -1 | -1 | -1 | +1 | -1 | +1 | +1 | 34.75 |
| 11 | +1 | -1 | +1 | +1 | +1 | -1 | -1 | -1 | +1 | -1 | +1 | 60.74 |
| 12 | -1 | -1 | -1 | -1 | -1 | -1 | -1 | -1 | -1 | -1 | -1 | 38.11 |
| 13 | 0 | 0 | 0 | 0 | 0 | 0 | 0 | 0 | 0 | 0 | 0 | 80.97 |
| 14 | 0 | 0 | 0 | 0 | 0 | 0 | 0 | 0 | 0 | 0 | 0 | 73.20 |
| 15 | 0 | 0 | 0 | 0 | 0 | 0 | 0 | 0 | 0 | 0 | 0 | 81.89 |
| 16 | 0 | 0 | 0 | 0 | 0 | 0 | 0 | 0 | 0 | 0 | 0 | 83.33 |
| 17 | 0 | 0 | 0 | 0 | 0 | 0 | 0 | 0 | 0 | 0 | 0 | 79.74 |
Optimization design
After selecting the most important components influencing chitinase production by B. pumilus, Box-Behnken response surface methodology (23) was used to determine the optimum levels of these variables. Selected variables (powder chitin, yeast extract, MgSO4 and FeSO4) were studied at three different concentrations coded as -1, 0, and 1. The coded and actual values of the variables are given in Table 3. According to the Box-Behnken design matrix generated by Design-Expert software, a total number of 29 experiments including 24 factorial points and 5 replicates at the center point were performed (Table 4).
Table 3Coded and real concentration values for the Box-Behnken design
| Variable | Component | Level of variable (g/L) | ||
|---|---|---|---|---|
| -1 | 0 | 1 | ||
| X1 | Powder chitin | 0.5 | 2.75 | 5.0 |
| X2 | Yeast extract | 0.02 | 0.26 | 0.5 |
| X4 | MgSO4.7H2O | 0.0010 | 0.0055 | 0.0100 |
| X10 | FeSO4.7H2O | 0.00150 | 0.01075 | 0.02000 |
Table 4Box-Behnken design matrix
| Trial No. | Variable | Chitinase activity (U/100 mL) | |||
|---|---|---|---|---|---|
| Chitin | Yeast extract | MgSO4 | FeSO4 | ||
| 1 | -1 | -1 | 0 | 0 | 18.20 |
| 2 | 1 | -1 | 0 | 0 | 57.36 |
| 3 | -1 | 1 | 0 | 0 | 56.90 |
| 4 | 1 | 1 | 0 | 0 | 97.39 |
| 5 | 0 | 0 | -1 | -1 | 62.32 |
| 6 | 0 | 0 | 1 | -1 | 41.24 |
| 7 | 0 | 0 | -1 | 1 | 67.10 |
| 8 | 0 | 0 | 1 | 1 | 66.75 |
| 9 | -1 | 0 | 0 | -1 | 50.80 |
| 10 | 1 | 0 | 0 | -1 | 77.17 |
| 11 | -1 | 0 | 0 | 1 | 29.49 |
| 12 | 1 | 0 | 0 | 1 | 54.60 |
| 13 | 0 | -1 | -1 | 0 | 51.37 |
| 14 | 0 | 1 | -1 | 0 | 87.31 |
| 15 | 0 | -1 | 1 | 0 | 43.20 |
| 16 | 0 | 1 | 1 | 0 | 82.01 |
| 17 | -1 | 0 | -1 | 0 | 46.71 |
| 18 | 1 | 0 | -1 | 0 | 69.51 |
| 19 | -1 | 0 | 1 | 0 | 37.90 |
| 20 | 1 | 0 | 1 | 0 | 74.64 |
| 21 | 0 | -1 | 0 | -1 | 43.77 |
| 22 | 0 | 1 | 0 | -1 | 91.11 |
| 23 | 0 | -1 | 0 | 1 | 40.78 |
| 24 | 0 | 1 | 0 | 1 | 89.50 |
| 25 | 0 | 0 | 0 | 0 | 65.31 |
| 26 | 0 | 0 | 0 | 0 | 68.42 |
| 27 | 0 | 0 | 0 | 0 | 68.88 |
| 28 | 0 | 0 | 0 | 0 | 69.51 |
| 29 | 0 | 0 | 0 | 0 | 70.90 |
Predicted chitinase activity was calculated using the following second order polynomial equation:
Y = β◦ + β1X1 + β2X2+ β3X3+ β4X4+ β11X12 + β22X22+ β33X32+ β44X42 + β12X1X2+ β13X1X3+ β14X1X4+ β23X2X3+ β24X2X4+ β24X2X4 Equation (3)
Where Y is predicted response, β◦ is intercept, β1, β2, β3, and β4 are linear coefficients, β11,β22, β33, and β44 are squared coefficients, β12 ,β13, β14, β23, β24 and, β34 are interaction coefficients, and X1, X2, X3, and X4 are independent variables. By using this equation, it is possible to evaluate the linear, quadratic and interactive effects of the independent variables on the response appropriately.
Statistical analysis and graph plotting was performed using Design-Expert software. ANOVA through Fisher’s test was used to evaluate the effect of independent variables on the response and significant results were identified by a p-value of < 0.05. Multiple correlation coefficient (R2) and adjusted R2 were used as quality indicators to evaluate the fitness of the second order polynomial equation. Contour and three-dimensional surface plots were employed to demonstrate the relationship and interaction between the coded variables and the response. The optimal points were determined by solving the equation derived from the final quadratic model and grid search in RSM plots.
Results and Discussion
Identification
Eighteen bacteria that could produce chitinolytic enzymes were isolated from soil samples collected from various locations in Iran using chitin agar plates. Among these, isolate U5 was selected for further study based on its high CZ/CS ratio (data not shown). In order to identify this isolate, the 16S rDNA analysis method was employed. A comparison of the partial (500 bp) 16S rDNA sequence with the NCBI Nucleotide database with BLAST software revealed 99% sequence identity with the published sequence of B. pumilus. The partial sequence was submitted to the NCBI Nucleotide database (accession number EU274636).
Chitinase production through B. pumilus isolate U5
After 8 days of incubation using basal medium, the chitinolytic activity in the culture supernatant of B. pumilus reached a maximum of 79.8 U/100 mL. The crude enzyme was thermally stable for more than 5 h at temperatures up to 60°C (data not shown).
Screening of important medium components
Plackett-Burman screening experimental design was employed to determine the influence of independent variables on the production of chitinase by B. pumilus. Among the variables under study, powder chitin (X1), yeast extract (X2), MgSO4 (X4), and FeSO4 (X10) concentrations were significant (Table 5).
Table 5ANOVA for Plackett-Burman design
| Source | Sum of Squares | df | Mean Square | f-Value | p-value (Prob > F) |
|---|---|---|---|---|---|
| Model | 10265.35 | 4 | 2566.339 | 44.69918 | < 0.0001a |
| Chitin | 7096.252 | 1 | 7096.252 | 123.5989 | < 0.0001 |
| Yeast extract | 2315.556 | 1 | 2315.556 | 40.33117 | < 0.0001 |
| MgSO4 | 478.7191 | 1 | 478.7191 | 8.338086 | 0.0148 |
| FeSO4 | 374.8281 | 1 | 374.8281 | 6.528566 | 0.0268 |
| Curvature | 945.3387 | 1 | 945.3387 | 16.46543 | 0.0019 |
| Residual | 631.549 | 11 | 57.41355 | ||
| Lack of Fit | 569.7909 | 7 | 81.3987 | 5.272097 | 0.0637 |
| Pure Error | 61.75812 | 4 | 15.43953 | ||
| Cor Total | 11842.24 | 16 |
It is also apparent from Table 5 that this model is highly significant. In addition, the model›s lack of fit is not significant, implying that the model fits the data. However, the highly significant effect of curvature means that at least one variable is involved in an order higher than one. This indicates that a linear model would not be appropriate for determining the optimum concentrations of significant variables and a higher order model must be employed. For this reason, optimization was performed using Box-Behnken design as described later.
By using Design Expert, the equation obtained for Plackett-Burman design was as follows:
Y = 63.46 + 24.32(X1) + 13.89(X2) - 6.32(X4) - 5.59(X10) Equation (4)
Where Y is the response (chitinase activity), and X1, X2, X4, and X10 are chitin, yeast extract, MgSO4, and FeSO4 concentrations, respectively. It can be seen from Equation 4 that chitin and yeast extract exerted positive effect, while MgSO4 and FeSO4 had negative effect on chitinase production by B. pumilus. Further statistical analysis revealed that the difference between the means of center point and factorial trials in this design was not significant (p > 0.05). This indicated that the optimum levels for chitinase production would be near or within the experimental ranges chosen for Plackett-Burman design and there was no need to apply the steepest ascend method (23). Instead, minor modifications were made to the levels of the negative significant components, MgSO4 and FeSO4, using the one factor at a time approach (data not shown).
Optimization of medium components
The four significant variables selected based on the results of Plackett-Burman design (chitin, yeast extract, MgSO4, and FeSO4) were optimized using Box-Behnken response surface methodology, and obtained results were analyzed by ANOVA (Table 6). By using the residual
plot of predicted values, trials number 6 and 12 (Table 4) were detected as outliers. Therefore, they were ignored in further statistical analysis of the data. As can be seen from Table 6, only two linear (chitin and yeast extract), one quadratic (chitin), and one interaction (chitin-FeSO4) terms were significant (p-value < 0.05). The mathematical model describing the relationship between variables (X1, X2, and X10) and response (Y) could be reduced to:
Y = 67.06 + 18.3(X1) + 20.79(X2) + 6.91(X1X10)- 8.76 (X12) Equation (5)
Table 6ANOVA for Box-Behnken design
| Source | Sum of squares | df | Mean square | f-Value | p-value Prob > F |
|---|---|---|---|---|---|
| Model | 9644.93 | 14 | 688.92 | 39.34 | < 0.0001 |
| X1- Chitin | 3306.45 | 1 | 3306.45 | 188.83 | < 0.0001 |
| X2- Yeast extract | 5188.60 | 1 | 5188.60 | 296.31 | < 0.0001 |
| X4- MgSO4 | 18.85 | 1 | 18.85 | 1.08 | 0.3199 |
| X10- FeSO4 | 27.79 | 1 | 27.79 | 1.59 | 0.2317 |
| X1X2 | 0.44 | 1 | 0.44 | 0.03 | 0.8768 |
| X1X4 | 48.56 | 1 | 48.56 | 2.77 | 0.1217 |
| X1X10 | 108.90 | 1 | 108.90 | 6.22 | 0.0282 |
| X2X4 | 2.07 | 1 | 2.07 | 0.12 | 0.7368 |
| X2X10 | 0.48 | 1 | 0.48 | 0.03 | 0.8716 |
| X4X10 | 0.29 | 1 | 0.29 | 0.02 | 0.8999 |
| X12 | 494.08 | 1 | 494.08 | 28.22 | 0.0002 |
| X22 | 19.71 | 1 | 19.71 | 1.13 | 0.3097 |
| X42 | 12.03 | 1 | 12.03 | 0.69 | 0.4234 |
| X102 | 0.03 | 1 | 0.03 | 0.00 | 0.9667 |
| Residual | 210.13 | 12 | 17.51 | ||
| Lack of Fit | 193.09 | 8 | 24.14 | 5.67 | 0.0600 |
| Pure Error | 17.04 | 4 | 4.26 | ||
| Cor Total | 9855.06 | 26 | |||
| R2 | 0.98 | ||||
| Adjusted R2 | 0.95 | ||||
| Predicted R2 | 0.86 | ||||
| C.V.% | 6.42 | ||||
| Adeq- Precision | 25.00 |
The positive coefficients of X1 and X2 indicate that chitinase activity increases with increasing levels of chitin and yeast extract. The squared correlation coefficient (R2) and adjusted R2 were calculated to be 0.98 and 0.95, respectively, indicating that this model can explain 98% variability in the response and only less than 2% of the variability is due to noise. Moreover, the similarity between R2 and adjusted R2-values shows the adequacy of the model to predict the response. The value of the coefficient of variation (CV% = 6.42) also indicates the precision and reliability of the model. Insignificant factors can affect the prediction ability of the model and consequently decrease its precision. By omitting these factors, the predicted R2 increased from 0.86 to 0.93. Also, the adequate precision of the model, which is an indicator of signal to noise ratio, increased from 25.00 to 45.24.
The response surface from the interaction between chitin and FeSO4 is illustrated in Figure 1. Chitinase activity increases as chitin concentration is increased; however, this relationship is not linear and, as expected, a curvature along the chitin axis is observed. The elliptical nature of the contour plot indicates that the interaction between chitin and FeSO4 is significant.
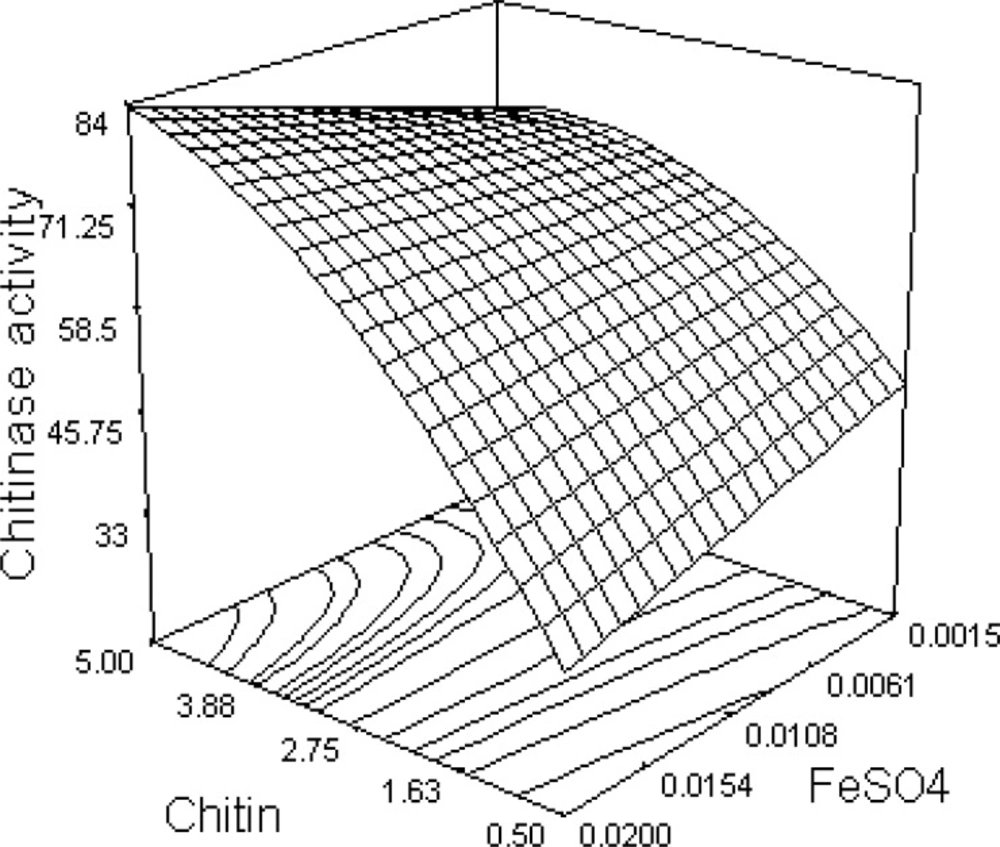
Figure 1
Response surface curve showing the effect of chitin and FeSO4 on chitinase production by B. pumilus
Through solving Equation 5 and analyzing response surface plots, the optimum levels for chitin, yeast extract, and FeSO4 were determined to be 4.76, 0.439, and 0.019 g/L, respectively. Since the effect of MgSO4 on chitinase production was found to be insignificant, its middle level (0.0055 g/L) was considered as optimal. At these concentrations, predicted chitinase activity was calculated to be 97.67 U/100 mL.
Experimental validation
In order to validate the experimental model, five verification experiments were performed using the statistically optimized medium. The practical response was 96.1 ± 2.88 U/100 mL which is about 98% of the predicted value. The perfect agreement between the observed and predicted values confirms the validity and precision of the model.
In this study, the Plackett-Burman design was used to determine the most important factors influencing chitinase production by B. pumilus. There are many reports describing the use of this method in medium optimization with several microorganisms including Alcaligenes xylosoxydans (25), Pantoea dispersa (6), Streptomyces (14), Azadirachta indica (26), and Bacillus circulans (27). Based on Plackett-Burman design results it was found that among ten tested components, chitin, yeast extract, MgSO4, and FeSO4 exhibit statistically significant effect on enzyme production. It has been shown that chitin is a major inducer in chitinase production by many bacteria such as A. xylosoxydans (25), Trichoderma hazarium (17), P. dispersa (6), Sterptomyces (14, 28), Moniliphthora perniciosa (16), and Bacillus laterosporous (29). Microbial chitinases are inducible enzymes, the production of which is stimulated by chitin, chitooligosaccharides, chitobiose and/or GlcNAc (7, 30, 31). The molecular mechanism of chitinase induction in bacteria has been studied by cloning the chitinase gene from Streptomyces lividans in Escherichia coli (32). It has been suggested that for most microorganisms the optimum chitin concentration for chitinase induction is in the range of 10-20 g/L (33). Here, we demonstrated that the optimum chitin concentration for chitinase production by B. pumilus is 4.76 g/L, which is considerably lower than the range given above. Similarly, several reports have indicated the stimulatory effect of yeast extract on chitinase production by microorganisms (6, 16, 17, 25, 28, 34). According to Nampoothiri et al. (17), this may be due to the presence of chitin or growth factors in yeast extract. However, such low concentrations of chitin fail to induce chitinase production in most micoorganims. In addition, some other nitrogen sources including peptone and urea are reported to enhance chitinase production (18), indicating that other mechanisms may be involved. The production of chitinolytic enzymes is also affected by minerals. Chitinase production by P. dispersa is enhanced by the addition of KBr and MgSO4 to the production medium (6). MgSO4 also influences chitinase production by Streptomyces (14). In this study, using statistical optimization methods we demonstrated that MgSO4 and FeSO4 can affect the production of chitinase by B. pumilus. It should be noted, however, that in optimization studies one should be very careful in selecting concentration ranges for such medium components as even very slight variations may result in quite different effects.
At the second step, chitin, yeast extract, MgSO4 and FeSO4, which exhibited significant effect on chitinase production, were selected for optimization of the production medium using Box-Behnken response surface methodology. This method has been used in similar studies including optimization of culture conditions for chitinase production by Streptomyces (14) and A. xylosoxydans (25). Using statistical experimental design, we were able to enhance chitinase production by B. pumilus to 96.1 U/100 mL. The good agreement between the predicted response (97.67 U/100 mL) and the experimental data obtained in the laboratory indicates the adequacy and applicability of experimental design methods for medium optimization.
