
Introduction
Experimental
Results
| R | Gene Names | Protein Names |
|---|---|---|
| 1 | SLC1A1 | Excitatory amino acid transporter 3 |
| 2 | DRD2 | D(2) dopamine receptor |
| 3 | DRD4 | D(4) dopamine receptor |
| 4 | BDNF | Brain-derived neurotrophic factor |
| 5 | ESR1(37, 38) | Estrogen receptor |
| 6 | CDH2 | Cadherin-2 |
| 7 | GRIN2B | Glutamate receptor ionotropic, NMDA 2B |
| 8 | TNFa | Tumor necrosis factor |
| 9 | GABBR1 | Gamma-aminobutyric acid type B receptor subunit 1 |
| 10 | OLIG2 | Oligodendrocyte transcription factor 2 |
| Hub-bottleneck nodes | Degree | Betweenness Centrality |
|---|---|---|
| ESR1 | 845 | 0.7 |
| DRD2 | 257 | 0.1 |
| GABBR1 | 224 | 0.1 |
| TNFα | 216 | 0.2 |
| CDH2 | 196 | 0.2 |
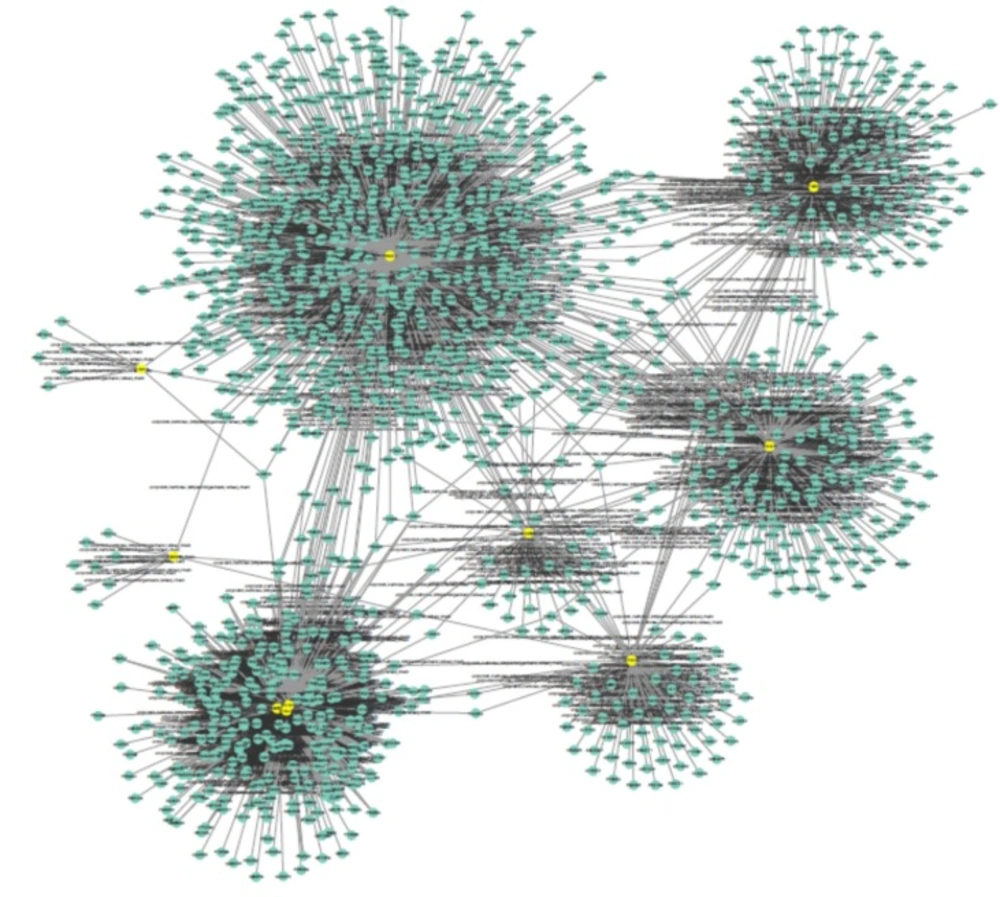
Protein-protein interaction network of ten common genes in OCD and Schizophrenia is shown. The PPI network is comprised of 1565 nodes and 2133 edges using Cytoscape 3.3.0. The yellow colored nodes are the ten query genes and the added genes are colored in green
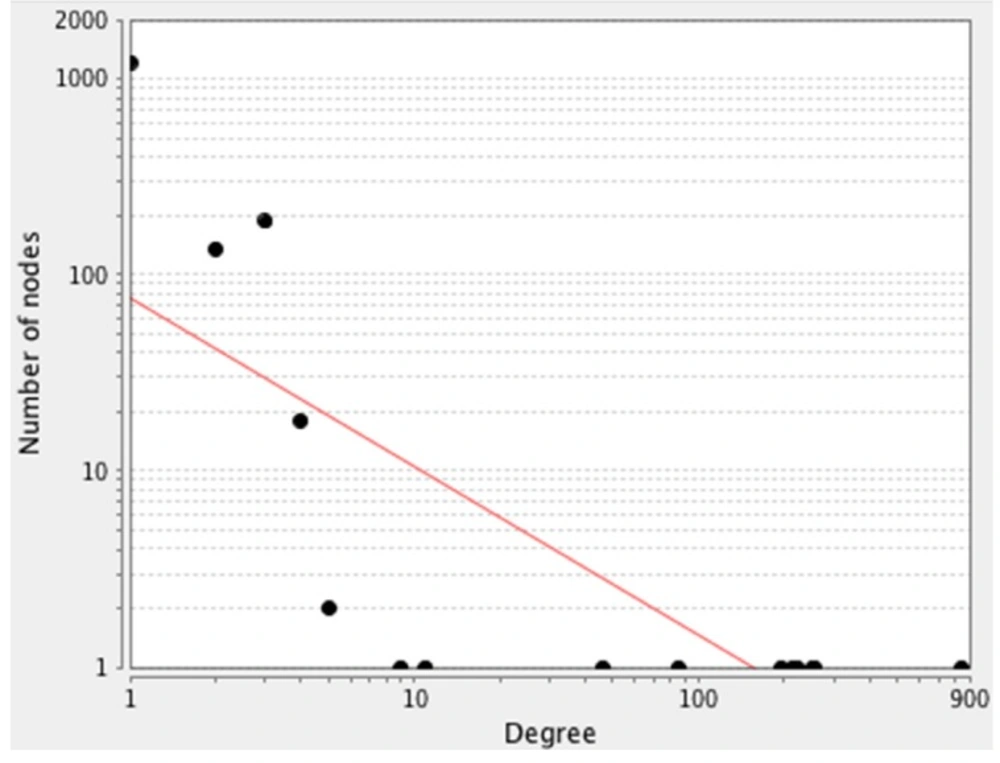
A scale-free network. The degree distribution values are significantly inhomogeneous. Just a few nodes show well linked, whereas others possess a small numbers of connections. This distribution implies on the presents of genes with high centrality values computed by Network Analyzer. The red line indicates the power law. The R-squared value is computed on logarithmized values, which is equal to 0.6 and the correlation = 0.9. Genes with high degree are in the right down region of the plot (their location is out of linear range)
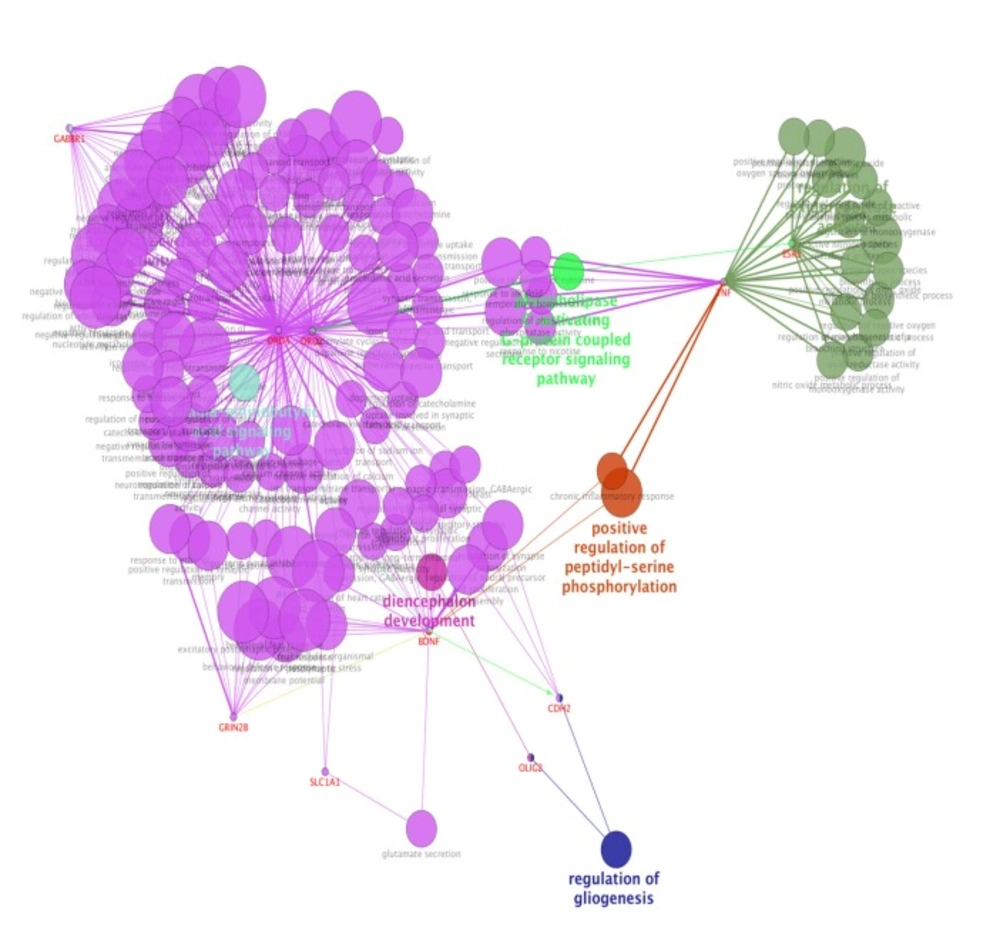
Biological process (BP) analysis of ten genes including their inhibition (red), activation (green), expression (yellow) characteristics by ClueGo-Cluepedia Plug-ins. The algorithm considers all the ten genes. Kappa score ≥0.5, P-value ≤ 0.05, gene per term = 2, gene percentage for each term = 2%
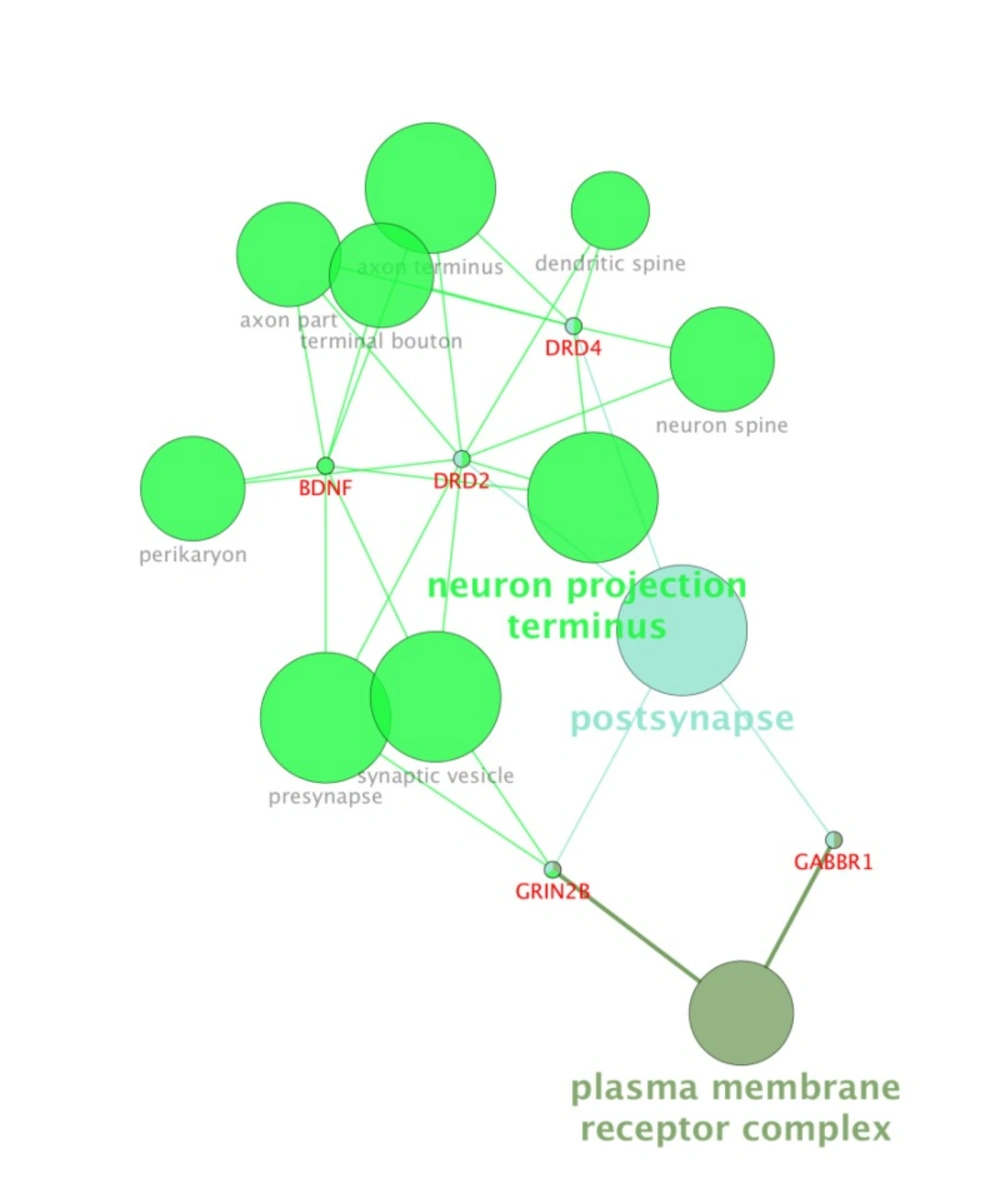
Cellular component (4) analysis of the ten genes by ClueGo-Cluepedia Plug-ins. The evaluated algorithm considered only five out of ten genes. Kappa score ≥ 0.5, P-value ≤ 0.05, gene per term = 2, gene percentage for each term =1%.
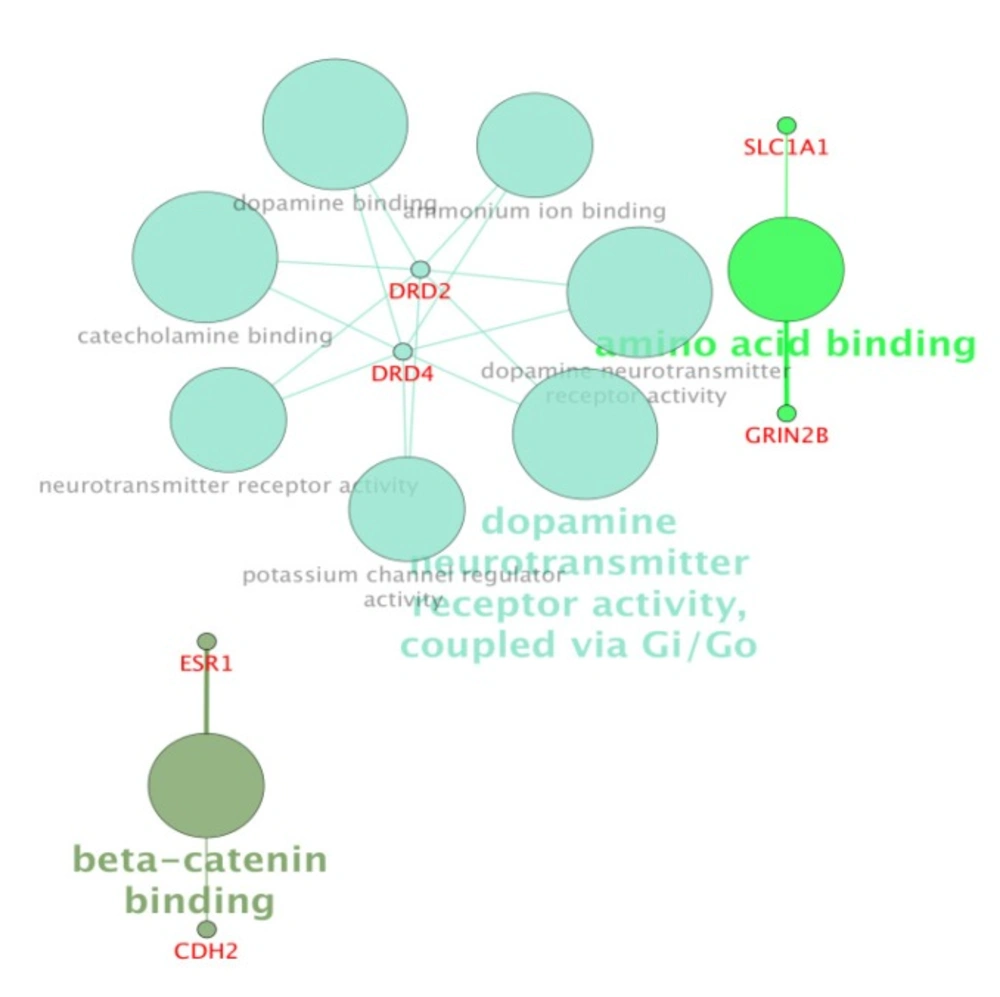
Molecular function (MF) analysis of ten investigated genes by ClueGo-Cluepedia Plug-ins. However, the evaluated algorithm considered only six out of ten genes. Kappa score≥ 0.5, P-value ≤0.05 , gene per term = 2, gene percentage for each term =1%.
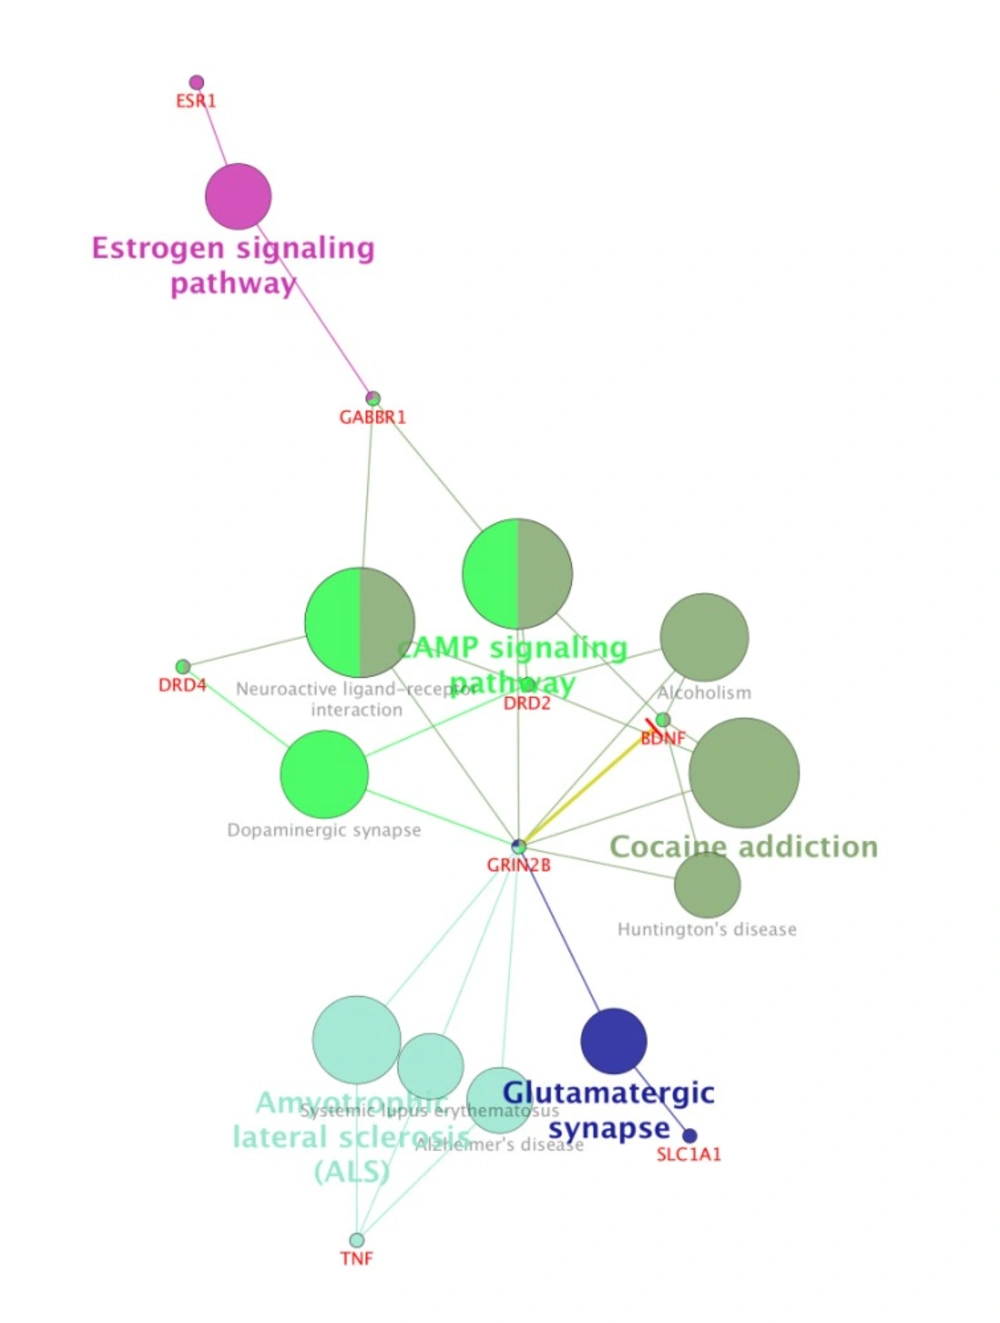
Pathway analysis of ten candidate genes by ClueGo-Cluepedia Plug-ins. KEGG Pathway and WIKIPathways were considered for pathway analysis. The evaluated algorithm considered only eight out of the ten genes. Kappa score≥0.5, P-value0.05 ≥ , gene per term = 2, gene percentage for each term =1%.
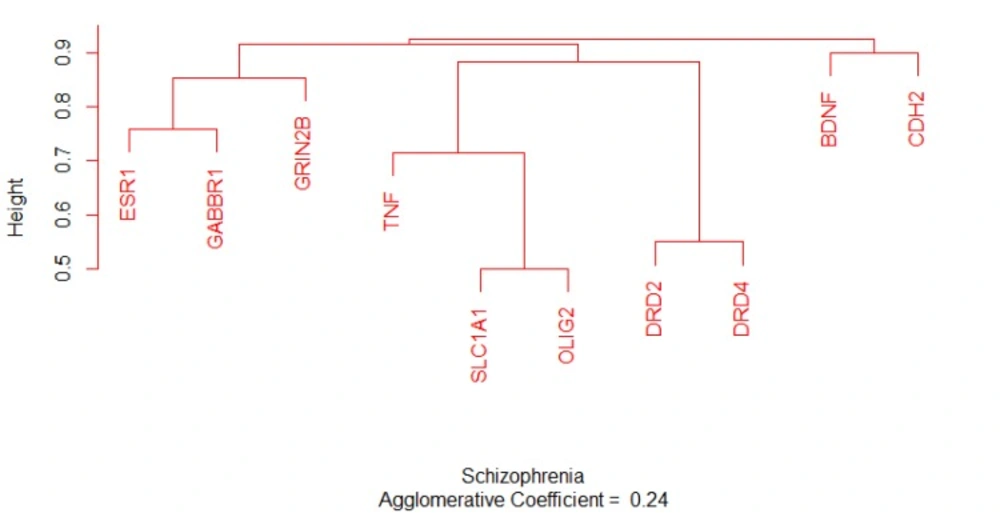
Dendrogram plotting of ten analyzed genes by the use of AGNES function. The height indicates the distance between the nodes. The agglomerative coefficient is 0.24
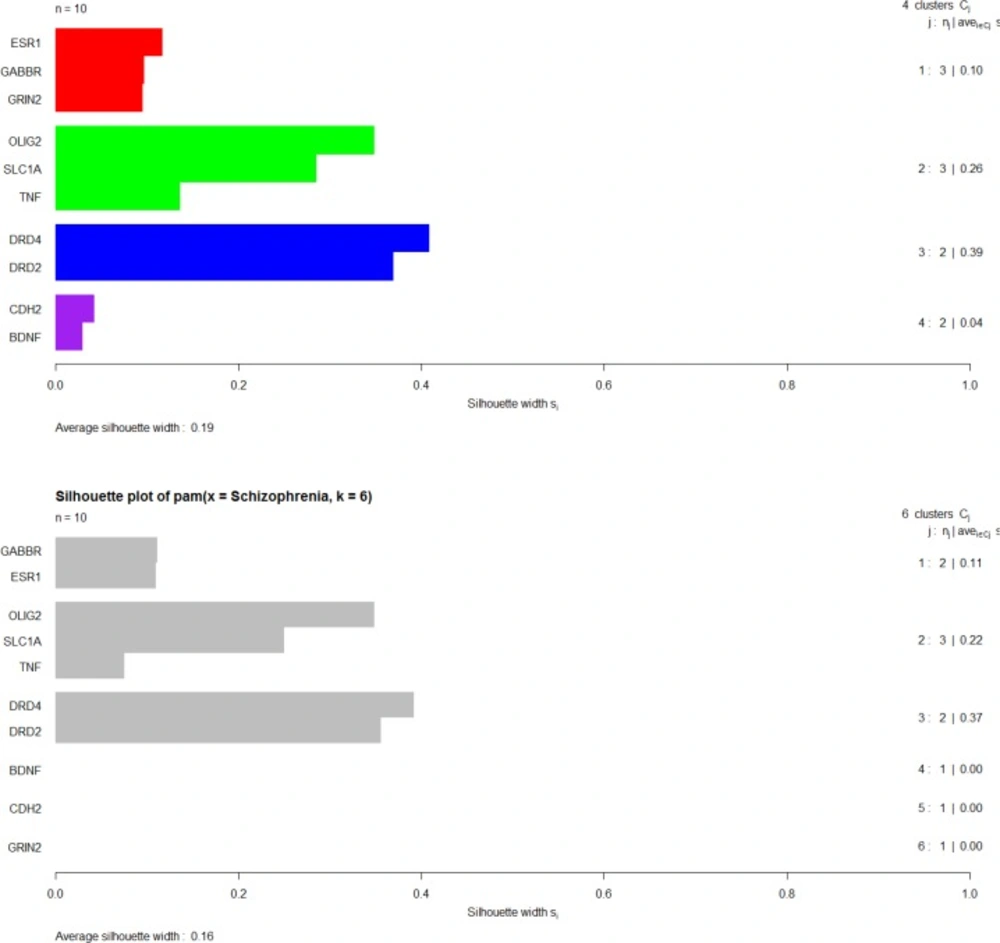
PAM clustering algorithms of ten genes via silhouette plotting, K = 4, Average silhouette width for each cluster is shown in the right side of the right column in the Figure. The overall average silhouette width is equal to 0.19
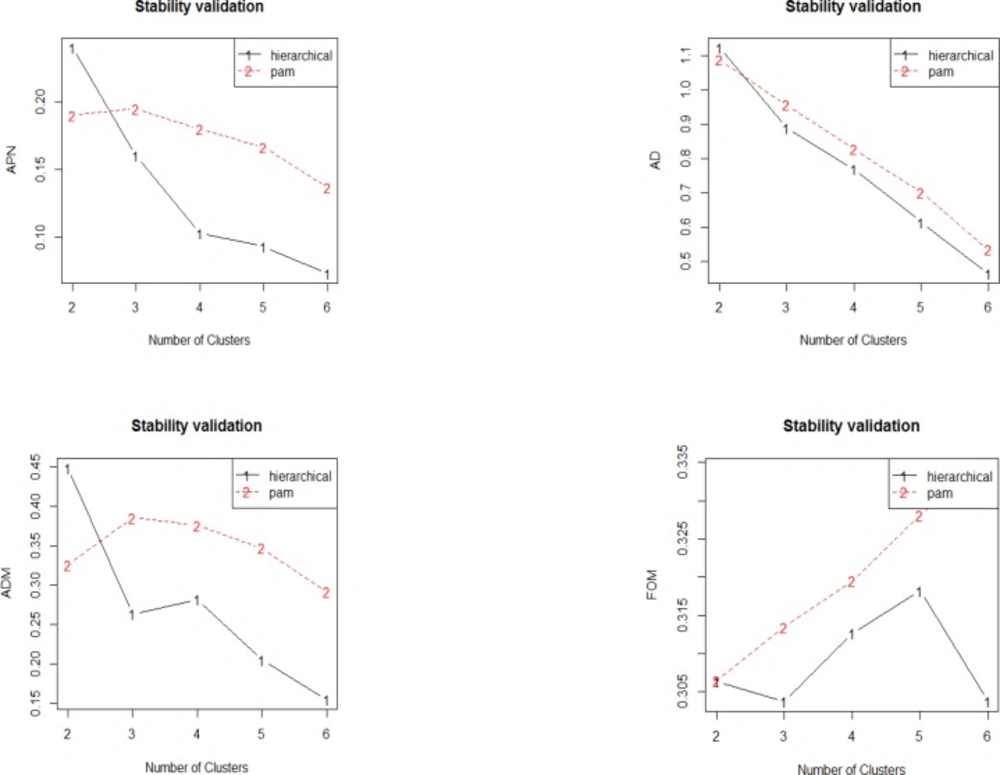
Plot of the APN, AD, ADM and FOM measures with number of cluster. The APN and AD, measures show homogenous decreased trend as the number of clusters increases for hierarchical clustering in which with six clusters has the best overall scores. For ADM, the trend decreases from two to three clusters, then there is increment to four clusters, and finally the score decreases as the number of clusters increases. In FOM, the value decreases from two to three clusters but increases afterwards to five clusters and subsequently decreased again to six clusters. Overall, hierarchical clustering has the lowest value of all evaluated indices
