Chemicals
All chemicals were purchased from Sigma-Aldrich (St. Louis, MO) in the best pharmaceutical grade.
Nanoparticle synthesis
Silk fibroin was synthesized by Dr Mehdi Farokhi in National Cell Bank of Iran, Pasteur Institute of Iran, Tehran, Iran.
Cell Culture
Huvec cells (Life Technologies for Type Culture Collection, Wuhan, China) were cultured in RPMI 1640 medium (HyClone, UT, USA) containing 11.1 mmol/L glucose, 50 μmol/L β-mercaptoethanol, 1.0 mmol/L sodium pyruvate, 2.0 mmol/L L-glutamine, 100 U/mL penicillin, 100 μg/mL streptomycin (Sigma-Aldrich, MO, USA) and 10% fetal bovine serum (Gibco, MD, USA) in a humidified atmosphere of 95% air and 5% CO2 at 37 °C. Culture medium was replaced every 2 to 3 days. Upon reaching near confluence, cells were passaged with trypsin (0.25%) at a ratio of 1:3. Huvec cells used in this study were between passages 5-15.
Cell viability assay
Cell viability was assessed by 3-(4,5-dimethylthiazol-2-yl)-2,5- Diphenyl tetra zoliumbromide solution in RPMI-1640- medium and incubated for 6,12 and 18 h at 37 °C. At the end of the incubation period the plate was centrifuged (5 min, 800×g), and the untransformed MTT removed by carefully inverting, flicking and blotting the tray. Finally, DMSO, 100 µL, was added to each well. The absorbance was measured at 570 nm on ELISA reader (In finite 200 M, TECAN). Each concentration was tested in three different experiments run in three replicates for each sample (
15).
Isolation mitochondria of cell culture
The cells were harvested in the late logarithmic phase of growth with a rubber policeman and centrifuged at 500×g for 5 min. The cell pellet was washed three times with 10 mL of serum-free Ham′s F-10 medium by repeated dispersion and centrifugation. The cell pellet was homogenized in 10 volumes of STM buffer (0.25 M sucrose; 20 mM Trist HCl; 1.1 mM MgCl2, at pH 7.85) by 15 strokes at 5000 rpm with a motorized pestle. The homogenate was centrifuged at 800×g for 10 min, and the resultant supernatant was then centrifuged at 16,000×g to obtain crude «mitochondrial» and «cytosol» fractions.
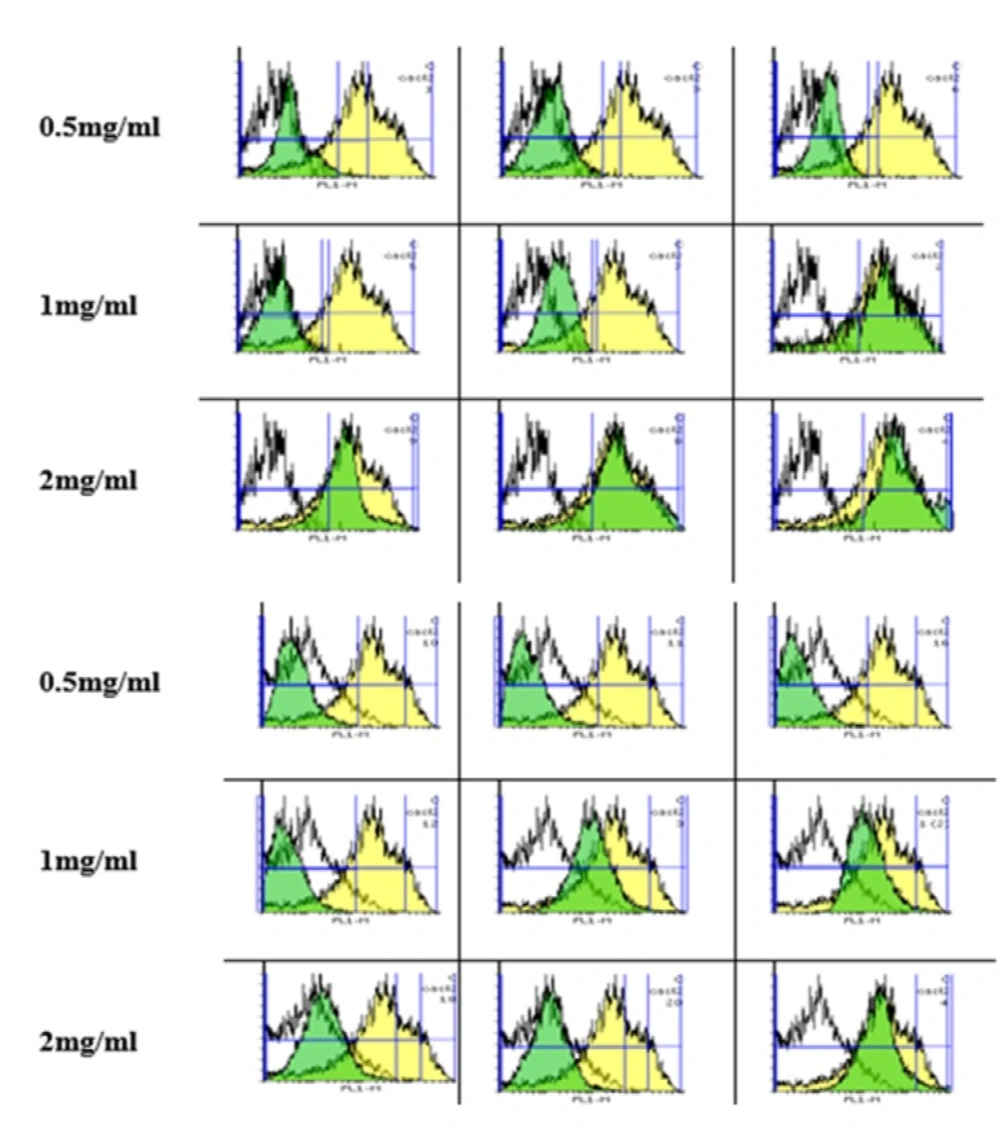
Measurement of ROS
The cells (1 × 10
6) were treated with the appropriate dose of the silk NPs (0.5, 1 and 2 mg/mL) and with 10 mM of DCFH-DA. Intracellular reactive oxygen species (ROS) in the fibroblast and Huvec cells were determined after 6, 12, and 24 h of incubation at 37 °C by silk fibroin nanoparticles. The samples were centrifuged at 3000×g for 5 min to wash off the excess of silk nanoparticle. Then, the pellet was dissolved in 0.5 mL PBS, and also 100 µL aliquots were redistributed to the BD flowcytometry tube. The cells were read on the fluorescence and light scattering was analyzed for at least 10000 counts per sample in the flowcytometry using a BD Biosciences FACS Calibur TM flowcytometer. The samples were gated on the forward/side scatter to exclude cell debris and clumps. A flow cytometer with the Flowing software-2-5-1, equipped with a 488 nm argon ion laser, was used and fluorescence signals were obtained using a 530 nm bandpass filter (FL-1 channel) (
16).
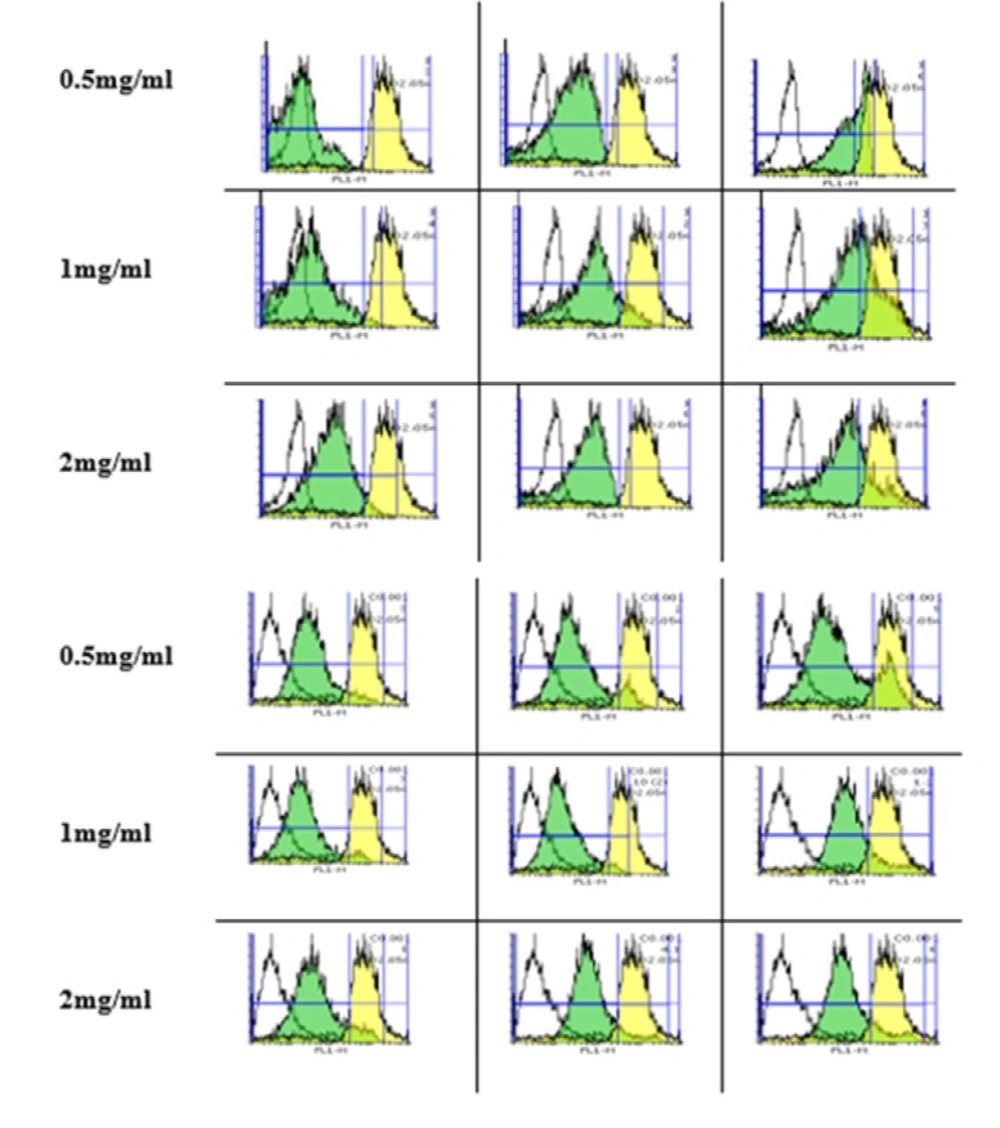
Measurement of MMP
Rhodamin123 (Rh 13) was used to measure the mitochondrial inner membrane potential (MMP). The cells were incubated with silk NPs (0.5, 1 and 2 mg/mL) for 6, 12, and 18 h. The samples were centrifuged at 3000×g for 5 min to wash off the excess of silk nanoparticle. The pellet was dissolved in 0.5 mL PBS, and 100 µL aliquots were redistributed to the BD flowcytometry tube. The cells were read on the fluorescence and light scattering was analyzed for at least 10000 counts per sample in the flowcytometry using a BD Biosciences FACS Calibur TM flow cytometer. The samples were gated on the forward/side scatter to exclude cell debris and clumps. A flow cytometer with the Flowing software-2-5-1, equipped with a 488 nm argon ion laser, was used and fluorescence signals were obtained using a 530 nm bandpass filter (FL-1 channel) (
17).
Measurement of Lipid Peroxidation
The cells (1 × 10
6) were pre-incubated with an appropriate dose of the silk NPs (0.5, 1 and 2 mg/mL). In fibroblast and huvec cells, the lipid peroxidation was measured at 6, 12, and 24 after exposure to all mentioned concentration of silk NPs. Lipid peroxidation was initiated by addition of hydroxyl radical generating mixture. After an additional 30 min at room temp, 10% w/v of ice- cold TCA was added, and the samples were centrifugation 5 min at 3,000×g. The supernatant was collected (0.5 mL) and treated with TBA reagent (20 mM TBA in 50% v/v glacial acetic acid). The samples were then heated at 100 °C for 1 h. After the cooling period, butanol was added, and the organic layer was removed and redistributed to 96-well plates. The supernatant was evaluated at 532 nm with an ELIZA reader (Tecan, Rainbow Thermo, Austria) (
16).
Measurement of GSH and GSSG
The reduced glutathione disulfide (GSH) to oxidized glutathione (GSSG) is a sensitive indicator of oxidative stress in the cells. Therefore, intracellular GSH and GSSG contents were determined based on a spectrofluorometric method by employing O-Phthalaldehyde (OPA) and N-Ethylmaleimide (NEM) probe. Aliquots of the cell suspension (0.5 mL) that were previously stained with OPA and NEM probe (5 µM) were separated from the incubation medium by centrifugation at 1000 rpm for 1 min. The cell pellet was then suspended in 2 mL of the fresh incubation medium. This washing process was carried out twice to remove the fluorescent dye from the media. Each sample was measured in quartz cuvettes using a Shimadzu RF5000U fluorescence spectrophotometer set for at 495 nm excitation and 530 nm emission wavelengths (
18).
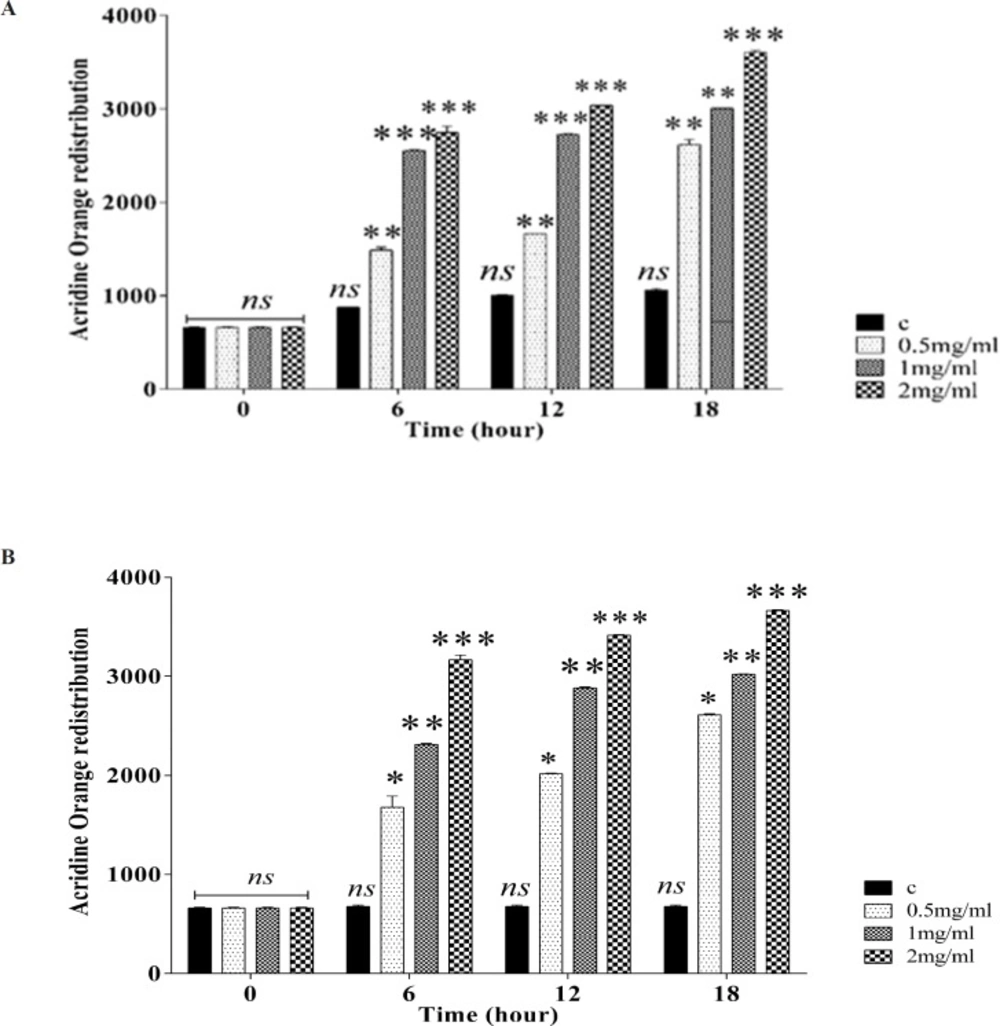
Measurement of Lysosomal membrane integrity assay
The lysosomal membrane stability was determined from the redistribution of acridine orange as a fluorescent dye. Aliquots of the cell suspension (0.5 mL) that were previously stained with acridine orange (5 µM) were separated from the incubation medium by centrifugation at 1000 rpm for 1 min. The cell pellet was then suspended in 2 mL of the fresh incubation medium. This washing process was carried out twice to remove the fluorescent dye from the media. Finally, the acridine orange redistribution in the cell suspension was measured by the spectrophotometer set at 495 nm excitation and 530 nm emission wavelengths (
19).
Measurement of mitochondrial ATP and ADP
The concentration of adenosine triphosphate (ATP) in mitochondria was determined by a bioluminescent somatic cell assay kit (sigma Aldrich. MO 63103, USA) at 12 h. The bioluminescence intensity was measured by a Sirius tube luminometer (Berthold Detection System, Germany).
Measurement of Cytochrome c release
The concentration of cytochrome c was determined through using the Quantikine Cytochrome c Immunoassay kit provided by R and D Systems, Inc. (Minneapolis, Minn.). Briefly, a monoclonal antibody specific for rat/mouse cytochrome c was pre-coated onto the microplate. Seventy-five microliter of the conjugate and 50 μL of standard and positive control were added to each well of the microplate. One microgram of protein from each supernatant fraction was added to the sample wells.
All of the standards, controls, and samples were added to two wells of the microplate. After 2 h of incubation, the substrate solution (100 μL) was added to each well and incubated for 30 min. Then, 100 μL of the stop solution was added to each well; the optical density of each well was determined by the aforementioned microplate spectrophotometer set to 450 nm (ELISA reader, In finite 200 M,
TECAN).
Measurement of mitochondrial Cytochrome c oxidase activity
In this study, the mitochondrial cytochrome c oxidase activity and mitochondrial outer membrane (MOM) were measured using a cytochrome-c oxidase assay kit (Sigma, St. Louis, MO). The experimental procedures were performed according to the manufacturer′s protocol.
Statically Analysis
Data were analyzed using one-way and two-way ANOVA tests followed by the post-hoc Tukey and Bonferroni tests, respectively. The results were presented as mean ± SD. of the triplicate samples. The minimal level of significance chosen was P < 0.05.