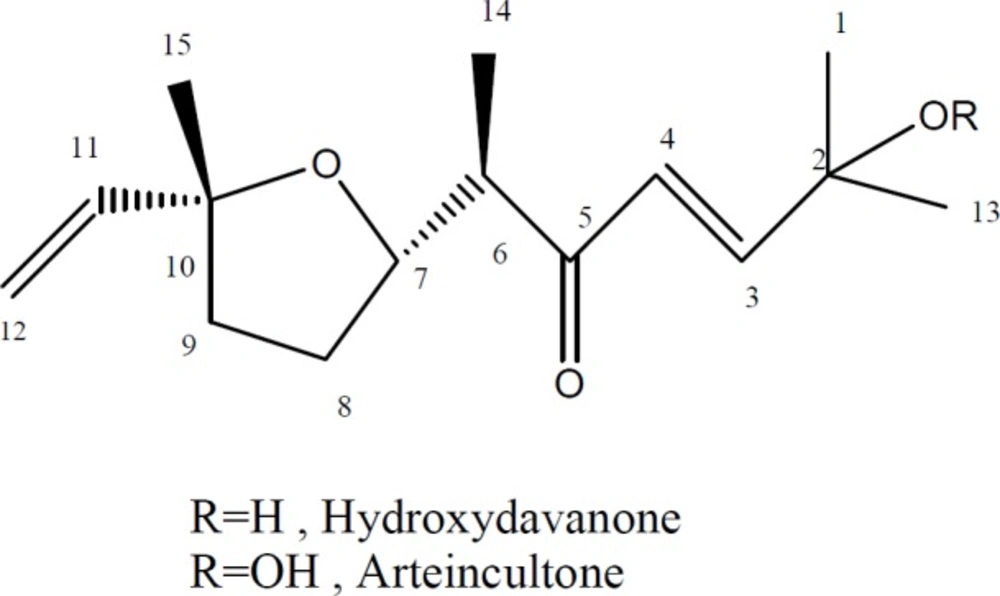
Isolation and structure elucidation of compounds 1 and 2
From Petroleum ether extract of
A. aucheri two terpenoids including hydroperoxide and hydroxyl derivatives of davanone were isolated. Isolated compounds (
Figure 1) were identified by comparison of their NMR and MS spectral data to those reported in the literature (
29,
30).
1H-NMR and mass spectral data of the isolated compounds are as follows:
Hydroperoxide of davanone (arteincultone) (1)
1H-NMR (500 MHz, CDCl3): δ 8.02 (OOH, br s), 6.86 (1H, d, J = 16.1 Hz, H-3), 6.40 (1H, d, J = 16.1 Hz, H-4), 5.90 (1H, dd, J = 17.2,10.7 Hz, H-11), 5.18 (1H, dd, J = 17.2, 1.5 Hz, H-12a), 4.99 (1H, dd, J = 10.7, 1.5 Hz, H-12b), 4.16 (1H, ddd, J = 8.3, 8.3, 6.0 Hz, H-7), 2.96 (1H, dq, J = 8.3, 7.0 Hz, H-6), 2.03 (1H, m, H-8a), 1.88 (1H, m, H-9a), 1.76 (1H, m, H-9b), 1.68 (1H, m, H-8b),1.39 (3H, s, H-1), 1.39 (3H, s, H-13), 1.25 (3H, s, H-15), 1.05 (3H, d, J = 7.0 Hz, H-14). ESIMS: m/z 269 [M + H]+, 291 [M+ Na]+
Hydroxydavanone (2)
1H-NMR (500 MHz, CDCl3): δ 6.92 (1H, d, J = 15.8 Hz, H-3), 6.42 (1H, d, J = 15.8 Hz, H-4), 5.90 (1H, dd, J = 17.2, 10.7 Hz, H-11), 5.18 (1H, dd, J = 17.2, 1.6 Hz, H-12a), 4.97 (1H, dd, J = 10.7, 1.6 Hz, H-12b), 4.22 (1H, ddd , J = 8.3, 8.3, 6.0 Hz, H-7), 2.94 (1H, dq, J = 8.0, 7.0 Hz, H-6), 2.01 (1H, m, H-8a), 1.89 (1H, m, H-9a), 1.75 (1H, m, H-9b), 1.66 (1H, m, H-8b), 1.38 (3H, s , H-1), 1.38 (3H, s , H-13), 1.26 (3H, s , H-15), 1.04 (3H, d, J = 7.0 Hz, H-14). ESIMS: m/z 253 [M + H]+, 275 [M+ Na]+
Chemical structures of compounds 1 and 2
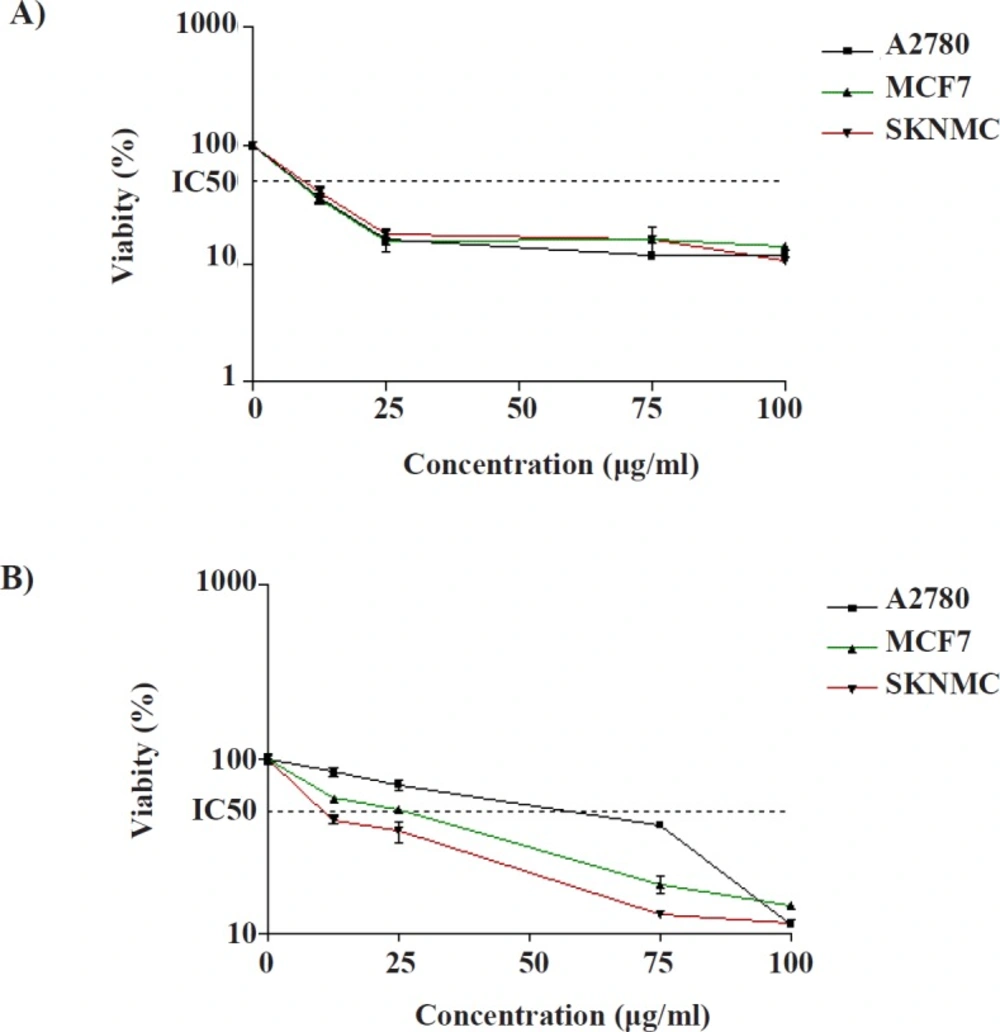
Cytotoxic effects of (A) compound 1 and (B) compound 2 in SK-N-MC, MCF-7 and A2780 cancer cells. The cells were incubated with different concentrations of compounds for 24 h. The cell proliferation inhibition was determined by MTT assay as described under materials and methods. Data are presented as mean ± SEM (N = 3)
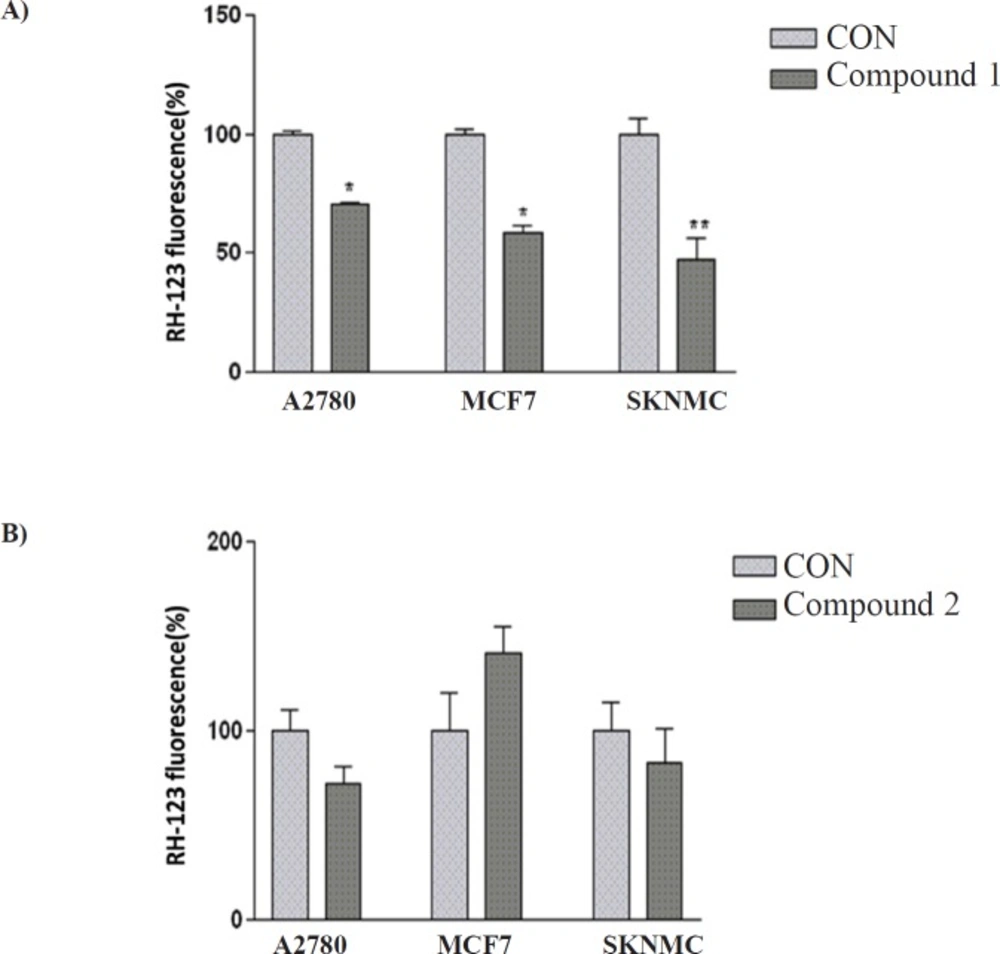
The effect of (A) compound 1 and (B) compound 2 on MMP in SK-N-MC, MCF-7 and A2780 cancer cells. Data are presented as mean ± SEM, *P < 0.05, **P < 0.01 vs. control
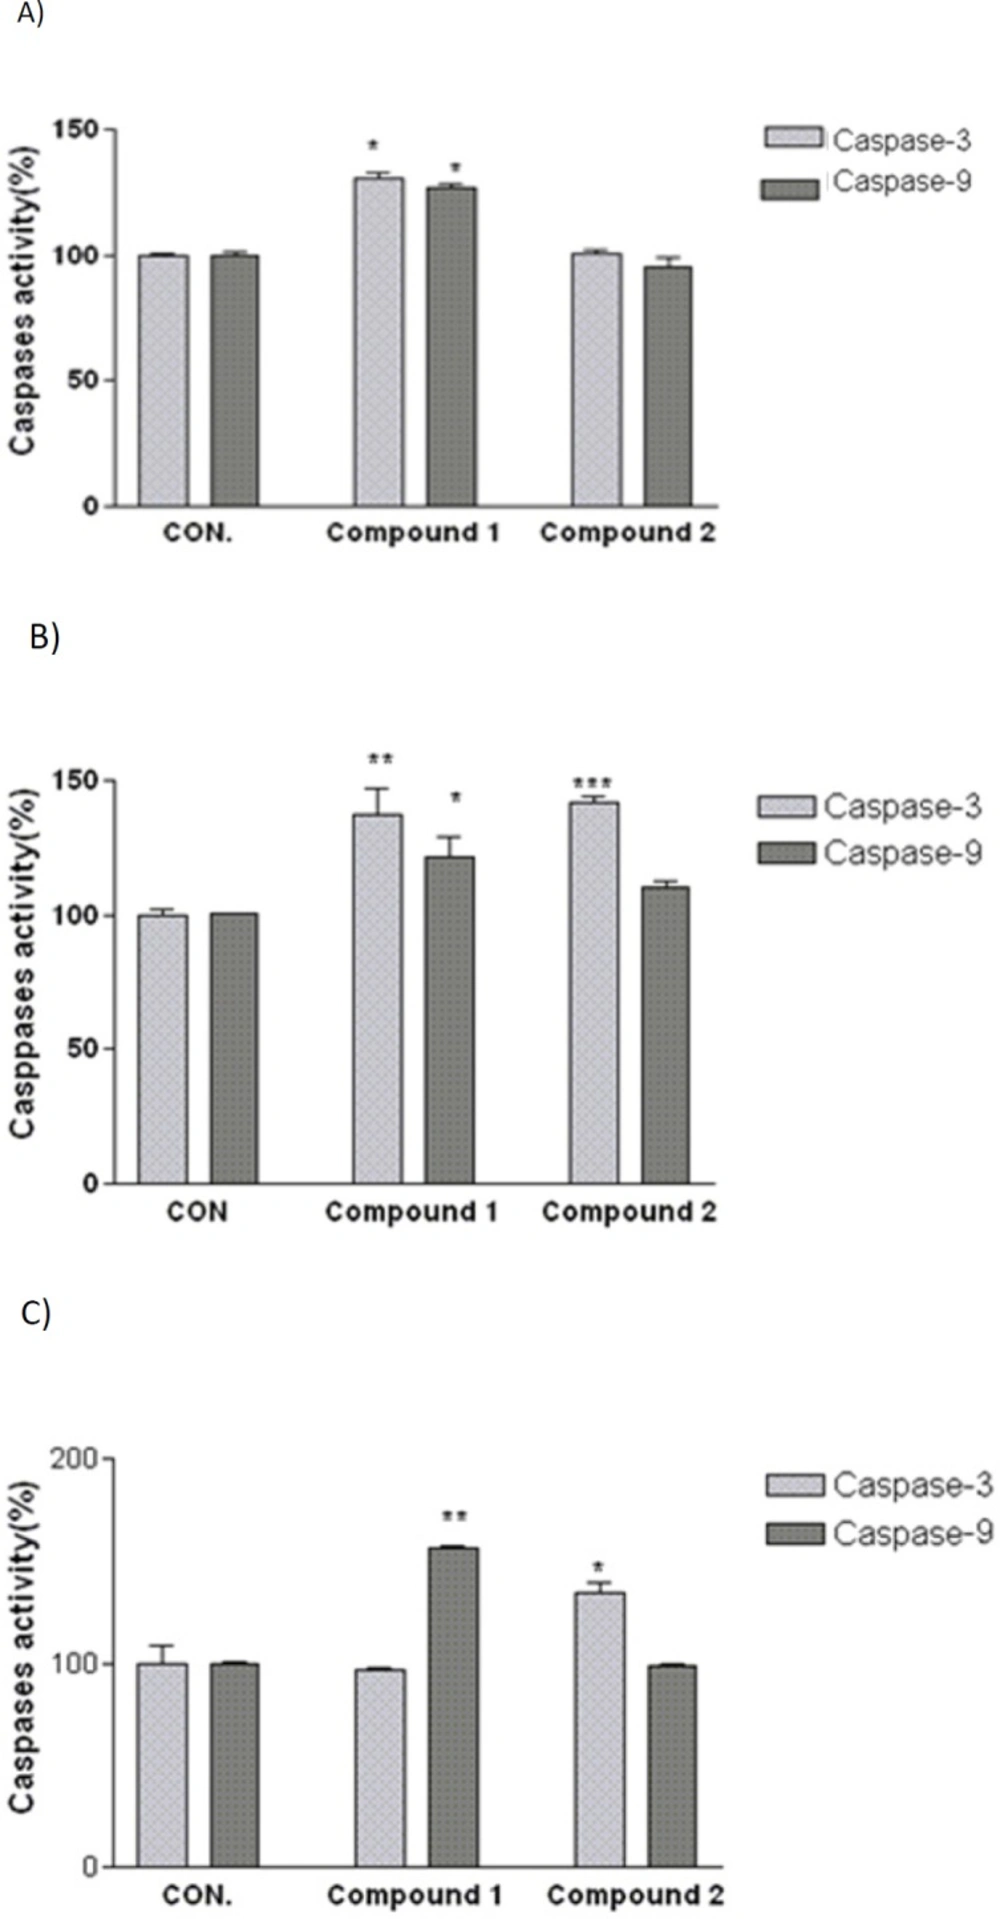
Involvement of activation of caspases in the induction of apoptosis on (A) SK-N-MC, (B) A2780, and (C) MCF-7 human cancer cells. Cells were incubated with IC50 concentration of the indicated compounds and harvested at 24 h and cell lysates were assayed using microplate reader for activation caspases. Significant differences were compared with the control. Data are presented as mean ± SEM. *P < 0.05, **P < 0.01 and ***P < 0.001 versus control
Cytotoxic activities of the compounds
To examine the
in-vitro anti-cancer efficacy of the compounds, the potency of isolated compounds to induce cell death was determined on SK-N-MC, MCF-7, and A2780 cell lines under MTT method. As shown in
Figures 2a and 2b, exposure to compound 1 for 24 h resulted in a concentration dependent decrease in cell viability, with approximate IC
50 values of 8.45 ± 0.81 µg/mL, 9.60 ± 1.32 µg/mL and 10.9 ± 2.03 µg/mL in A2780, MCF-7, and SK-N-MC cells, respectively. These values are below 20 µg/mL, which indicate that compound 1 potentially presents an interesting cytotoxic activity towards three human carcinoma cell lines (31). Compound 2 can be accepted as potent cytotoxic agents against SK-N-MC because its IC
50 value (IC
50 = 10 ± 0.91 µg/mL) is below 20 μg/mL. Moreover, it showed moderate cytotoxic effect against MCF- 7 (IC
50 = 25.4 ± 4.21 µg/mL) and A2780 (IC
50 = 41.69 ± 2.87 µg/mL) cell lines.
Effect of isolated compounds on mitochondrial membrane potential (MMP)
To characterize the changes in mitochondrial events induced by treatments with isolated compounds, the collapse of MMP in SK-N-MC, A2780 and MCF-7 cell lines were monitored with the rhodamine 123.
Decrease of mitochondrial membrane potential caused by the compound 1- induced damage of the outer membrane resulted in the loss of the dye from the mitochondria and a decrease in intracellular fluorescence, so that compound 1 significantly decreased MMP in three human carcinoma cell lines. Moreover, the result indicated that compound 2 was not able to change MMP in any studied cell lines (
Figure 3).
Effect of isolated compounds on caspase 3 and 9 activities
As shown in
Figure 4, after 24 h treatment with IC
50 concentration of compound 2, caspase-3 activity in A2780 and MCF-7 cells was significantly increased. To determine which apoptotic pathway is activated by this compound, we evaluated the activation of caspase 9, the apical protease in intrinsic pathways. Compound 2 was not able to increase the activity of caspase 9 in above mentioned cell lines. In addition, the obtained results indicated that compound 1 considerably increases caspase-3 and -9 enzyme activities in A2780 and SK-N-MC cell lines while no increase in caspase -3 activity was shown after exposure to compound 1 in MCF-7 cell line. Activity of caspase-9 was found to increase significantly after 24 h exposure to IC
50 concentration of compound 1 in MCF-7 cell line.