Nimbolide preparations
Nimbolide from Azdirachta indica of purity ≥98% was purchased from Sigma Aldrich, USA (catalog no. SMB000 586). The stock solution 1 of nimbolide was prepared by dissolving 5 mg of nimbolide in 1 mL of dimethyl sulfoxide (DMSO) making a final concentration of 10.72 mM. The stock solution II was made by dissolving 45 uL from stock solution 1 into 955 uL of Dulbecco’s Modified Medium (DMEM) making a final concentration of 500 uM. The stock solution II was diluted prior to use with medium to obtain the desired concentration of nimbolide.
Chemicals
Trypan blue (catalogue no. T6146), Propidium iodide stain (catalog no. p4864), Hoechst 33342 stain (catalog no. 23491-45-4) were obtained from Sigma, USA. FLICE/Caspase 8 colorimetric assay kits (catalogue no. K 113-100), FLICE/Caspase 3 colorimetric assay kits (K106-100), FLICE/Caspase 9 colorimetric assay kits (catalogue no. K 119-100) were purchased from Bio Vision, USA. Dulbecco’s Phosphate Buffered Saline (D-PBS) (catalogue no. PBS-1A), Fetal Bovine Serum (FBS) (catalogue no. S 001-01), Penicillin-streptomycin (catalogue no. LS202-02) and Trypsin-EDTA (catalogue no. LS015) were purchased from Welgene, South Korea, DMEM (catalogue no. DMEM-HPA), and RPMI-1640 (catalogue no. RPMI-A) medium from Capricorn Scientific, South Korea, MTT dye (Thiazolyl Blue Tetrazolium Bromide, Amresco®) (catalogue no. 0793-59) from Solon Ind. Pkwy, DMSO (catalogue no. 67-68-5) was obtained from Junsei, Japan, FITC annexin-V/Dead cell apoptosis kit (catalogue no. V13242) was purchased from Invitrogen, USA.
Cell lines and cell culture
The cancerous cell lines A-549, PC-3, Du-145, and noncancerous NIFH3T3 and CCD-18Co were purchased from Korean cell line bank. A-549 is lung cancer cell line, Du-145, PC-3 are prostate cancer cell lines, NIH3T3 is mouse embryonic fibroblast cell line and CCD-18Co is a colon fibroblast cell line.
The cancerous cells were grown in RPMI 1640 media and non-cancerous cells were maintained in DMEM using 25 cm3 tissue culture flask. At confluence, the cells were transferred to 75 cm3 tissue culture flask according to manufacturer’s instructions. All the cell lines were supplemented with 10% heat-inactivated FBS and 1% antibiotics and maintained at 37 °C in humidified 5% CO2 and 95% air
incubator.
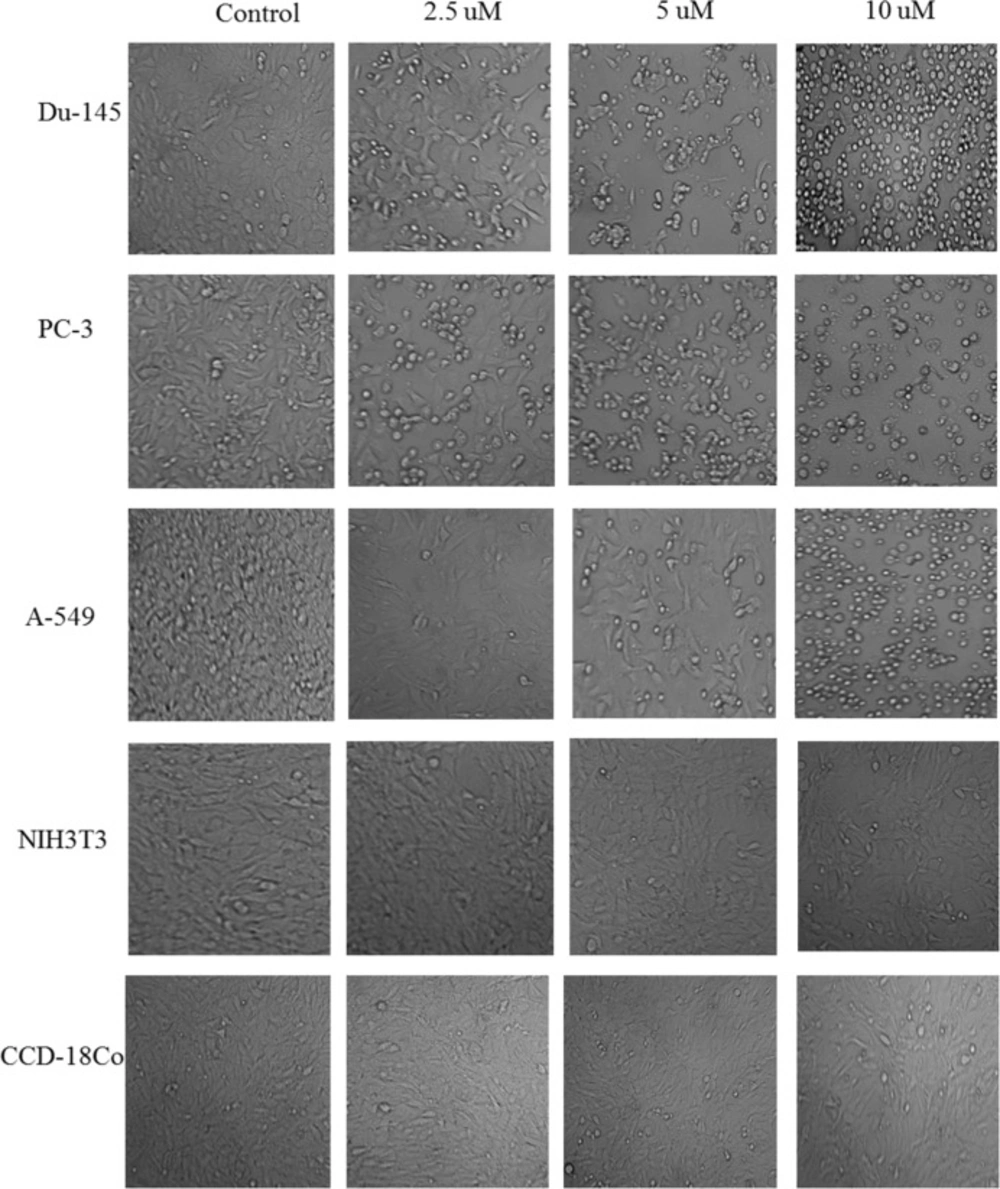
Morphological changes in Phase-contrast Microscopy
To observe the morphological changes, each cancer cell line and normal cell line was grown using 6 well tissue culture plates after treatment with different concentrations of nimbolide (0, 2.5, 5 and 10 uM) and vehicle (DMSO 1 uL/mL) for 24 h and 48 h and then observed under phase contrast microscope (
24).
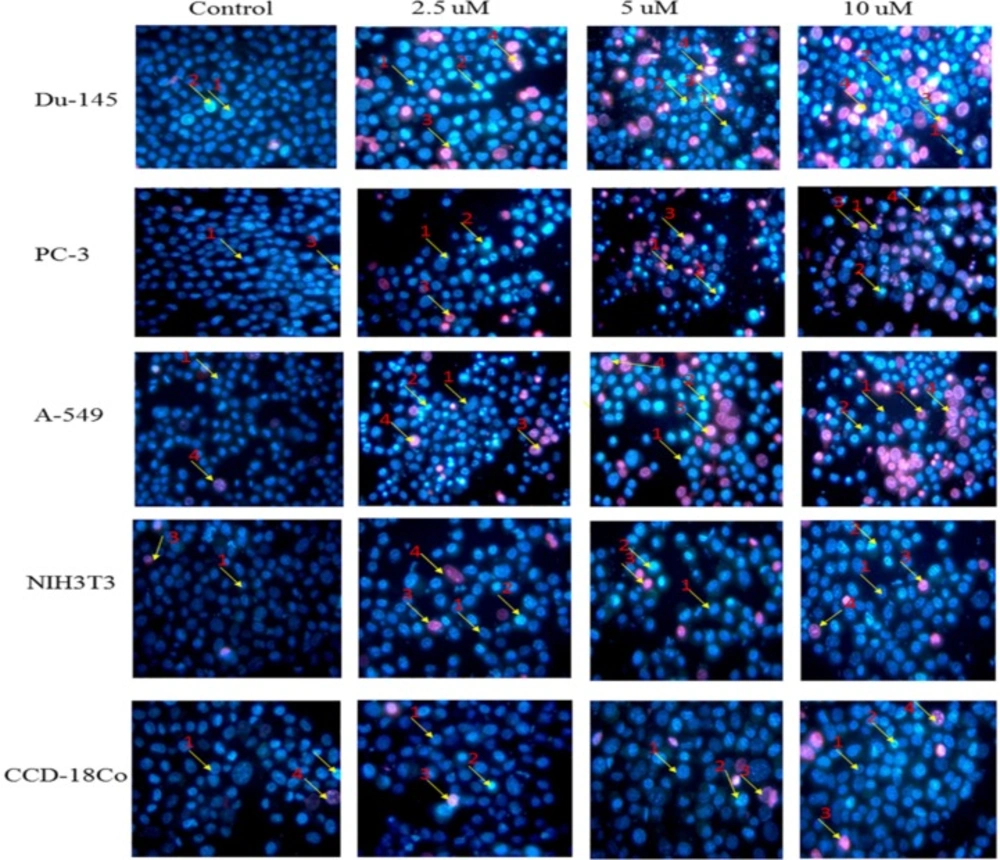
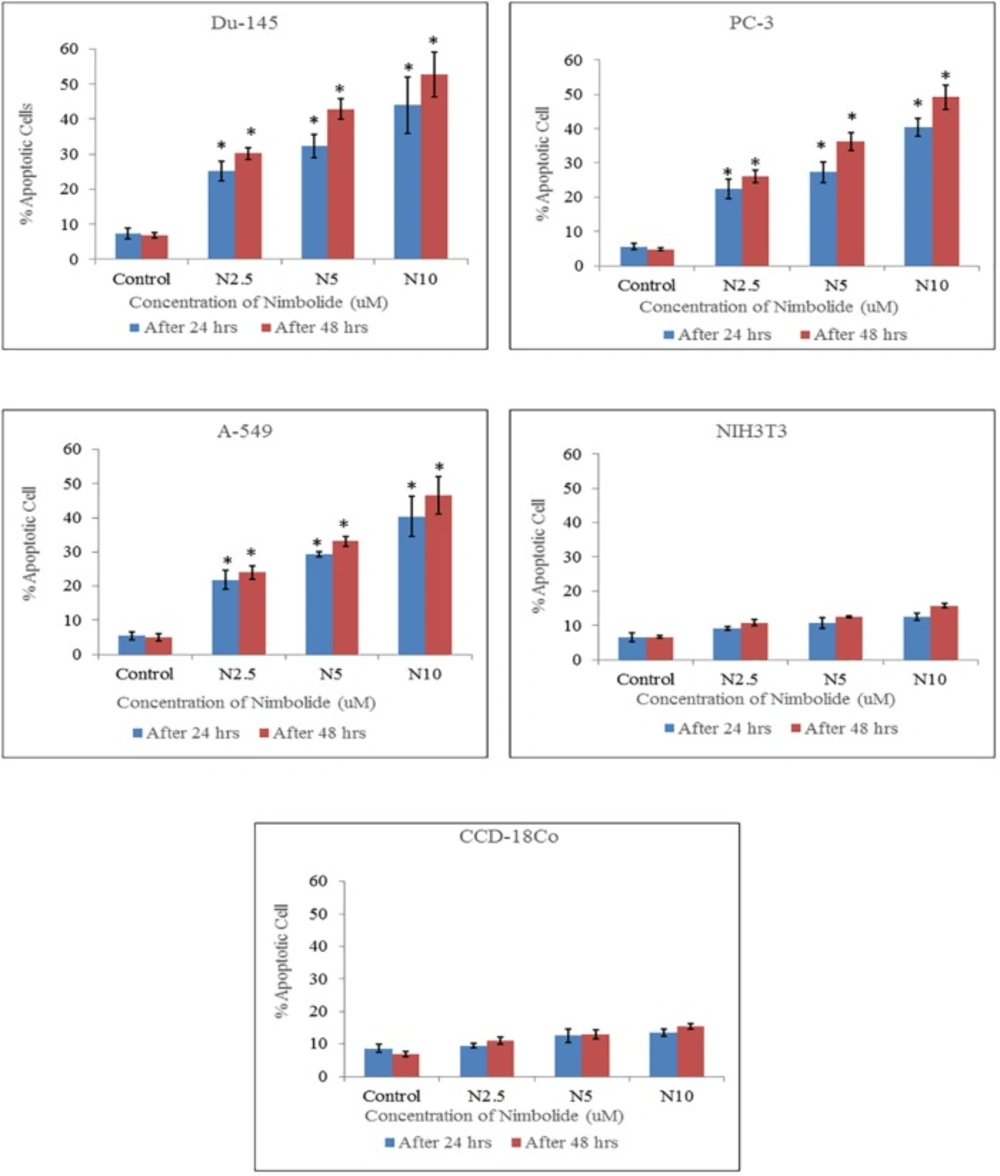
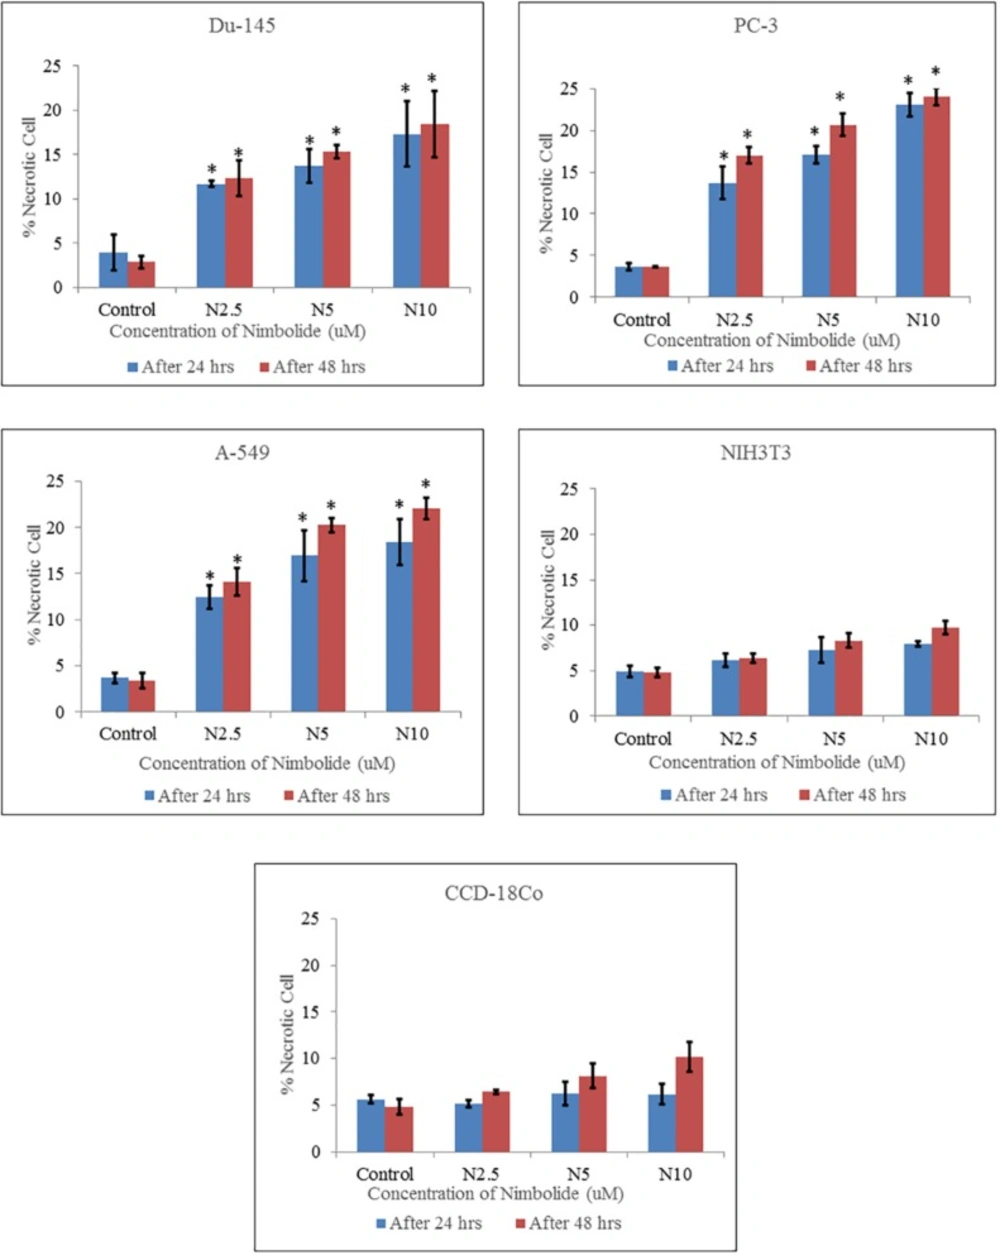
Propidium Iodide-Hoechst double staining
The cells were treated with different concentrations of nimbolide (0, 2.5, 5 and 10 uM) and grown in 6 well tissue culture plate (5 × 10
5 cells/well) for 24 h and 48 h. After that, the cells were trypsinized by adding 1 mL of trypsin-EDTA (0.25%) and put in a CO
2 incubator for 5 min. Trypsinization was terminated by adding complete medium and the cells were centrifuged. After washing with PBS, the cells were suspended in Hoechst 33342 solution (10 ug/mL) and incubated for 15 min in dark. Afterwards, the cells were mixed and counterstained by adding propidium iodide solution (50 ug/mL) and placed in a CO
2 incubator for 15 min. The cells were centrifuged and the suspended cells were placed on a clean glass slide and observed immediately under a fluorescence microscope (S46; Microscopes, Inc. St. Louis, MO, USA) using dual excitations. The cells having blue chromatin with organized structure were considered normal cells, while the cells that had bright blue stained highly condensed or fragmented chromatin were considered as early apoptotic cells. On the other hand, the cells with apoptotic nuclei that had bright pink, highly condensed or fragmented chromatin were considered as late apoptotic cells and yet the cells with normal nuclei that had pink chromatin with organized structure were declared as necrotic/dead cell. All the cells were stained in triplicate. At least 300 cells were counted and quantified for percentage apoptosis and necrosis according to the following formula (
25,
26).
Flow cytometry analysis
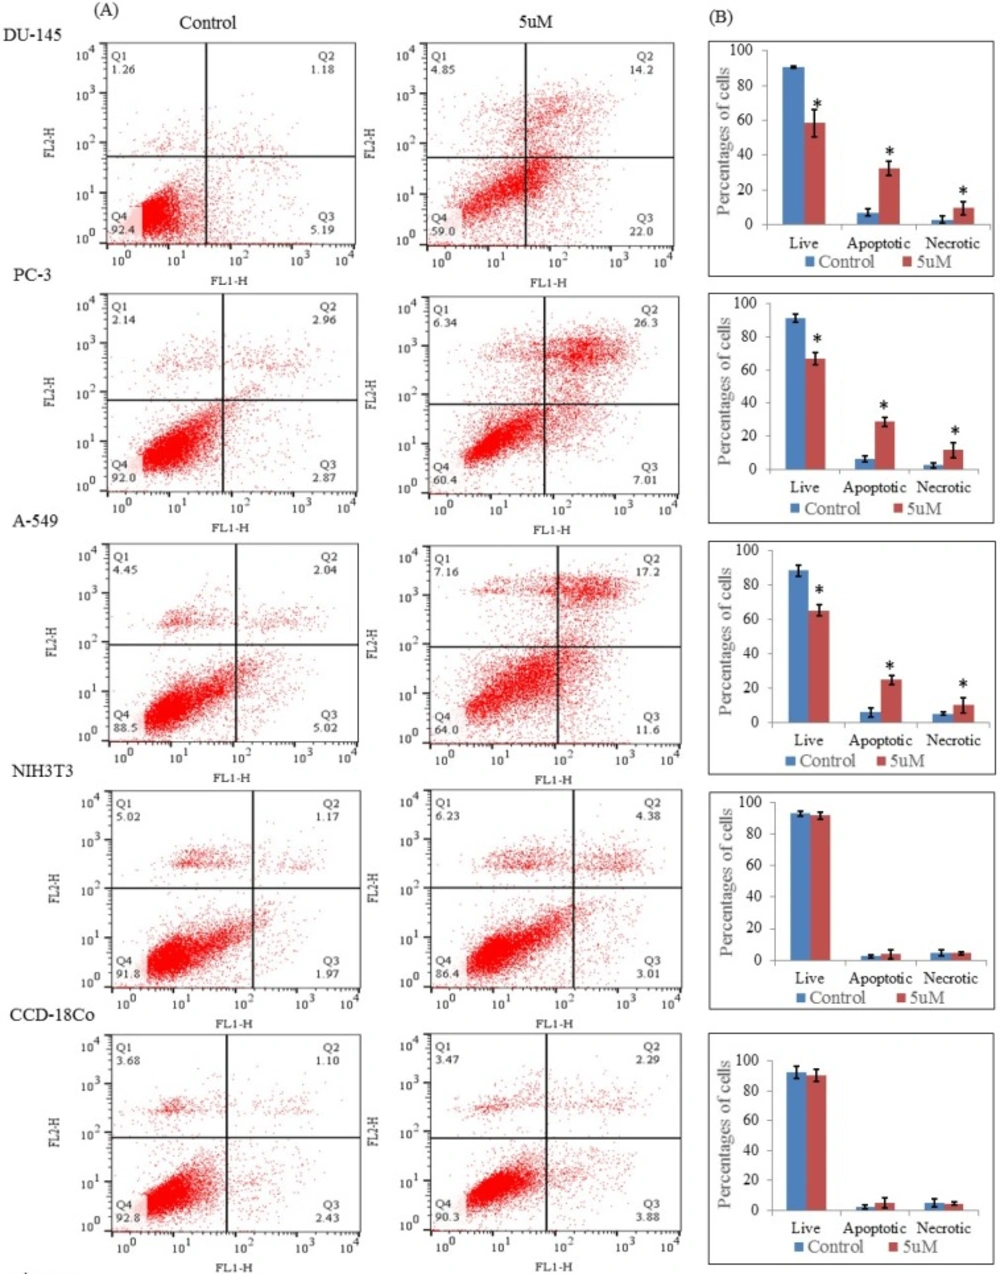
Apoptosis was also detected by staining with annexin V and propidium iodide by using the FITC annexin-V/Dead cell apoptosis kit (Invitrogen, USA) according to the manufacturer’s instruction. Briefly, the cells were treated with nimbolide (5 uM) and grown in 6 wells tissue culture plate for 24 h. After that, cells were washed with PBS and suspended in 100 uL 1x annexin binding buffer (prepared by adding 1 mL of 5x annexin buffer into 4 mL deionized water), 5 uL of FITC annexin V and 1 uL of the propidium iodide (100 ug/mL) working solution to each 100 uL of cell suspension.
The cells were incubated for 15 min at room temperature. Subsequently, 400 uL of 1x annexin binding buffer was added, mixed gently and analyzed by flow cytometer equipped with an argon ion laser tuned to 488 nm wavelengths (Becton Dickinson FACS Calibur, Heidelberg, Germany).
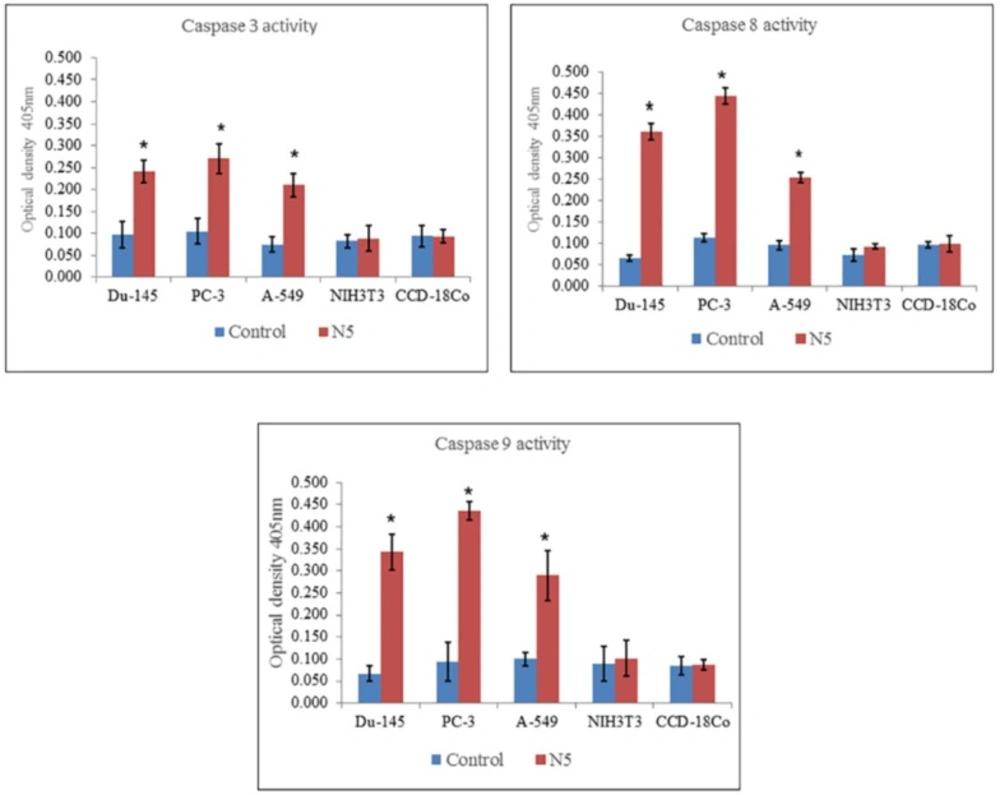
Caspase 3, Caspase 8 and Caspase 9 Activity Assay
The activity of caspase 3, 8, and 9 was measured using caspases/FLICE colorimetric assays kits. These assays are based on the spectrophotometric detection of the chromophore p-nitroaniline after cleavage from the labeled substrates DVED- pNA, IETD-pNA and LEHD-pNA for caspases 3, 8, and 9, respectively. Briefly, the cells were treated with nimbolide (5 uM) for 24 h. After that the cells were trypsinized and pelleted (1 x 10⁶ cells) in all groups.
The cell pellets were resuspended in a 50 uL chilled cell lysis buffer and incubated for 10 min on ice. Lysed cells were centrifuged at 10,000 × g at 4 °C for 1 min. Lysate proteins in equal amounts from each sample were added to 96 wells tissue culture plate, 50 uL of 2X reaction buffer (containing 10 mM DTT) and 5 uL pNA-conjugated substrates (DEVD-pNA, IETD-pNA and LEHD-pNA; substrates for caspases 3, 8 and 9, respectively) were also added and placed at 37 °C for 2 h in CO2 incubator according to manufacturer’s instructions. The amount of pNA released was measured at 405 nm using an ELISA microplate reader (Emax, Molecular Device, Sunnyvale, CA, USA). Each of the caspase activity was expressed by the value of OD 405.
Statistical analysis
All the experiments were performed in triplicates and the data were presented as means ± standard deviation. Statistically significant difference between treated cells and untreated control cells was analyzed through one-way analysis of variance (ANOVA) using IBM SPSS Statistics 24, followed by posthoc analysis. p < 0.05 was considered statistically significant.