IR Spectra
The tentative assignments and the wavenumbers of the vibrational modes of functional groups in the complexes are presented in the experimental section. The IR spectra exhibiting sharp bands at 2128 cm
-1 for
C1 and 2156 cm
-1 for
C3 are attributed to the terminal cyanido groups, while these absorption bands at 2128 cm
-1 and 2129 cm
-1 are for free [Ni(CN)
4]
2- and [Co(CN)
6]
3-, respectively. In the spectrum of
C2 three peaks are observed at 2173, 2154, 2133 cm
-1 and this situation is in agreement with existence of the crystallographically different cyanido groups in its structure. These wavenumbers assigned to the
C1,
C2 and
C3 are in good agreement with the values reported in the literature (
14-
16).
X-ray study
The crystal structure is ionic and consists of [Cd (C
6H
16N
2O
2)
2]
2+ cations and [Ni (CN)
4]
2- anions as described in the literature (
14). Aslan Korkmaz
et al. (
16) reported that the asymmetric unit of polymeric
C2 consists of one trinuclear-CN-Cu1 (C
6H
16N
2O
2)-µ-O-Cu2 (C
6H
16N
2O
2)-NC-Co(CN)
4-CN-{Cu1Cu2Co3} unit and three water molecules in a one dimensional zigzag chain. The most important feature of
C2 structure is the connection with
µ1-O2 between the Cu1 and Cu2 atoms.
Inhibition of cell proliferation and cytotoxicity
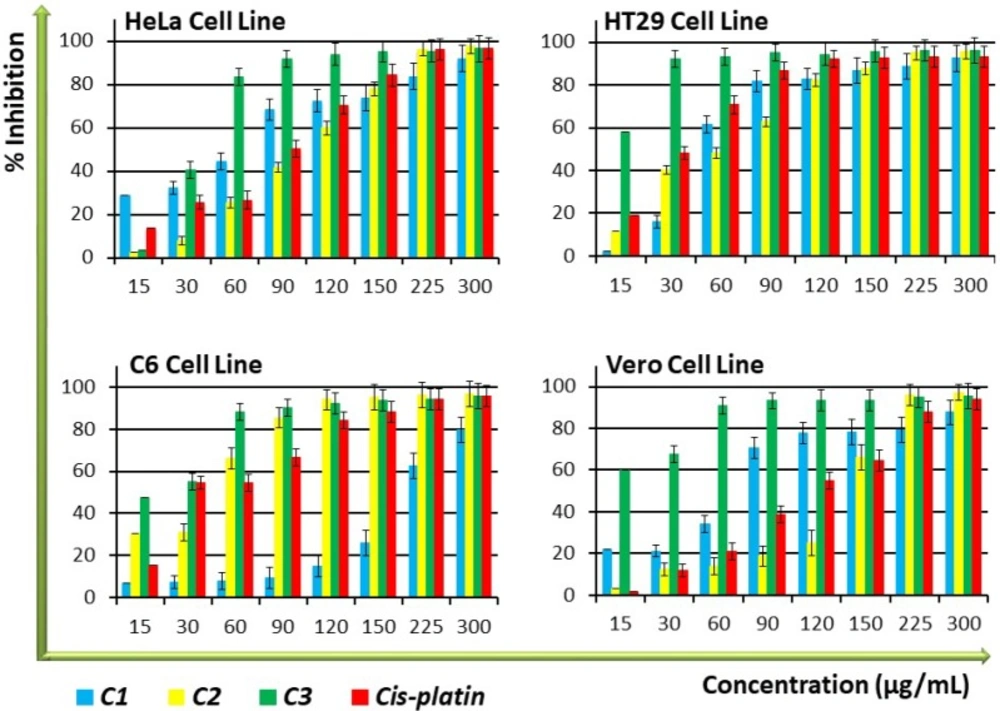
The amount of DNA in each cell is kept constant, thus DNA quantity can provide relevant information on cell numbers. To determine whether the compounds have shown any effect on the proliferation of cells, a BrdU Cell Proliferation ELISA measurement of the amount of DNA was performed on the cell lines. As shown in
Figure 1,
C3 demonstrated significantly (
P < 0.05) higher antiproliferative activity than cisplatin, the control anticancer drug, against the tested cell lines, especially at high concentrations made in a dose-dependent manner. While
C1 displayed higher antiproliferative activity than cisplatin against HeLa and Vero cell lines,
C2 exhibited antiproliferative activity that was equal to cisplatin, especially in the low and medium concentration groups. Antiproliferative activity of
C1 and
C2 was lower on nontumourigenic Vero cells compared to cancer cells (
Figure 1 and
Table 1), indicating an interesting selectivity towards the cancer cells. The IC
50 values of the compounds to be used in consequent tests were determined by performing ELISA BrdU assay data calculations, as displayed in
Table 1. The data on cell proliferation inhibition demonstrated that the antiproliferative effects of C1, C2, and cisplatin are nearly identical, but that their selectivity is lower than that of cisplatin (
Figure 1 and
Table 1).
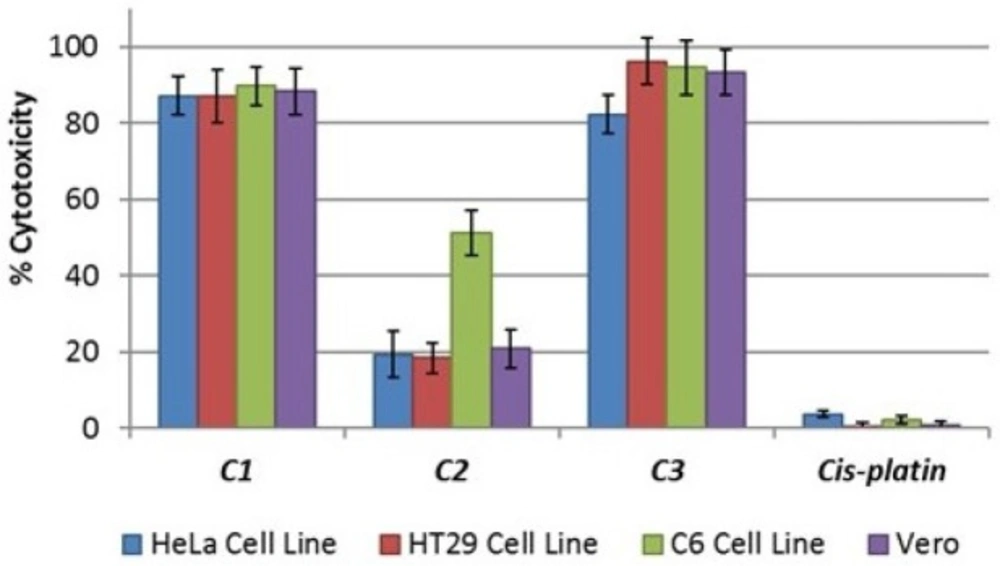
Lactate dehydrogenase (LDH) is a stable cytoplasmic enzyme that is normally found in all cells. Cytotoxicity can be determined by measuring the LDH that is released into the supernatant from damaged plasma membranes. Therefore, the cytotoxic activity of the compounds on HT29, HeLa, C6, and Vero cell lines was tested using an LDH cytotoxicity assay kit and was determined via the overnight treatment of the cells with IC
50 concentrations of the various compounds; these tests revealed the concentration-dependent detriment of the cell membranes. The data on cytotoxicity percentages indicated that the treatment of cells with IC
50 concentrations of
C1 and
C3 resulted in the significant corruption of cell membrane integrity as compared to cisplatin (
Figure 2).
C2 had no cytotoxicity in the cells at IC
50 concentrations, but exhibited potent cytotoxic activity towards the C6 cell line (
Figure 2).
Apoptotic potential
Terminal deoxynucleotidyl Transferase (TdT) is a type of DNA polymerase that is found in immature lymphoid cells. This enzyme (TUNEL reaction) preferentially uses the fluorescence-dUTP to label DNA strand breaks that occur during apoptosis. We performed a TUNEL assay to ascertain whether the test compound-induced inhibition of cell proliferation was associated with cell apoptosis. The TUNEL reaction would prefer to mark DNA strand breaks generated during apoptosis as compared to necrosis. As illustrated in
Figure 3, the compounds, especially the
C2 and
C3 treated cells, displayed a higher percentage of TUNEL-positive apoptotic cell nuclei (
P < 0.05)—thus indicating the presence of apoptotic DNA—whereas the DMSO control contained TUNEL-negative cell nuclei. For each concentration, the apoptotic index was determined by counting the percentage of TUNEL-positive cells from at least 100 nuclei. The apoptotic index was roughly > 30% for
C2 and
C3 at IC
50 concentration and approximately > 50% for
C1 at IC
50 concentration.
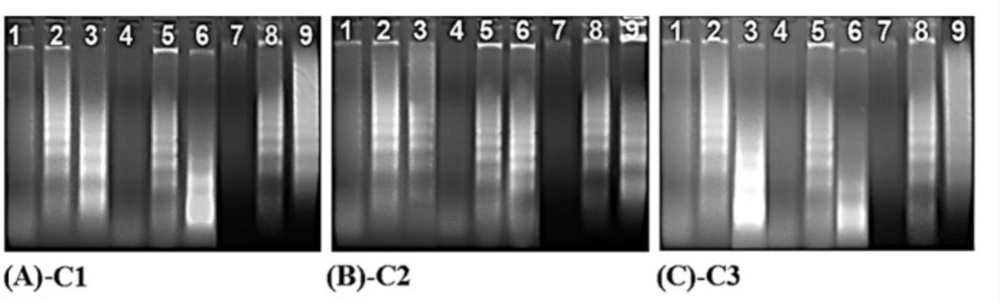
DNA fragmentation
DNA fragmentation is a significant marker of cellular apoptosis. In this process, genomic DNA was cleaved onto the nucleosome oligomers of about 180–200 base pairs via a caspase-activated DNase (CAD). These oligomers appeared as a DNA ladder on an agarose gel. The cells were subjected to IC
50 concentrations of the compounds to further confirm the cell apoptosis revealed by these compounds. As shown in
Figure 4, DNA laddering patterns were photographed in the cells treated with IC
50 doses of the compounds. Hence, all compounds significantly induced the formation of DNA fragmentations (a sign of apoptosis) in HT29, HeLa, C6, and Vero cell lines as compared to the control cells (
Figure 4).
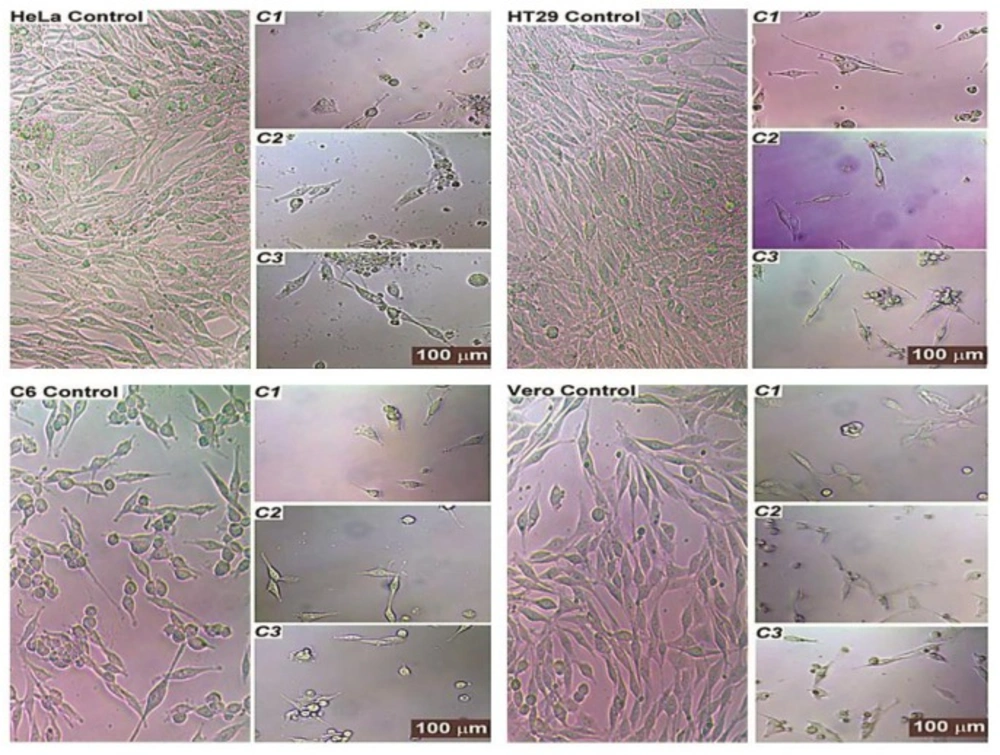
Cell morphology
The morphology of test compound-treated cells revealed typical features of apoptosis such as cell shrinkage, the formation of apoptotic bodies, chromatin condensation, and the atypical shape of floating cells; these are all hallmarks of the cell death. The compounds significantly inhibited the growth of the cells in the cultures. The control groups, however, showed complete confluent growth and normally proliferating cells.
Most of the treated cells had an abnormal fibroblast-like appearance and were detached from the plate; while this resolved upon treatment, the number of cells seemed to be lower and the cells began to separate from one another and to appear smaller. Treatment with test compounds also showed the significant detriment of cells, as cell growth was affected and cellular morphology became similar to that seen in apoptotic situations. The number of cells also decreased and cells began to appear structurally different from untreated cells. The results in
Figure 5 demonstrate the normal structure of the most control cells that effectively grew in the medium.
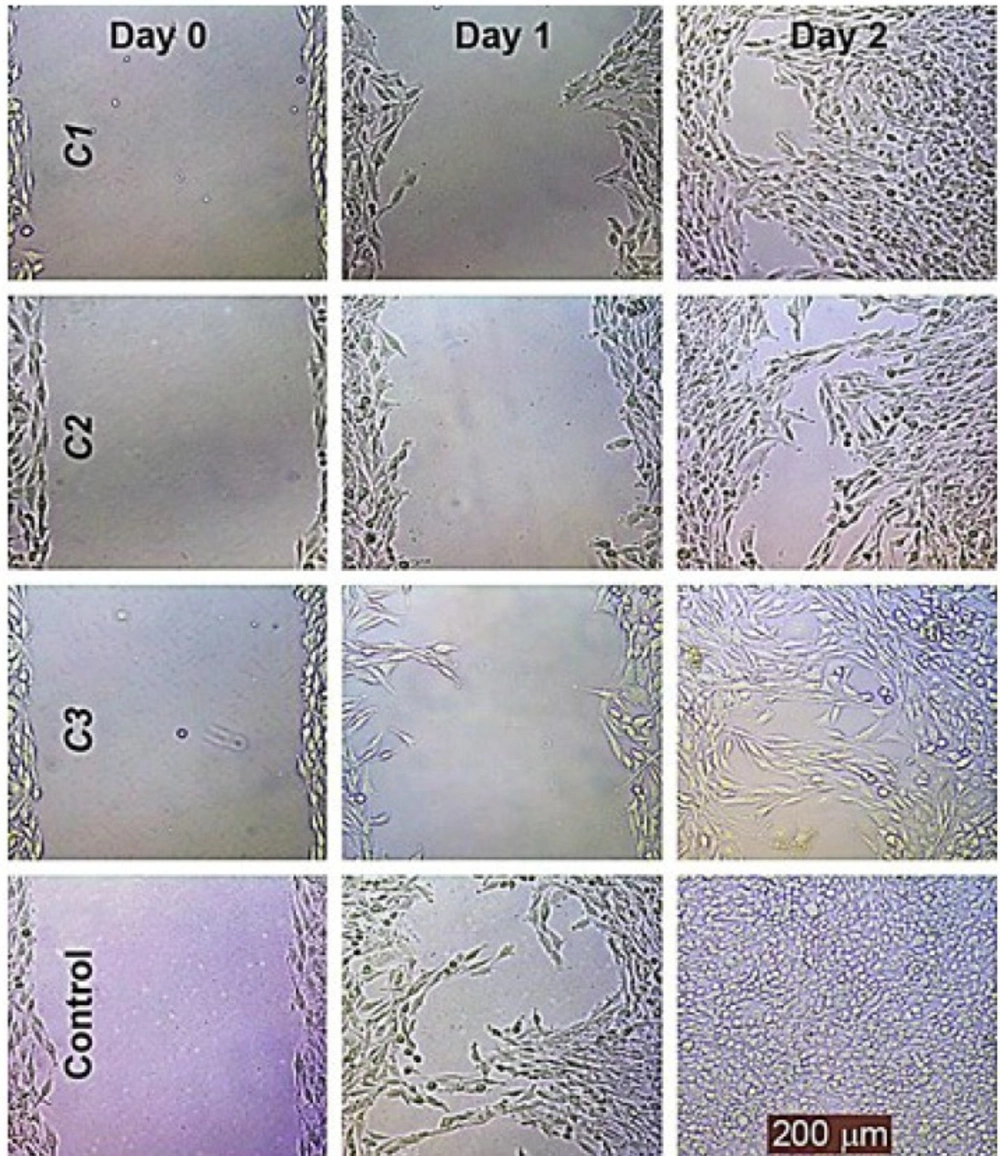
Cell migration
The representative photographs depicted in
Figure 6 show the lower migration capability of HeLa cells treated with these compounds at 30% maximal inhibitory concentration (IC
30) as compared to the untreated controls using the migration assay.
These compounds dramatically inhibited HeLa migration in a concentrated and time-dependent manner; it should be noted that the lowest effective concentration was 20% maximal inhibitory concentration (IC20) in the migration assay.
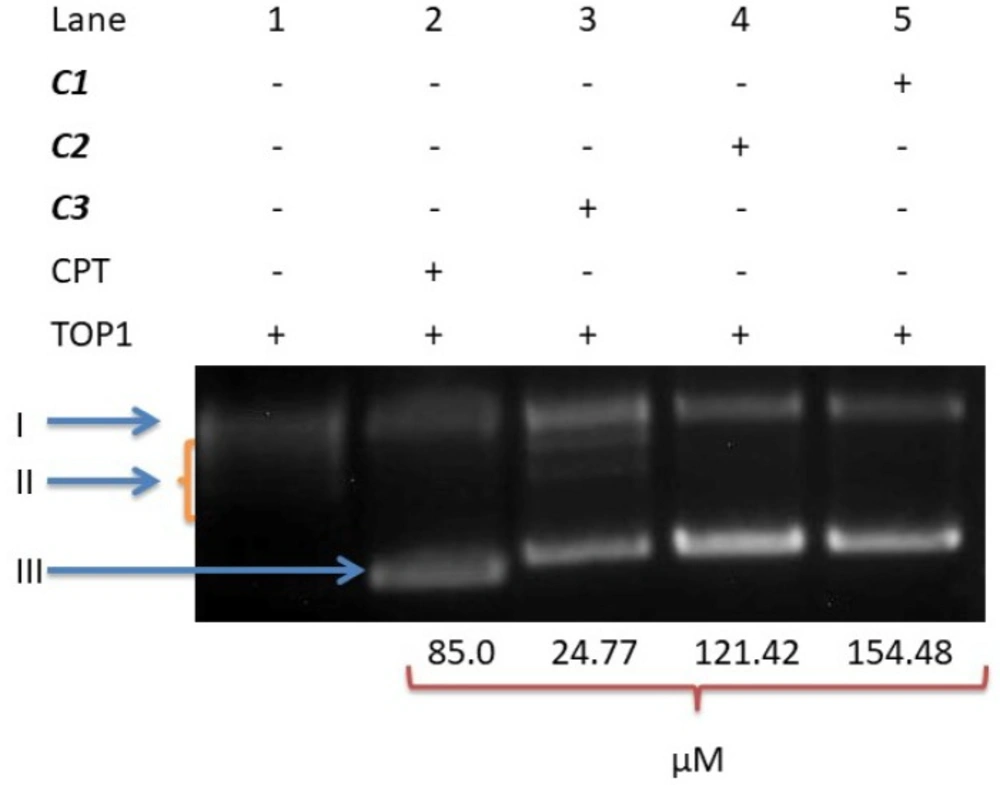
DNA topoisomerase I inhibitory activity of C1, C2 and C3
DNA topoisomerase I is a nuclear enzyme that plays an important role in the control of topological state DNA; this enzyme is essential to cell viability. Therefore, DNA topoisomerase I is an important target of current medicinal agents such as camptosar, irinotecan, and topotecan. Thus, in order to better understand whether the antiproliferative activity of these compounds involves the inhibition of DNA topoisomerases, we investigated the effects of our compounds on the recombinant human topoisomerase I-mediated relaxation of supercoiled plasmid (pHOT1) DNA.
As shown in
Figure 7, the IC
50 concentrations of
C1 and
C2 used in this experiment inhibited the DNA relaxation activity of DNA topoisomerase I;
C3, however, did not inhibit this enzyme activity.
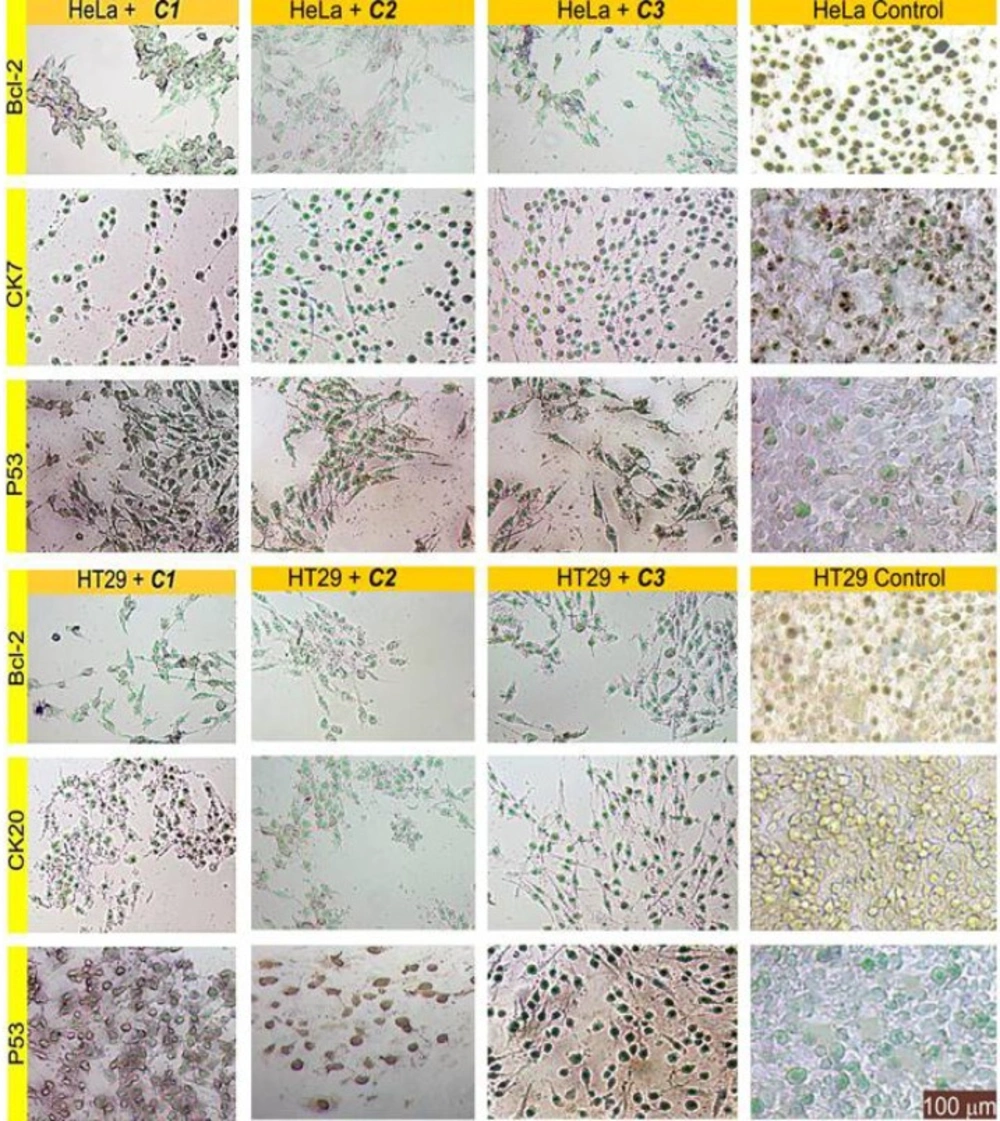
IHC evaluation of slides treated by the complexes
Immunohistochemistry staining of the sectioned slides showed the decreased expression of Bcl-2 and the increased expression of P53 as an expected observation in points of cell survival in complex-treated cells; this emphasises the deadly effects of these compounds (
Figure 8). There are closed aspects of these findings in relevant literature (
6,
13).
The results also depicted that delivery of the complexes into cells caused a significant reduction in the expression of CK20 and CK7. This situation can be associated with reduced metastatic ability due to the anti-migratory effects of these compounds.
DNA/BSA binding and gel electrophoresis studies
Complex-DNA interactions can be investigated via a comparison of UV-V absorption spectra of the free complex and complex-DNA adducts (
25). The binding constant (
K) of
C1,
C2 or
C3 with DNA can be determined according to the Benesi-Hildebrand equation,
A0/A-A0=ƐG/ƐH–G-ƐG+ƐG/ƐH–G-ƐGx1/K[DNA], where K is the binding constant,
A0 and
A represent the absorbances of either
C1,
C2, or
C3 and its adduct with DNA and
ƐG and also
ƐH–G signify the absorption coefficients of the complexes and the complex-DNA adducts (
25). The binding constant can be obtained from the intercept-to-slope ratio of
A0/ (A - A0) vs.
1/[DNA] plots.
Figure 9A describes the interaction of these complexes with CT-DNA. According to the Benesi-Hildebrand equation, the plot of
A0/(A–A0) vs.
1/[DNA] data yielded the binding constant (
K), which was 1.2 x 10
4 M
-1 for
C1, 1.4 x 10
4 M
-1 for
C2 and 3.2 x 10
4 M
-1 for
C3 (
Figure 9A). The increase in CT-DNA concentrations resulted in hyperchromic effects in the absorption bands, with a moderate red shift indicating a strong interaction between the complexes and DNA. This hyperchromic effect on the spectra of the complex-DNA adduct might be indicative of groove binding.
An understanding of the properties associated with the complex interactions of bovine serum albumin (BSA), which is the main carrier protein in the circulatory system, can provide more information about pharmacological features. The interaction of these complexes with BSA can be observed via a comparison of UV-Visible absorption spectra and the emission spectra of the free complex and complex-BSA adducts. The absorption spectra of the BSA solutions (0-100 μM) in the absence and presence of the complexes (25 μM) are shown in
Figure 9B. The complexes caused an increase in the absorbance of BSA and exhibited a slightly blue shift, indicating Van der Waals contacts or hydrogen bonds during interaction with BSA. Isosbestic points near 265 nm and 290 nm for
C2 and 268 nm for
C1 were observed.
The emission spectra of EB bound to DNA in the absence and presence of the complexes is shown in
Figure 10, where the fluorescent intensity of EB-DNA decreased in the presence of a second molecule that intercalated itself onto the base pair of the DNA. The fluorescent quenching of EB bound to CT-DNA by these complexes is shown in
Figure 10.
The quenching parameters of EB bound to CT-DNA by these complexes were evaluated using the linear Stern-Volmer equation (I0/I = 1 + KSV [Q]), which provided further evidence that the complexes bind to DNA (25). The KSV values for C1, C2 and C3 are 1.2 x 10⁴ M-1, 4.3 x 10⁴ M-1, and 5.6 x 10³ M-1, respectively. The data suggested that the interaction of C3 with CT-DNA was the strongest of these three complexes. Interestingly, the C3 complex caused obvious increases in emission intensity, indicating that the C3 complex replaced EB when binding to CT-DNA, thus acquiring fluorescent features.
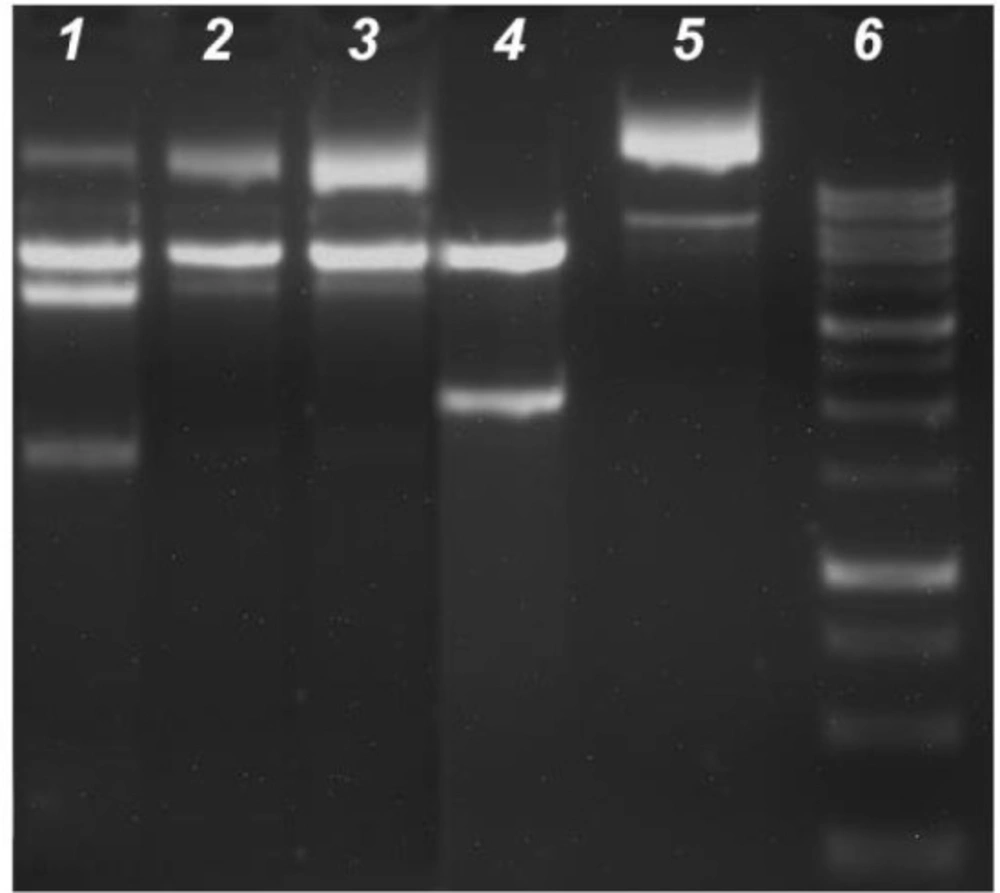
After
KpnI and
BamHI digestion of pTOLT plasmid DNA, the digestion products were identified by two DNA bands in the absence complexes (Lane 4), whereas four bands (Lane 1) were produced in the presence of
C3 and three bands were displayed in the DNA fragments of
C1 and
C2 (Lane 2 and Lane 3) (
Figure 11). In the presence of
C3, DNA digestion was incomplete and the new bands were observed near the well at the top of the lane (Lane 1).
Treatment of KpnI and BamHI with C1 or C2 strongly inhibited the restriction of endonuclease activity in these enzymes; thus, three bands corresponding to the supercoiled and nicked DNA were observed in the undigested DNA (Lane 5). The results indicated that C3 likely bound to pTOLT plasmid DNA. However, C1 and C2 most likely bound to these enzymes, which resulted in the strong inhibition of restricted endonuclease activity in KpnI and BamHI (Lane 2 and Lane 3).
Antiproliferative activity of C1-C3 and positive control compound, cis-platin on HT29, HeLa, C6, and Vero cell lines. Percent inhibition was reported as mean values ± SEM of three independent assays (P < 0.05). Each experiment was repeated at least three times for each cell line
Cytotoxic activity of C1-C3 on HT29, HeLa, C6, and Vero cell lines. Percent cytotoxicity was reported as mean values ± SDs of three independent assays (P < 0.05)
Fluorescence (left side) and phase-contrast (right side) images of the HT29 cancer cells treated with C1-C3 at IC50 concentration, DMSO (NC) after TUNEL assay. TUNEL-positive cell nuclei were observed in brilliant green under fluorescence. NC (negative control)
The effects of C1 (A), C2 (B) and C3 (C) on DNA fragmentation in non-treated control (1, 4, 7), positive control treated with camptothecin (2, 5, 8) and sample treated with the compounds (3, 6, 9) of HeLa, HT29 and C6 cancer cell lines, respectively
The effects of C1-C3 on the morphology of HT29, HeLa, C6, and Vero cells. Exponentially growing cells were incubated with IC50 concentrations of the compounds at 37 °C for overnight. DMSO treated cells as controls
The effects of C1-C3 on the migration of the HeLa cell line. The wound healing of the HeLa cell line was photographed at 0, 1 and 2 days following incubation with these compounds at 30 % maximal inhibitory concentration (IC30) using a phase contrast microscope
The DNA unwinding analysis with C1-C3. A DNA unwinding assay was performed with 250 ng pHOT-1 supercoiled DNA, 2U TOP1 and IC50 concentrations of the compounds. The forms of DNA are denoted as I (Nicked DNA), II (Relaxed DNA), and III (Supercoiled DNA)
Representative images of the cells examined by immunohistochemical staining for functional protein group (Bcl-2 and P53), and for marker protein group (CK7 and CK20). The specific signals are shown as brown staining
(A) UV–Visible absorption spectra of 25 µM C1, C2 and C3 in the absence (a) and presence of 25 μM (b), 50 μM (c), 75 μM (d) and 100 μM (e) DNA. Note: The direction of arrow demonstrates increasing concentrations of DNA. Inside graph is the plot of A0/ (A–A0) vs. 1/[DNA] to find the binding constant of the complex–DNA adduct. (B) Absorption spectra of 25 µM C1, C2 and C3
The emission spectra of EB-bound (a) DNA solutions in the absence and presence of increasing concentrations of C1-C3 25 μM (b), 50 μM (c) and 75 μM (d). [EB]=10.0 μM (a), [DNA] 50.0 μM. The arrows show the changes in intensity upon increasing amounts of C1, C2 or C3. Insets: Stern–Volmer plot of the fluorescence data. Inset shows the plots of emission intensity I0/I vs. [Q] (µM) for determining KSV
The inhibition of KpnI and BamHI restriction endonucleases activity. Following 4 h 37°C digestion of the 14µL with 10 UKpnI and BamHI, these digestion products were resolved with 1.5% agarose gel containing ethidium bromide. Lane 1: enzyme + DNA+ C3, Lane 2: enzyme + DNA + C2, Lane 3: enzyme + DNA + C1, Lane 4: Positive control (enzyme + DNA), Lane 5: Negative control (plasmid DNA + water); lane 6: DNA marker (1Kb)
| Compounds | IC50 (µM)
|
|---|
| HeLa | HT29 | C6 | Vero |
|---|
| C1 | 159.27 | 154.48 | 364.58 | 177.92 |
| C2 | 176.72 | 121.42 | 86.67 | 210.47 |
| C3 | 100.41 | 24.77 | 49.47 | 22.17 |
| Cis-platin | 352.12 | 167.66 | 233.89 | 447.48 |


![(<b><i>A</i></b>) UV–Visible absorption spectra of 25 µM <b>C1</b>, <b>C2 </b>and <b>C3 </b>in the absence (a) and presence of 25 μM (b), 50 μM (c), 75 μM (d) and 100 μM (e) DNA. Note: The direction of arrow demonstrates increasing concentrations of DNA. Inside graph is the plot of <i>A</i><i>0</i><i>/ (A–A</i><i>0</i><i>) </i>vs. <i>1/[DNA] </i>to find the binding constant of the complex–DNA adduct. (<b><i>B</i></b>) Absorption spectra of 25 µM <b>C1</b>, <b>C2 </b>and <b>C3</b>](https://brieflands.com/journals/ijpr/articles/126275/figures/ijpr-18-2011-g009-preview.webp)
![The emission spectra of EB-bound (a) DNA solutions in the absence and presence of increasing concentrations of <b>C1-C3 </b>25 μM (b), 50 μM (c) and 75 μM (d). [EB]=10.0 μM (a), [DNA] 50.0 μM. The arrows show the changes in intensity upon increasing amounts of <b>C1</b>, <b>C2 </b>or <b>C3</b>. Insets: Stern–Volmer plot of the fluorescence data. Inset shows the plots of emission intensity <i>I</i><i>0</i><i>/I </i>vs. <i>[Q] </i>(µM) for determining <i>K</i><i>SV</i>](https://brieflands.com/journals/ijpr/articles/126275/figures/ijpr-18-2011-g010-preview.webp)