1. Background
Methotrexate (MTX) or amethopterin is an anticancer drug that can suppress the immune system and interrupt the deoxyribonucleic acid production in cancer cells to halt or decrease unusual cell growth and division. A high dose of MTX (1 to 5 g/m2) is usually prescribed in some diseases to penetrate the tumor cells and blood-brain barrier to overcome possible drug resistance (1). To date, MTX has been broadly utilized to treat a broad range of cancers, including breast cancer, head and neck cancer, and leukemia (2). In addition, MTX is utilized as an anti-inflammatory drug for the treatment of diverse forms of arthritis. The MTX has a narrow therapeutic dose window. Normal cells (especially renal and liver) could also be affected by MTX and cause the side effects of hepatotoxicity and nephrotoxicity with high incidences (3).
The serum concentrations of MTX should be checked to retain within the range of 0.1 - 10 µM. Based on a report, a high dose of MTX can cause about 6% death incidence (4). Therefore, clinicians try to balance the MTX dose to decrease the side effects by optimizing the dose and the time of administration to secure the efficacy of therapy and decrease possible side effects. For the achievement of this aim, therapeutic drug monitoring (TDM) for MTX is of great importance and has been implemented in medical centers.
Immunoassay-based, high-performance liquid chromatography (HPLC) and HPLC-mass spectrometry methods are currently used to detect MTX concentrations in biological samples. However, immunoassay approaches suffer from insufficient dynamic range and expensive and exhausting protocols (5). The HPLC separation-based methods can largely enhance the specificity of MTX detection; nevertheless, their applications are hindered by some disadvantages, including extended analysis time and the need for highly skilled individuals to operate. Mass spectroscopy-based HPLC techniques provide more sensitive and specific approaches with lowered analysis time. In general, HPLC-based methods are high-cost that might not be provided by all clinical centers. Therefore, a highly sensitive and specific probe is needed for the routine TDM of MTX in biological fluids.
Researchers have developed several analytical techniques to detect MTX with different sensory systems, including optical, electrochemical, and separation-based methods. Liquid chromatography (with various detecting systems) (6, 7), fluorescence (8), electrochemistry (9), and electrophoresis (10) are the most applied techniques for MTX detection. Although the reported methods offer comparatively acceptable sensitivity and specificity, some have limitations. As previously mentioned, liquid chromatography methods are high-cost and time-consuming methods, and operating procedures are usually very complicated. Electrochemical methods show high sensitivity and ability to fabricate diverse types of sensing; however, their repeatability is questionable (11, 12). However, optical-based approaches are simple and cheap with low-cost and simple instrumentation (13). The routine absorption spectroscopy and naked-eye approaches, which directly approximate the colored products, generally suffer from low sensitivity due to the restricted amplification degree of the analyte signal. Optical-based methods, especially luminescence, provide high sensitivity, which is comparable to or better than the electrochemical and separation-based methods. The main problem of optical-based approaches is the influence of interfering agents (14) which could be reduced on the analyte signal through different approaches, such as protein precipitation and extraction methods.
Carbon dots (CDs) are zero-dimensional new advanced nanomaterials with sizes smaller than 10 nm. Regarding the type of carbon precursor and the structure, CDs could be categorized into three large types, including carbon quantum dots, carbon nanodots, and graphene quantum dots (15). The CDs possess several benefits in sensing due to their exceptional optical and morphological properties. The high luminescence emission of CDs is their main advantage with the capability to change the emission wavelength. The size-tunable fluorescence emission of CDs can be regulated through changes in reactants (or precursors), reaction conditions, and doping of various heteroatoms. Generally, the near-infrared region is the best range for fluorescence emission due to the fact that ultraviolet emission can be harmful to biomolecules, and visible emissions are mainly absorbed by various biological molecules (16).
The photostability of CDs is another advantage. As compared to traditional fluorophores, such as organic dyes, CDs are highly stable materials even in the body, which confirms their low bleaching in the body. In addition, the produced CDs showed high stock solution stability, which could be stored at ambient temperature for months. As compared to organic dyes, CDs are biocompatible materials and could be used as biosensing probes without any serious effect on the organism (17). In addition, several surface functional groups, such as hydroxyl, aldehydes, carboxylic acid, and amines, are available on the surface of CDs which could be applied for secondary modifications. Furthermore, the synthesis and production of CDs are simple and cheap. These unique benefits of CDs propose various approaches for sensitive and specific sensing of different analytes. Furthermore, highly fluorescent CDs are appropriate for high-resolution bioimaging of tumor cancer cells (17).
The current study synthesized novel nitrogen, sulfur, phosphorus, and boron-doped (N, S, P, B-codoped) CDs for the first time through a simple hydrothermal approach. The produced N, S, P, B-codoped CDs were applied as a fluorescence nanoprobe for the sensitive and specific detection of MTX in real plasma samples and cell lysates. Additionally, the produced CDs showed a potential for bioimaging cancer cells. It is noteworthy that the produced CDs showed biocompatible nature even at high concentrations, confirmed as nontoxic agents for cell bioimaging (18, 19).
2. Methods
2.1. Materials
3-(4,5-Dimethylthiazol-2-yl)-2,5-diphenyltetrazolium bromide (MTT) was obtained from Sigma-Aldrich (Taufkirchen, Germany). Phosphate-buffered saline (PBS) and dimethyl sulfoxide (DMSO) were provided by Merck Company (Darmstadt, Germany). Fetal bovine serum (FBS) and Roswell Park Memorial Institute (RPMI) 1640 growth medium were obtained from Gibco BRL Life Technologies (New York, USA). Penicillin/streptomycin (as antibiotic and antifungal) and trypsin (25%) solutions were obtained from Biowest Company (Nuaillé, France). MCF-7 cells were purchased from National Cell Bank of Iran (NCBI) (Tehran, Iran).
2.2. Apparatus
Fluorescence spectra were recorded by a Hitachi (Tokyo, Japan). The morphology and particle size of the nanomaterials were determined by field emission scanning electron microscopy (FESEM) through a FEG-SEM MIRA3 TESCAN (Brno, Czech Republic) and transmission electron microscopy (TEM) by Carl Zeiss LEO 906 electron microscope operated at 100 kV (Oberkochen, Germany), respectively. Energy-dispersive X-ray (EDX) analysis was also determined by the FESEM technique. Fourier-transform infrared spectroscopy (FTIR) spectra were captured through a Shimadzu model FTIR prestige 21 (Tokyo, Japan). Surface charge and nanoparticle sizes were determined by a Malvern particle size analyzer (Malvern, UK). The MTT assay was measured at 570 nm by an enzyme-linked immunosorbent assay (ELISA) plate-reader (Florida, USA). Fluorescence microscopy images were captured by an Olympus microscope Model Bh2-RFCA (Tokyo, Japan).
2.3. Synthesis of N, S, P, B-Codoped CDs
For the first time, N, S, P, B-codoped CDs were synthesized according to an approach that will be described. Briefly, 0.1 g citric acid, 0.4 mL ethylenediamine, 25 µL H3PO4, 50 mg L-cysteine, and 25 mg boric acid were added into 15 m water in a beaker and agitated to dissolve. Then, the as-prepared mixture was filled into a 50 mL Teflon-lined stainless autoclave. Afterward, the autoclave was closed carefully, warmed up until 180°C in an oven, and retained for about 6 hours. Lastly, the autoclave was cooled to room temperature, followed by centrifugation at 10,000 rpm for 15 minutes to remove possible solids. The produced N, S, P, B-codoped CDs were kept at 4°C (20).
2.4. Biological Evaluations
2.4.1. Cell Culture and Cell Cytotoxicity Study
The MCF-7 cells were added to a flask with RPMI 1640 containing 10% FBS and 1% penicillin/streptomycin and incubated at 37°C and 5% CO2 for at least 2 days to grow up the cell to reach a confluency of about 80%. Afterward, the cells were detached using trypsin/ethylenediaminetetraacetic acid solution. For the collection of the cells, they were centrifuged at 1,500 rpm for 5 minutes. Finally, the cells were resuspended to the fresh media and counted using a hemocytometer.
The cytotoxicity of N, S, P, B-codoped CDs against MCF-7 breast cancer cells was evaluated using the MTT assay in several steps. Firstly, 1.0 × 10⁴ of MCF-7 cells per well were seeded in a 96-well microplate and incubated for 28 hours. Then, the cells were treated with different amounts of N, S, P, B-codoped CDs. Following 48 hours of incubation, the medium was replaced with a fresh medium containing 500 µg/mL MTT reagent and incubated for about 4 hours. Afterward, the medium was removed and replaced with 200 μL of absolute DMSO to solve the formazan crystals and incubated for further 30 minutes. Finally, the absorbance of each well was measured using a microplate ELISA reader at the wavelength of 570 nm. The cell toxicity of the N, S, P, B-codoped CDs was estimated as follows:
in which OD means optical density or absorbance of the wells.
2.4.2. Determination of MTX in Cell Lysates
For the determination of MTX concentration in cell lysate, 5 × 10⁵ cells/well of MCF-7 cells were cultured in a 6-well plate and incubated overnight to cover at least 80% of the 6-well surface. Then, the wells were exposed to various concentrations of MTX and incubated for 4 hours. Subsequently, the unused media was deleted, and the wells were carefully washed with PBS solution. Finally, the amount of unconsumed MTX was determined by the developed method.
2.5. Plasma Sample Preparation
The actual plasma samples were collected from patients (with an ethical committee of Urmia University of Medical Sciences approval license number of IR.UMSU.REC.1399.050ent) and stored at -4°C until the analysis time. Blank plasma samples (from healthy individuals) were provided by Iranian Blood Transfusion Organization (Tabriz, Iran).
The plasma samples were thawed at room temperature and vortexed to be homogenized. Then, the appropriate volume of plasma (0.5 mL) was added to a 2 mL microtube, and then acetonitrile (1.0 mL) was added. Afterward, the mixture was shaken and vortexed for a few seconds and then centrifuged for 10 minutes at 10,000 rpm. Finally, the precipitated proteins were discarded, and an upper liquid was used for further actions.
2.6. MTX Monitoring in Plasma
The fluorometric detection of MTX concentration was implemented at the optimized conditions. About 3 µL of N, S, P, B-codoped CDs, 0.2 mL of PBS (50 mM), 0.5 mL of plasma, and deionized water were added to reach the final volume of 1.5 mL. The fluorescent intensity was measured in the presence and absence of MTX, where the difference between them was used as the analytical signal for the determination of MTX in plasma samples.
2.7. Investigation of CDs Uptake
The MCF-7 cells at the density of 5 × 10⁵ cells/well were cultured into the 6-well tissue-culture plates. After 24 hours, the cells were exposed to the nanoparticles at different time intervals at 37°C under a 5% of CO2 atmosphere. Then, the culture medium was detached, and the cells were rinsed with sterilized PBS to remove the unconsumed culture medium. Finally, the uptake value of each well was qualitatively determined through the fluorescence microscopy technique.
3. Results and Discussion
3.1. Characterization of CDs
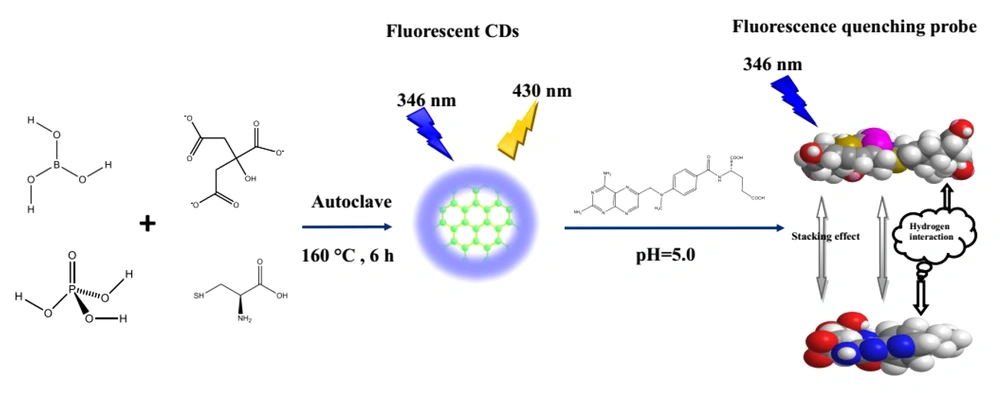
The N, S, P, B-codoped CDs were synthesized through the hydrothermal method. The citric acid, ethylenediamine, boric acid, phosphoric acid, and L-cysteine were applied as carbon, nitrogen, boron, phosphorous, and thiol sources, respectively. The synthesized N, S, P, B-codoped CDs displayed strong bright fluorescence at 430 nm, where excitation wavelength was adjusted at 346 nm. The produced CDs were employed to recognize MTX in plasma samples and cell lysates. The TEM, FTIR, FESEM, dynamic light scattering (DLS), zeta potential, and EDX were utilized to disclose the structure, morphology, surface functional groups, size, surface charge, and composition of N, S, P, B-codoped CDs, respectively. The spectral properties and physicochemical characteristics of the produced N, S, P, B-codoped CDs were explored in depth in the following subsections.
3.1.1. Size, Morphology, and Surface State of N, S, P, B-Codoped CDs
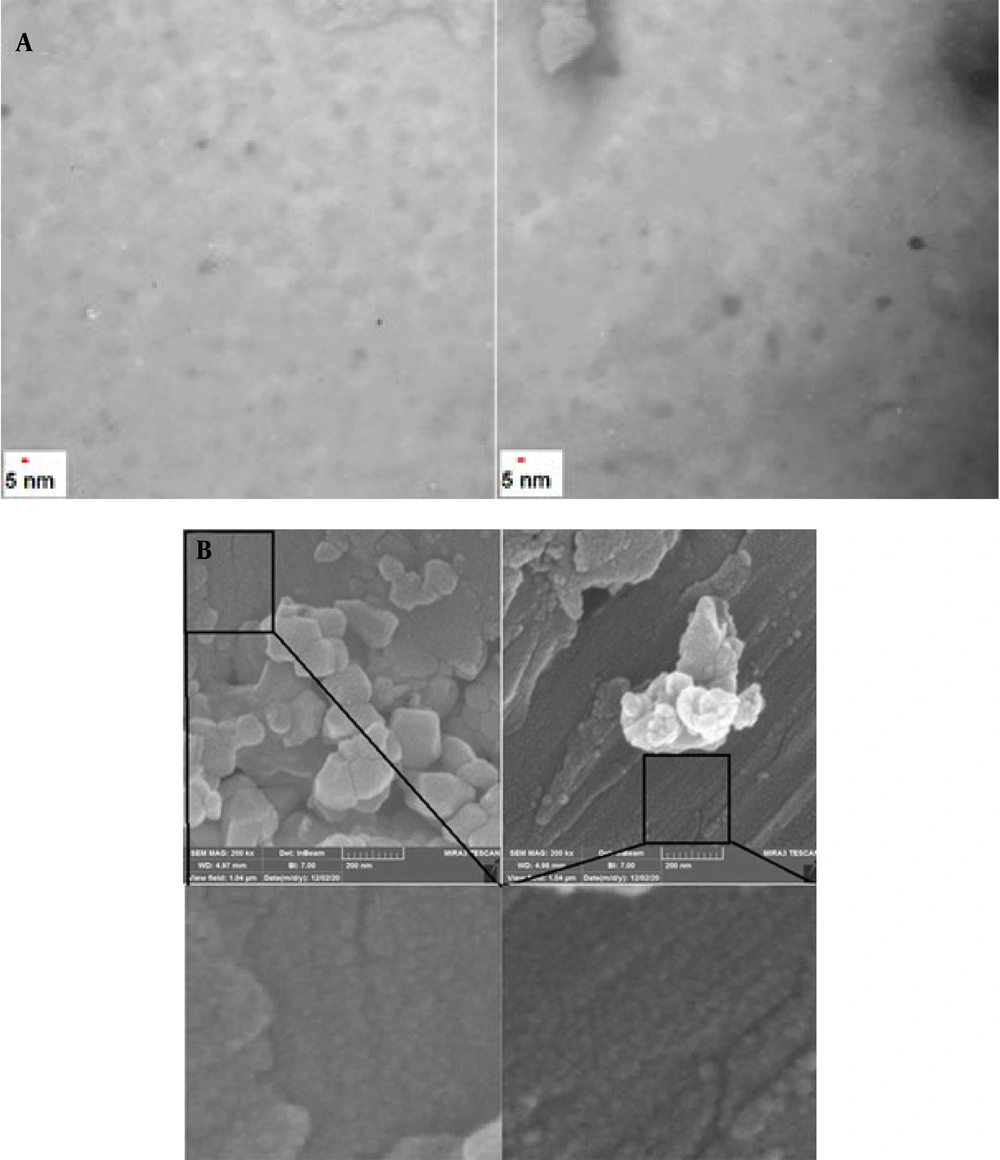
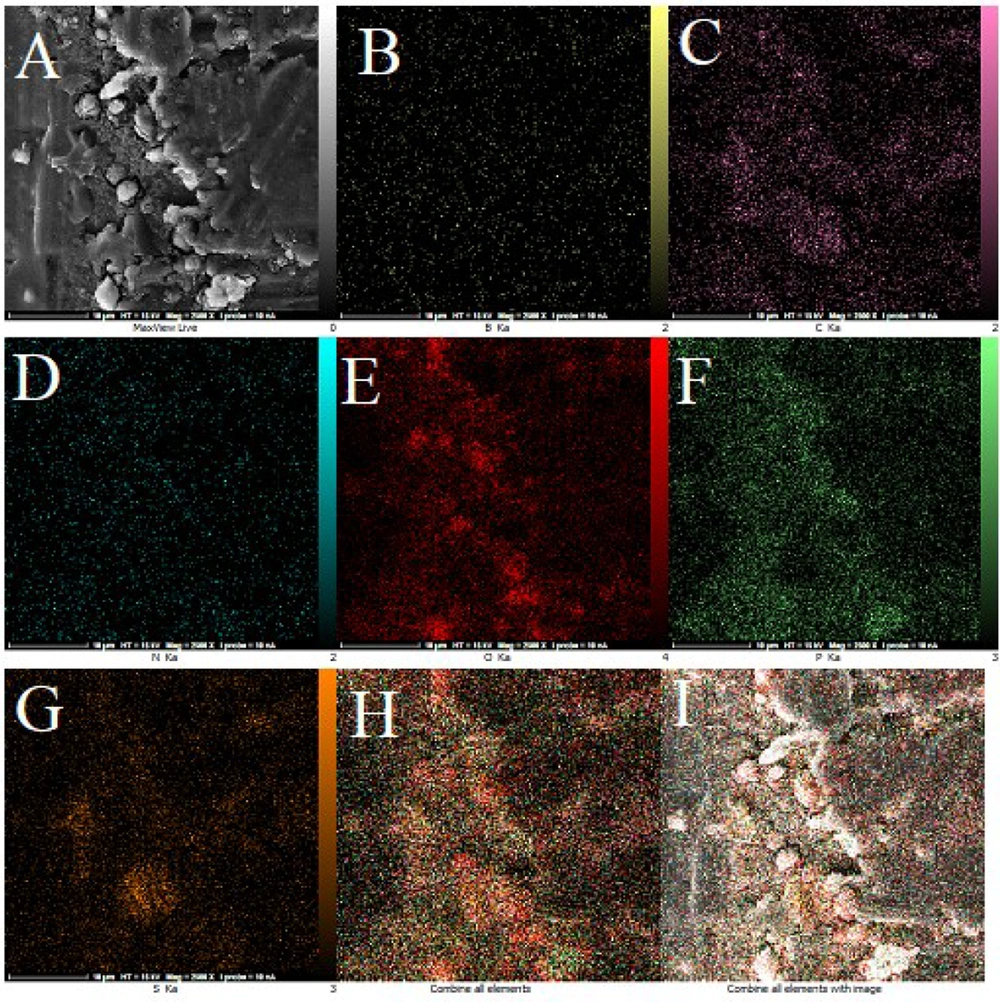
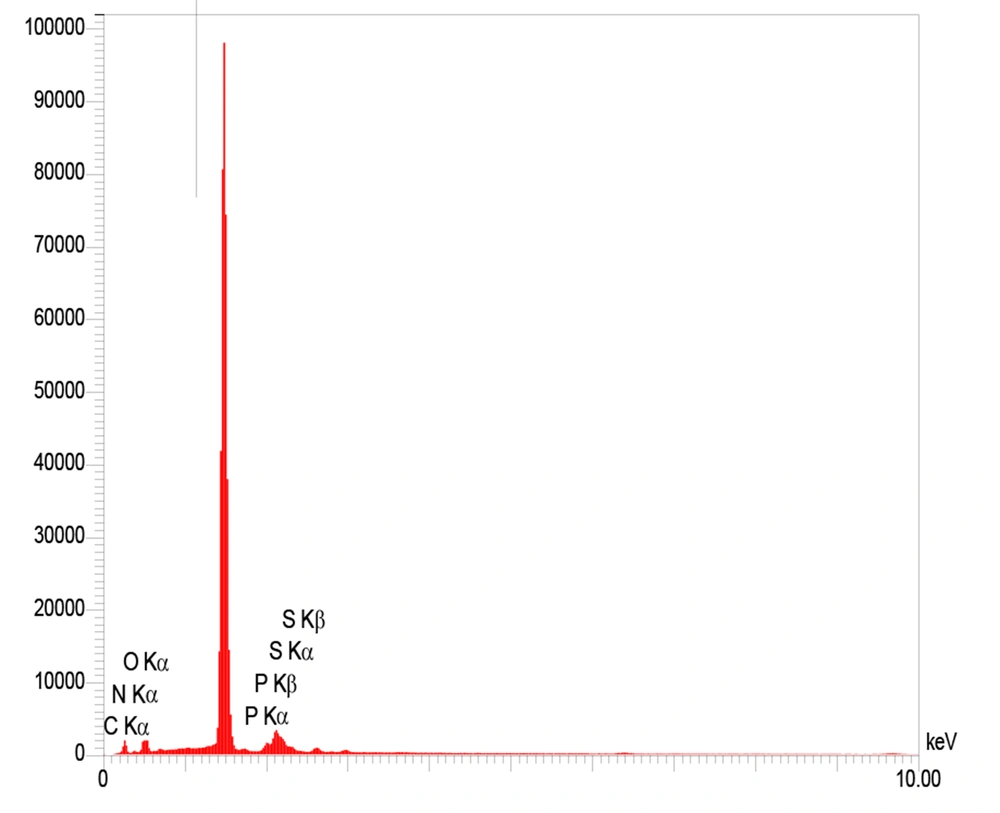
The TEM technique was employed to show the size and general shape of the as-synthesized CDs. The TEM images demonstrated that the as-produced CDs are available in high dispersity with a spherical shape and size distribution within the range of 5 - 15 nm with a mean of about 10 nm (Figure 1A). The FESEM images approved the spherical shape of the CDs (Figure 1B). Figure 2 exhibits the mapping of the composition on the structure of the CDs, inferring a high degree of functionalization of CDs with B, S, N, and P and the contribution of all elements to the structure of CDs. The EDX results revealed the elemental constituents and their percentages in the CDs. The obtained findings demonstrated that the percentages of B, C, N, O, P, and S were 2.5%, 23.7%, 7.4%, 45.1%, 13.0%, and 8.1%, respectively (Figure 3 and Table 1). The hydrodynamic diameter size of the CDs was approved using the DLS method. The obtained results confirmed the size of CDs as obtained by TEM. The overall surface charge of the as-prepared CDs was examined by the zeta potential (ζ) method, in which the surface charge was -4.0, demonstrating the acceptable stability of the nanoparticles.
| Element | W% | A% |
|---|---|---|
| B | 2.55 | 3.79 |
| C | 23.74 | 31.70 |
| N | 7.41 | 8.49 |
| O | 45.12 | 45.22 |
| P | 13.01 | 6.74 |
| S | 8.15 | 4.08 |
| Total | 100.00 | 100.00 |
Data of Energy Dispersive Spectroscopy (EDS) Analysis for N, S, P, B-Codoped Carbon Dots with Weight and Atomic Percentages
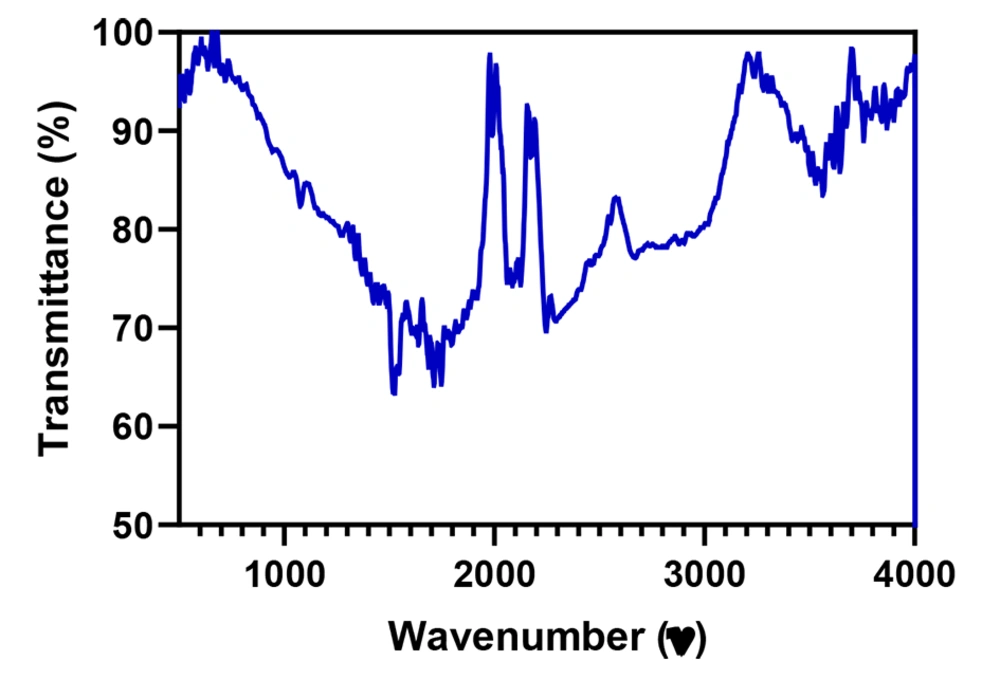
As depicted in Figure 4, the FTIR spectrum exhibited several absorbance peaks that denote the functional groups available on the CDs surface. The peaks were situated nearby 3400 and 2900 cm-1 as ascribed stretching vibrations of C–OH and C–H, respectively. Moreover, the vibrational band of C=O was located at 1750 cm-1; however, the absorption band of C–O–C appeared at 1250 cm-1. It is noteworthy that the presence of carboxyl hydroxyl and amines groups denoted the ability to attach to various molecules through hydrogen bonds and physical adsorption.
3.1.2. Photoluminescence and Spectrophotometric Study
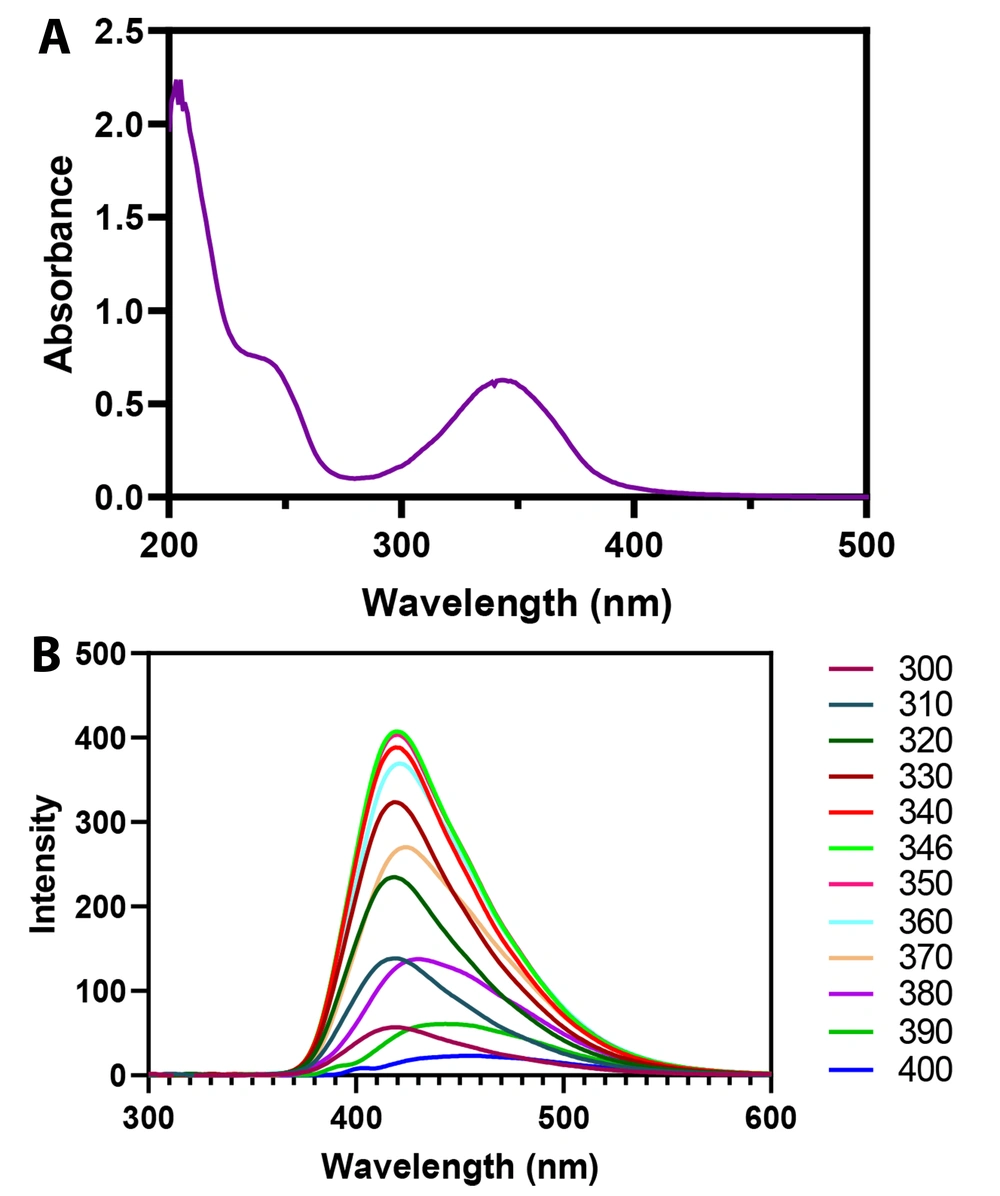
Figure 5A displays the absorption spectrum of CDs within the range of 200 - 500 nm. Two main absorption spectra were detected at 250 (sharp) and 350 (broad) nm. The spectrum at 250 nm was ascribed to the π-π* electronic transition of graphitic sp2 domains, and 350 nm was related to n-π* transitions. The n-π* electronic transition of CDs causes to emit a high quantum yield photoluminescence at 420 nm (21).
The selection of excitation wavelength is the first step in developing a spectroscopic method to detect an analyte. The correct selection of excitation wavelength has the main influence on fluorescence emission. Figure 5B illustrates the influence of excitation on the emission of CDs from 300 to 400 nm. The fluorescence emission of CDs altered upon shifting the excitation wavelength in which its intensity was increased from 300 to 346 nm and then diminished from 350 to 400 nm. As observed, the strongest fluorescence emission peak was obtained at 346 nm of excitation wavelength. Figure 6 depicts the mechanism of action of the developed nanoprobe.
3.1.3. Relation between pH and Fluorescence of CDs
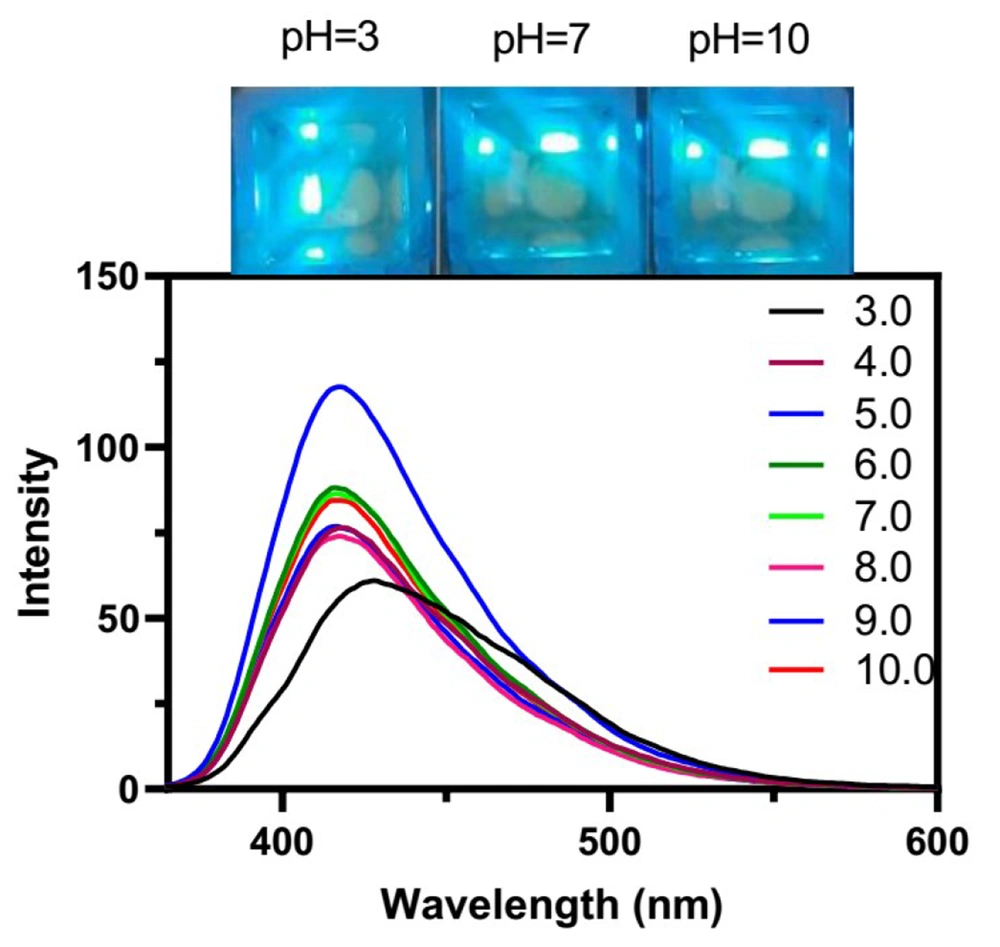
The effect of pH on the fluorescence of CDs was examined at various pH values within the range of 3 - 10. As shown in Figure 7, the fluorescence was increased from pH 3 to 5.0 and then decreased drastically up to 9. The maximum fluorescence emission was obtained at pH 5.0, which was regarded as the best pH value for monitoring MTX. In addition, it is apparent that the maximum emission wavelengths were affected by the pH value, and a blue shift occurred from pH 3 to 5; however, the fluorescence emission wavelength continued constantly for the next pH values.
3.1.4. Mechanism of Action
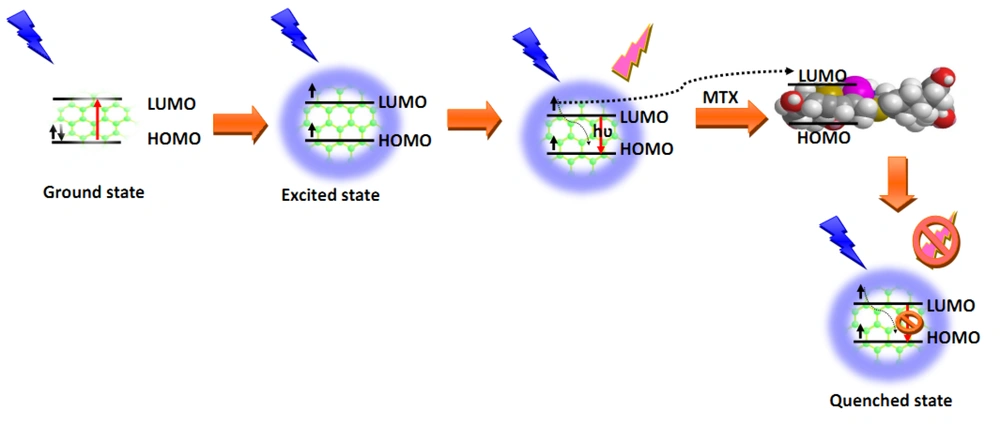
Basically, CDs quench by five mechanisms, including inner filter effect (IFE), energy transfer, static and dynamic quenching, and photoinduced electron transfer (22). In the case of the interactions between MTX and N, S, P, B-codoped CDs, the same mechanism is possible. However, based on the reported findings, IFE is proposed for quenching the CDs. The quenching is mainly produced by various functional groups available on the surface of MX and CDs. The MTX and CDs can affect each other by physical adsorption and hydrogen interactions, resulting in enhanced intermolecular charge transfer (23). Figure 8 illustrates the quenching mechanism.
3.2. Optimization
The optimum condition is the best condition which aids with high sensitivity and specificity. Various parameters can affect the performance of a platform, including buffer solution, buffer concentration, pH, incubation time, temperature, and fluorophore concentration. The pH value is one of the most important in a typical optimization. The fluorescence intensity of the produced CDs is enhanced by increasing the pH value from 2 to 5; after a sharp decrease from 5 to 6, the ∆F remained constant up to 10. In acidic pH values, functional groups are protonated, thereby weakening the bonding between MTX and functional groups of CDs. In higher pH values, the functional groups might be oxidized or inactivated. Therefore, pH 5 is selected as the best pH condition for MTX/CDs interactions (Figure 9A). Figure 9B shows the effect of phosphate buffer concentration on the ∆F, where 10 mM is the optimum concentration to regulate ionic strength to enhance the interactions between MTX and N, S, P, B-codoped CDs.
The time of incubation is adjusted to show when the N, S, P, B-codoped CDs and MTX interactions reached the maximum level. Figure 9C confirms that the optimum incubation time is 3 minutes, and the ∆F remained constant beyond 3 minutes. Although the fluorescence emission of N, S, P, B-codoped CDs is relatively high at low temperatures, the highest ∆F values were obtained at the temperature of 25°C (Figure 9D). The influence of the N, S, P, B-codoped CDs on MTX detection was investigated and reported in Figure 9E. As observed, at low concentrations of N, S, P, B-codoped CDs, the ∆F value is not satisfying, which might be due to limited interactions between N, S, P, B-codoped CDs, and MTX ions. However, ∆F was enhanced at higher concentrations and reached a maximum value of about 5 mg/mL.
3.3. Analytical Characteristics
Firstly, a calibration plot was prepared to assess the developed nanoprobe for MTX recognition. Other analytical figures of the developed method are estimated after preparing a calibration curve. For the provision of a typical calibration curve, different concentrations of MTX were spiked into the blank plasma samples and subsequently vortexed, and the proteins were precipitated with acetonitrile (ACN). Then, about 0.5 mL of the plasma samples were added to the N, S, P, B-codoped CDs at the as-optimized conditions, and then the fluorescence spectra were measured at the concentrations. In this study, the ∆F (F0 - F1) was defined as the difference in the fluorescent emission of N, S, P, B-codoped CDs in the presence and the absence of MTX upon excitation 346 nm. F0 and F1 are the maximum fluorescence emission of the N, S, P, B-codoped CDs before and after the addition of MTX.
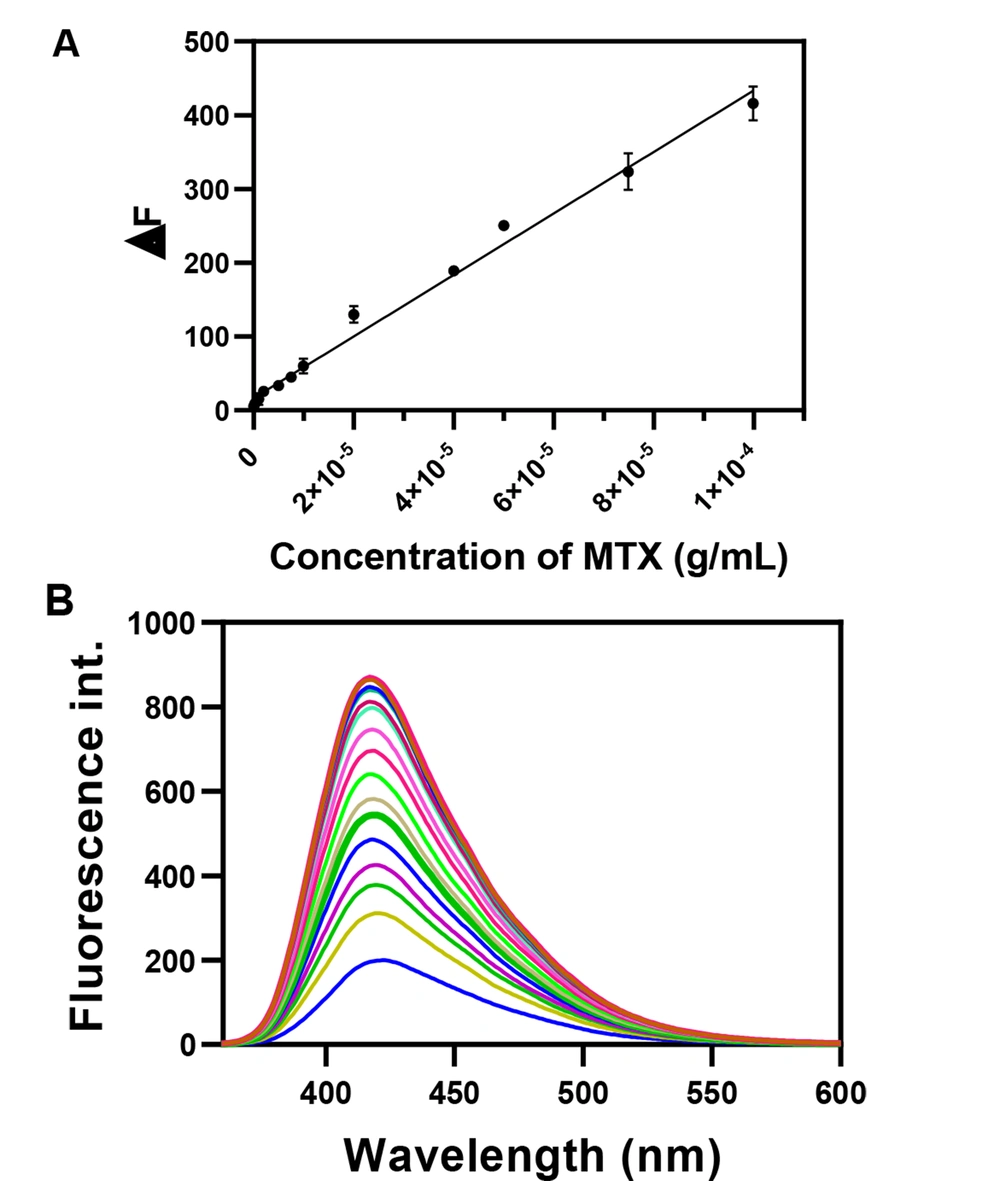
Figures 10A and B exhibited the calibration curve and typical fluorescence spectra after the addition of MTX. A linear relationship was observed between the MTX concentration and the quenched fluorescence of N, S, P, B-codoped CDs. The dynamic range of this nanoprobe was within 74.9 ng/mL to 99.9 µg/mL for plasma samples. The calibration equation in plasma could be represented by ∆F = 4.16 × 10+6 C (gr/mL) + 16.49 (P < 0.0001) with correlation coefficient of 0.999. The lower limit of detection (LOD) was 74.9 ng/mL, which can cover the MTX detection in plasma media. The limit of quantification (LOQ) and LOD of the nanoprobe in plasma were calculated as 49.9 and 163.4 ng/mL, respectively. The LOQ and LOD were estimated using the 10Sd/m and 3Sd/m. Sd and m denote the standard deviation of at least three times measuring the blank and the slope of the calibration curve, respectively. Table 2 shows the published methods for the detection of the MTX in different biological media. As observed, the developed nanoprobe provided a comparable sensitivity and specificity to those of the reported approaches. In addition, this method could detect MTX in patients’ plasma samples or spiked ones. As another feature, the developed fluorescent probe detected MTX in cell lysates which is important in pharmaceutical studies.
| Method | Matrix | Sample Type | Limit of Detection | Dynamic Range | Materials | Ref |
|---|---|---|---|---|---|---|
| Spectrophotometry | Serum | Spiked | 0.9 ng/mL | 0.0016 - 24 µg/mL | BSA-AuNCs | (24) |
| Impedance spectroscopy | Serum | Spiked | 0.165 nM | 0.276 mM - 270 µM | Cys/Glu/gold electrode | (9) |
| Electrochemical | Urine | Spiked | 9.3 nM | 0.05 - 10.0 µM | NDPC | (25) |
| Spectrophotometry | Serum | Spiked | 0.33 nM | up to 50.0 μM | N, S-CNDs | (26) |
| Spectrophotometry | Serum | Spiked | 2.5 nM | 2.5 - 150 μM | Au/AgNCs | (27) |
| HPLC | Urine | Spiked | 10 ng/mL | 12 - 160 ng/mL | CREA | (28) |
| CE-UV | Serum | Spiked | 0.1 μM | 0.5 - 7 μM | CSF | (29) |
| LC-SERS | Urine | Spiked | 2.36 μM | - | AgNPs | (30) |
| Fluorescence | Cell lysate | Spiked | 12 ng/mL | 0.4 - 41.3 μg/mL | N, S-CQDs | (23) |
| Fluorescence | Plasma | Spiked | 0.95 μM | 2.93 - 117.40 μM | N, S-CDs | (31) |
| Fluorescence | Plasma | Spiked | 0.015 μg/mL | 0.02 - 10 μg/mL | Tb-1,10-phenatroline | (8) |
| Fluorescence | Plasma | Patient | LLOQ: 22 nM | 22 nM - 4.4 μM and 4.4 μM - 110 μM | APTES-CPDs | (32) |
| Fluorescence | Plasma cell lysate | Patient spiked | 0.11 µM (49.9 ng/mL) | 0.16 µM - 220 µM (74.9 ng/mL - 99.9 µg/mL) | N, S, P, B-codoped CDs | This work |
Analytical Performance of Developed and Reported Platforms for Methotrexate Detection
3.4. Evaluation of Accuracy and Repeatability of Proposed Sensor
The accuracy and repeatability of an analytical method are the main features for the assessment of the sensing performance of a platform. The accuracy and repeatability of the N, S, P, B-codoped CD-based probe were tested by the determination of known-spiked concentrations of MTX in plasma samples. According to the Food and Drug Administration guidelines, the repeatability of an analytical approach should be checked at two systems, namely intraday and interday. The selected concentrations of analyte (MTX) should be covered at all calibration ranges, such as low, middle, and high concentrations, from the calibration curve. The obtained results showed the favorable repeatability of the developed approach for MTX detection with high accuracies. As reported in Table 3, the relative standard deviation (%) of the developed method is within the range of -0.9% to -17.7%. The calculated MTX concentrations were in good agreement with the added amount, which approves that the developed sensor is appropriate for the recognition of MTX molecules in plasma. The accuracy of the developed nanoprobe was approved with recoveries within the range of 86.34 - 99.11%.
| Nominal Concentration (g/mL) | Obtained Concentration (M) | Intraday Precision (RSD%) | Interday Precision (RSD%) | Interday Accuracy (RE%) |
|---|---|---|---|---|
| 1.0 ×10⁻⁷ | 1.90×10⁻⁷ | -17.7 | -11.3 | 86.34 |
| 1.0 ×10⁻⁶ | 2.8×10⁻⁶ | -0.9 | -14.2 | 99.11 |
| 1.0 ×10⁻⁵ | 2.12×10⁻⁵ | -3.7 | -8.1 | 96.32 |
Accuracy and Repeatability of Carbon Dots-Based Optical Sensor for Methotrexate Detection
3.5. Selectivity of N, S, P, B-Codoped CDs Nanoprobe for MTX Detection
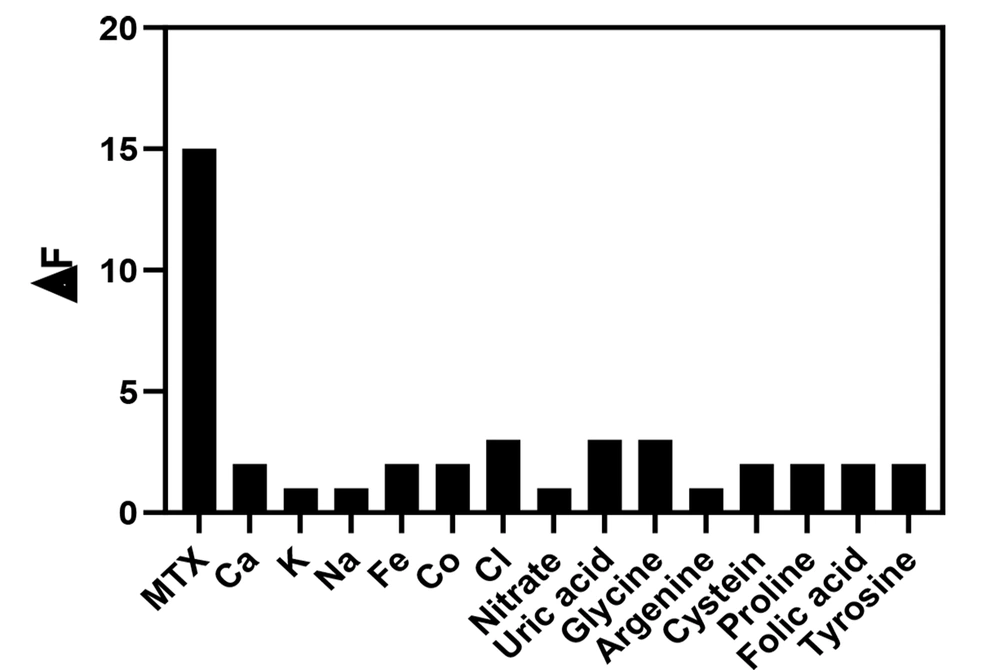
For the examination of the selectivity of N, S, P, B-codoped CDs sensing probe, the developed sensing platform was tested by monitoring MTX with some interfering agents, such as Na+, Fe2+, Ca2+, Co2+, K+, chloride, and nitrate and uric acid, cysteine, glycine, proline, and tyrosine. However, coprescribed folic acid was also checked due to its similar molecular structures. The fluorescence intensity of N, S, P, B-codoped CDs was recorded at the MTX and interfering agent concentrations of 0.5 and 0.1 µg/mL, respectively. It is noteworthy that the optimized conditions were applied for both systems (in the presence and absence of MTX).
Figure 11 displays the effect of the agents on the fluorescence emission of the probe, which is lower than 5.0%. The findings propose that the developed nanoprobe for the specific detection of MTX in the presence of the interfering agents. As observed, the developed approach is durable toward various amino acids available in plasma samples, making the probe for the determination of MTX in plasma samples. The high specificity of the probe is caused by various functional groups available on the surface of CDs, enabling various interactions between MTX and CDs.
Selectivity of N, S, P, B-codoped carbon dots for methotrexate (MTX) detection; probe ∆F (F0 - F1) in MTX presence with 0.5 and 1 µg/mL of other interfering agents (conditions as reported in Figure 8)
3.6. Application of N, S, P, B-Codoped CD Sensor for MTX Detection in Real Samples
For the indication of the potential application of the N, S, P, B-codoped CDs, the probe was utilized to detect MTX in the plasma samples. Firstly, the plasma samples were collected from patients. Then, the blood cells were separated by centrifuging, and then ACN was added to separate plasma proteins. After the separation of proteins, about 0.5 mL of plasma samples were mixed with buffer and CDs; finally, MTX contents were determined by the developed approach. The MTX concentration in patients’ plasma samples was calculated through the standard addition method, and the results are listed in Table 4.
| Sample ID | Gender | Prescribed Dosage (g/m2) | Obtained Concentration (M) |
|---|---|---|---|
| 1 | Female | 6 | 9.20 × 10⁻⁴ |
| 2 | Male | 0.4 | 6.34 × 10⁻⁷ |
| 3 | Male | 1.5 | 1.01 × 10⁻⁵ |
| 4 | Female | 1.8 | 6.12 × 10⁻⁴ |
| 5 | Male | 1.9 | 3.27 × 10⁻⁴ |
| 6 | Male | 2.5 | 5.11 × 10⁻⁴ |
Detected Value of Methotrexate in Patient Samples through the N, S, P, B-Codoped Carbon Dots Sensor Method
3.6.1. Detection of MTX in Cell Lysate
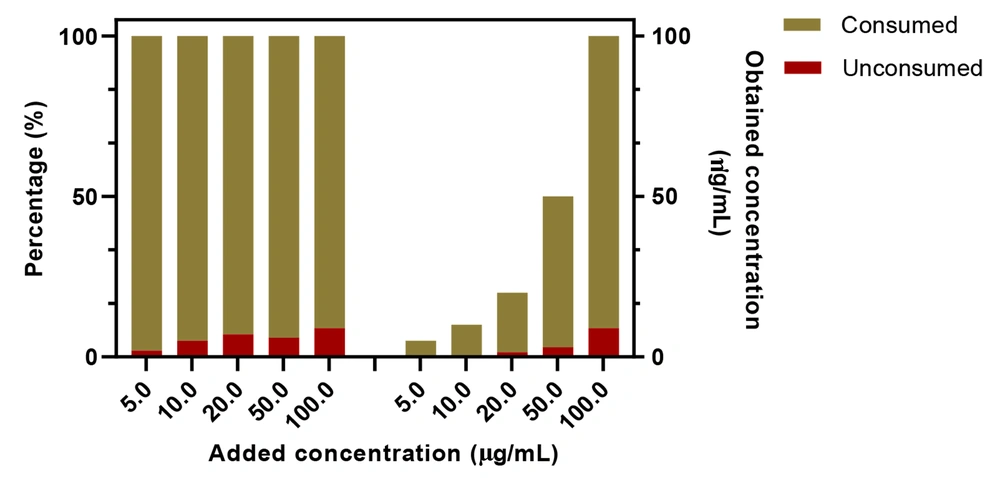
The use of the developed nanoprobe was investigated in cell lysates. Briefly, the MCF-7 cells were incubated with different concentrations of MTX for 5 hours; then, the unconsumed MTX molecules were measured by the developed nanoprobe. Figure 12 shows the obtained concentration of MTX in cell lysates. As expected, the amount of unconsumed MTX molecules in lower MTX concentrations is negligible; however, in higher concentrations, more unconsumed MTX molecules are available in media. Generally, about 91% of the added MTX was consumed by the cells, showing an effective in vitro uptake value of the cancer cells.
Determination of methotrexate in cell lysate using N, S, P, B-codoped carbon dots-based nanoprobe (conditions as reported in Figure 8)
3.7. Bioimaging of Cancer Cells
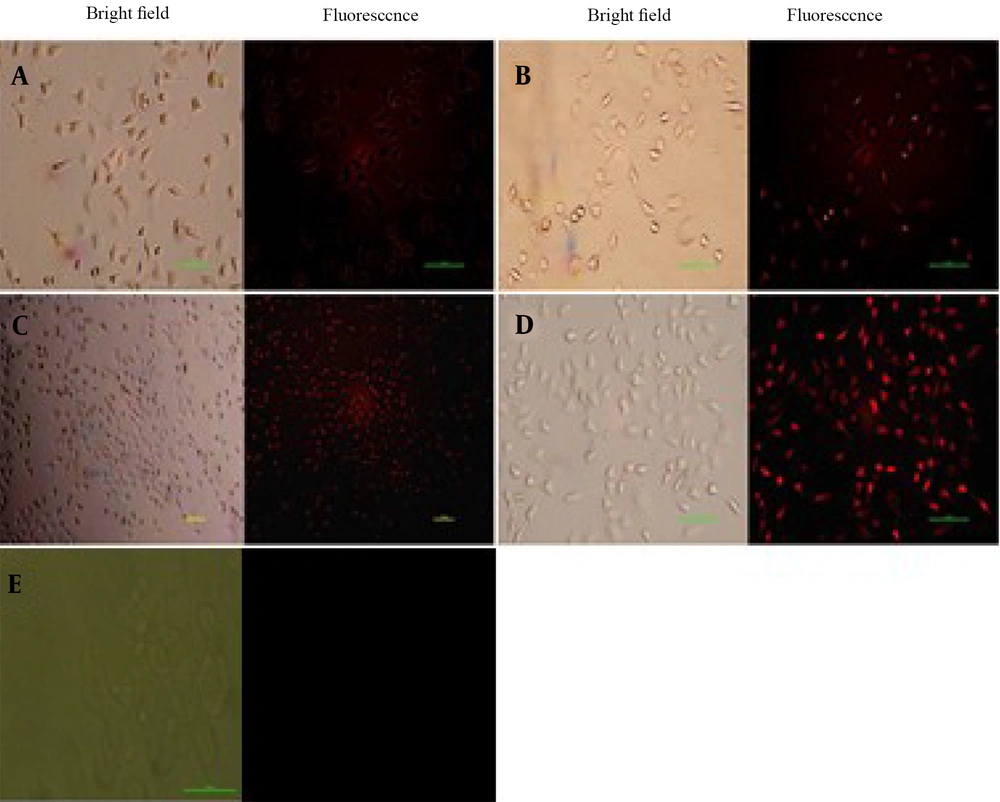
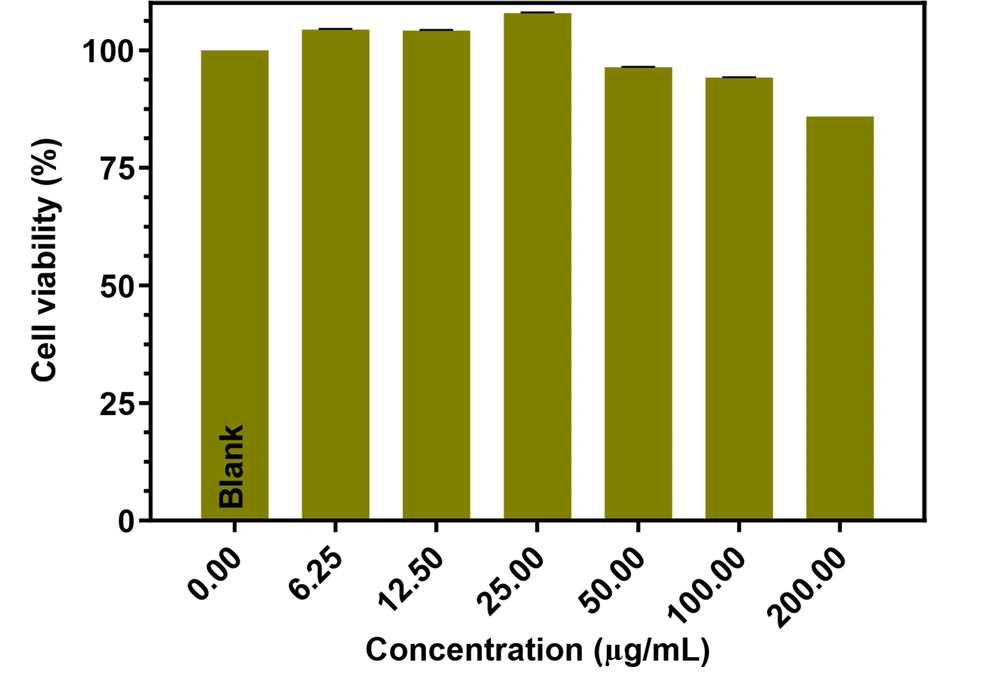
N, S, P, B-codoped CDs could also be applied as bioimaging agents in cancer cells. As shown in Figure 13, the N, S, P, B-codoped CDs adhered to the MCF-7 cells’ membrane. As expected, by passing the time, the uptake value was increased and reached a maximum level after about 12 hours of incubation. The biocompatibility of the N, S, P, B-codoped CDs was measured by the MTT assay. Figure 14 depicts the results. As observed in Figure 14, the viability of MCF-7 cancer cells was higher than ~85%, even at high concentrations of N, S, P, B-codoped CDs. Therefore, the N, S, P, B-codoped CDs could be proposed as biocompatible materials for use in sensor designing in biological media and as bioimaging agents for cancer cells.
4. Conclusions
In summary, a new probe was designed and reported to the detection of MTX concentration using N, S, P, B-codoped CDs. This nanoprobe can detect MTX in the plasma samples of the patients and cell lysates with high accuracy and sensitivity. The dynamic range and LOD of the developed probe are 74.9 ng/mL to 99.9 µg/mL and 49.9 ng/mL, respectively. The interfering effect of various agents showed that the coexistence of agents in plasma media does not have any significant influence on the final signal of the developed probe; therefore, this sensor could be utilized for the TDM of MTX in the plasma matrix. The as-prepared nanoparticles are highly stable for some days, and there is no need for any severe conditions for long-time storing. Furthermore, N, S, P, B-codoped CDs have biocompatible nature and can be used as bioimaging agents for imaging MCF-7 breast cancer cells.

![Effects of pH (A), buffer concentration (B), time (C), temperature (D), and concentration of carbon dots (E) ([methotrexate] = 2.5 µg/mL) Effects of pH (A), buffer concentration (B), time (C), temperature (D), and concentration of carbon dots (E) ([methotrexate] = 2.5 µg/mL)](https://services.brieflands.com/cdn/serve/3170b/efe0575629b9d8feb06e663ea8179da5ce78073e/ijpr-126918-i006-F9-preview.webp)
