1. Background
The alkaloids from Papaver somniferum L. are an integral part of medicines and illegal drugs such as heroin (diacetyl derivative of morphine) (1). It is necessary to accurately determine opium alkaloids and their derivatives in various samples, especially from natural sources. The complex matrices of plants require the use of separation procedures and analytical methods such as thin-layer chromatography (TLC), capillary electrophoresis (CE), high-performance liquid chromatography (HPLC), electrochemical, chemiluminescence, ultraviolet (UV), photodiode array (DAD), or fluorescence methods, gas chromatography (GC), gas chromatography-mass spectrometry (GC–MS), HPLC coupled with MS (HPLC-MS), CE-MS, two-dimensional liquid chromatography (2D LC), ion mobility spectrometry (IMS), and other techniques (2-9).
Ion mobility spectrometry is a reliable option for quantifying opium alkaloids and illicit drugs (10-14). In particular, it offers greater sensitivity and faster separation than HPLC and does not require analyte derivatization or pretreatment (15). The principles of IMS are similar to those of time-of-flight mass spectrometry (TOF-MS), with the difference that it operates at ambient pressure. Portability, high speed, low cost, ease of maintenance and operation, high sensitivity, selectivity, and low detection limits (~ ppb) have actuated scientists to IMS.
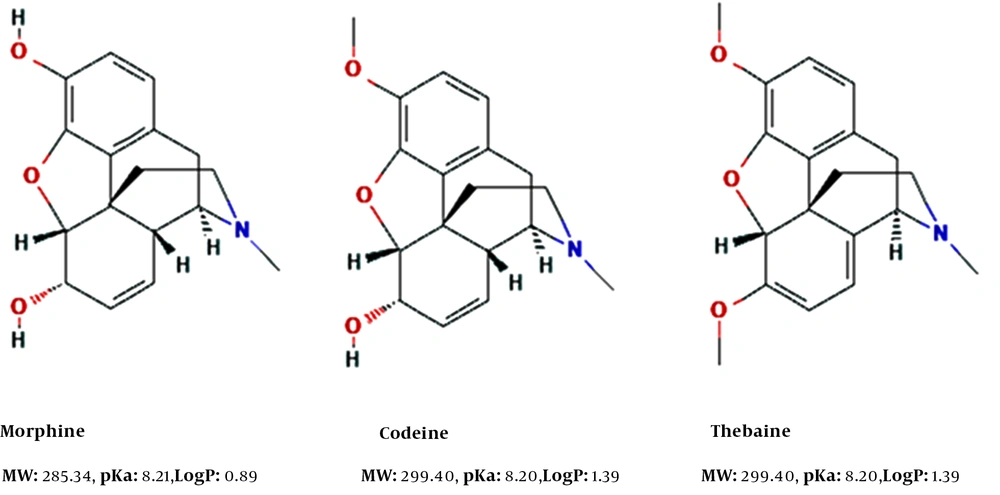
Opium alkaloids, such as codeine, thebaine, and morphine (Figure 1), are extracted and purified from Papaver somniferum using a series of alkaline, acidic, and solvent extractions. The methylation of morphine can produce codeine. However, alkaloids must be monitored at numerous stages of this process to optimize the extraction yield. The samples usually have high ionic strengths with numerous structurally related opiates, owing to the P. somniferum biosynthetic pathway and the extraction process. Opium alkaloids have been determined previously by HPLC-UV (16, 17).
2. Objectives
The present study aimed to develop a rapid and straightforward method for the simultaneous determination of morphine, codeine, and thebaine in Papaver species without any additional pre-separation methods (e.g., LC, HPLC, and CE) using IMS. In this method, compounds were extracted from the plants and then analyzed by IMS and HPLC. The obtained results of the two methods at the optimum condition were compared. The results confirmed the capability of IMS for the analysis of morphine, codeine, and thebaine simultaneously (18-20).
3. Methods
3.1. Chemicals and Reagents
Reference standards of codeine, morphine, and thebaine sulfate salts (99%) were purchased from Sigma-Aldrich (Sigma-Aldrich, Zwijndrecht, Netherlands). The solvents, including dimethylformamide (DMF), HPLC-grade methanol, and acetic acid, were purchased from Merck (Merck, Darmstadt, Germany). Individual stock solutions of codeine, morphine, and thebaine at 1 mg/mL were prepared in methanol. All stock solutions were kept at 2°C.
3.2. Plant Samples
Six species of Papaver and two populations of Papaver bracteatum Lindl. were collected from different areas. Their scientific names were confirmed at the herbarium of Medicinal Plants Institute, ACECR. The shade drying was applied to the collected plants, and then different parts of the dried plants were separated and coded. The characteristics of the collected species are shown in Table 1.
| No. | Herbarium Code | Scientific Names | Area | Geocoding | Height (m) |
|---|---|---|---|---|---|
| 1 | 17165-IMPH | P. bracteatum Lindl. | Mazandaran Province | N: 35º 52´ 00"; E: 52º 03´ 31" | 2455 |
| 2 | 17036-IMPH | P. tenuifolium Boiss. & Hohen | Semnen Province | N: 35º 48´ 40"; E: 53º 15´ 25" | 1700 |
| 3 | 17030-IMPH | P. somniferum L. | Kohkilooyeh Province | N: 30º 48´ 42"; E: 50º 34´ 15" | 815 |
| 4 | 17171-IMPH | P. bracteatum Lindl. | Mazandaran Province | N: 36º 22´ 57"; E: 50º 56´ 43" | 2950 |
| 5 | 17170-IMPH | P. pseudo-orientale Medw. | Ardabil Province | N: 38º 15´ 02"; E: 48º 18´ 18" | 1950 |
| 6 | 17166-IMPH | P. orientale L. | Zanjan Province | N: 37º 22´ 16"; E: 48º 17´ 44" | 1300 |
| 7 | 17164-IMPH | P. fugax Poir. | West Azerbaijan Province | N: 36º 05´ 53"; E: 45º 33´ 30" | 2100 |
Information on Papaver Species
3.3. Ion Mobility Spectrometry
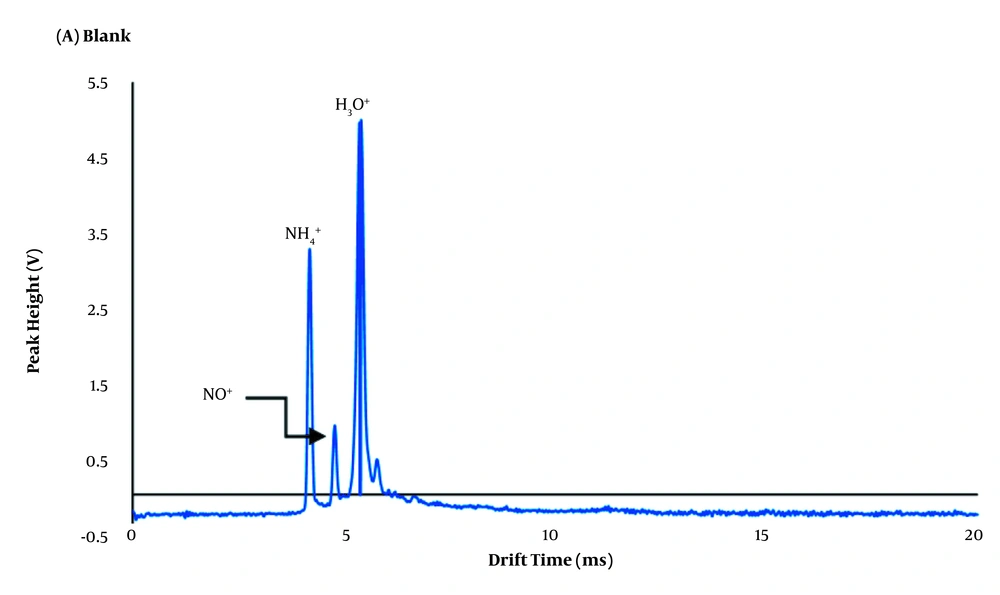
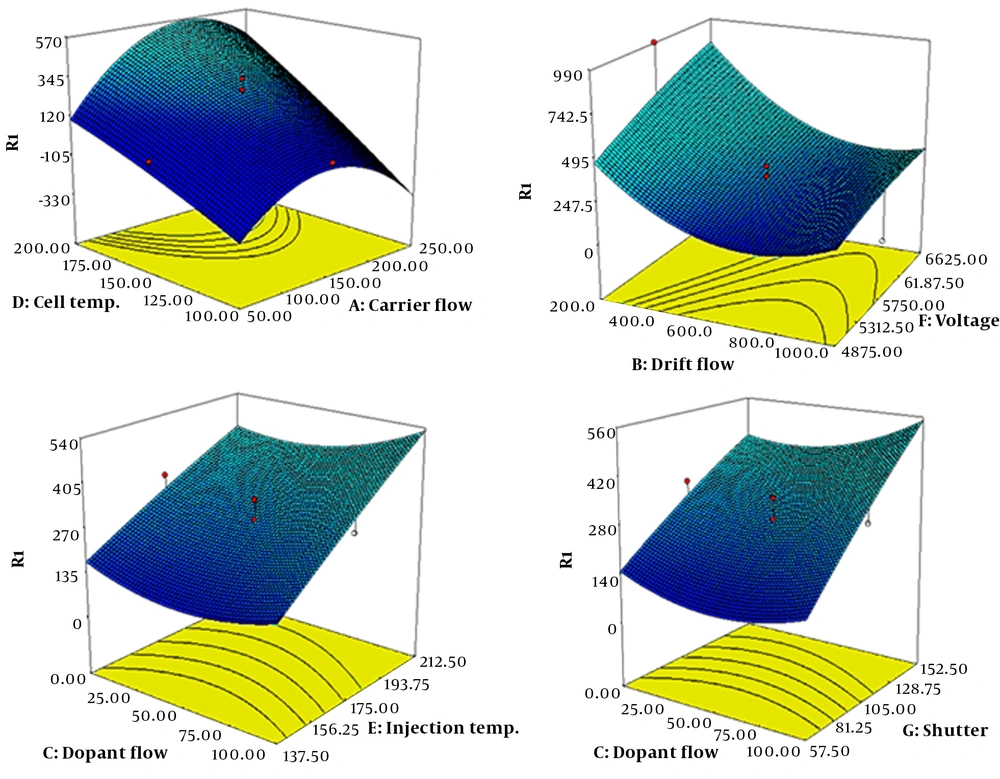
The IMS apparatus used in this study was made at the Isfahan University of Technology, as described previously (21), in which the corona discharge ionization source is used for ionization. Essential parts of an IMS cell device include a corona discharge needle, two voltage power suppliers, an electrical network pulse, a detector, a D/A conversion card, and a computer. Without any analytes, three peaks appear. The first, second, and third peaks are related to drift gas (NH4+), air (NO+), and moisture of the air (H3O+), respectively (Figure 2). All instrumental parameters such as carrier, dopant and drift flow, injection and cell temperature, shutter, and voltage were optimized simultaneously using the experimental design method. Optimal values were selected based on the best ion mobility spectra, higher signal intensities for lower concentrations, and better resolution and detection limits. Drift (A) and injection region temperature (B), dopant flow (C), drift flow (D), carrier flow (E), pulse width (F), and voltage (G) were set to maximize the experimental response (normalized peak height). With seven-factor and three-center points, 81 experiments had to be run for the orthogonal Central Composite Design (CCD) (Table 2).
| Alkaloids | Calibration Curve Parameters | Figure of Merits Parameter | |||||||||
|---|---|---|---|---|---|---|---|---|---|---|---|
| LDR (mg L-1) | Calibration Equation | R2 | LOD (mg L-1) | LOQ (mg L-1) | % RSD (n = 3) | %Recovery | |||||
| Intra-assay | Inter-assay | ||||||||||
| 1 (mg/L) | 10 (mg/L) | 1 (mg/L) | 10 (mg/L) | 0.1 (mg/kg) | 1 (mg/kg) | ||||||
| Morphine | 0.5 - 25.0 | y = 80.656 x - 22.755 | 0.990 | 0.2 | 0.5 | 3.3 | 6.2 | 4.6 | 7.1 | 85.6 | 80.1 |
| Codeine | 0.5 - 10.0 | y = 140.86 x + 93.938 | 0.999 | 0.2 | 0.5 | 14.0 | 6.3 | 14.5 | 6.8 | 79.4 | 79.0 |
| Thebaine | 0.2 - 25.0 | y = 164.76 x + 162.24 | 0.993 | 0.05 | 0.2 | 9.4 | 9.5 | 9.8 | 10.1 | 88.2 | 89.3 |
Validated Parameters of Proposed Ion Mobility Spectrometry Method
3.4. High-Performance Liquid Chromatography Condition
An HPLC system (Knauer, Germany) was equipped with a Knauer-UV K2501 detector, an Eclipse –XBD-C18 column (25 cm × 4.6 mm × 5 µm), and a Knauer-K1001 pump. The isocratic mobile phase consisted of Methanol-Water-Ammonia 25% (500 – 500 – 1.75) at a 0.8 mL/min flow rate. The UV detection wavelength was 298 nm, and the injection volume was 20 μL. Both the column oven temperature and the autosampler temperature were 30°C.
3.5. Extraction Procedure
First, 5 mL of 25% ammonia solution, 25 mL of methanol, and 75 mL of chloroform were added to 1 g of the dried powdered plants in a flask. The flask was placed in the ultrasonic bath for 10 min and then in a dark place for half an hour. The mixture was filtered, and the liquid extract's solvents were removed entirely by a rotary evaporator. To dissolve all the sediments, we added 25 mL of chloroform and 10 mL of 1 N sulfuric acid (an ultrasonic bath could be used for a short time). This solution was transferred to a decanter. After creating two separate phases, the chloroform phase (lower phase) was removed from the decanter, and the aqueous phase (upper phase) was kept. Ammonia was used to adjust the pH of the aqueous phase between 10 and 11. The extraction was performed with 25 mL of chloroform. The aqueous phase (upper phase) was extracted twice again with 10 mL of chloroform, and all chloroform phases were collected. Sodium sulfate anhydride was added to the collected chloroform solution. Then, it was filtered through filter paper, and chloroform was eradicated again with the rotary evaporator (22). The prepared extract was dissolved in methanol-water-ammonia 25% (500 – 500 – 1.75) with a ratio of 1: 5 and injected into the HPLC and IMS.
4. Results and Discussion
4.1. Optimization of Ion Mobility Spectrometry
Different instrumental factors affect the ion mobility of the analytes and the quality and quantity of the obtained results. To achieve the best conditions, the effective parameters for the separation and measurement of compounds were first studied and optimized simultaneously by an ion mobility spectrometer with the CCD method. For this purpose, the effects of voltage, carrier, drift and dopant gas flow, injection and drift region temperature, and pulse width at five levels were investigated on the signals (Appendix 1).
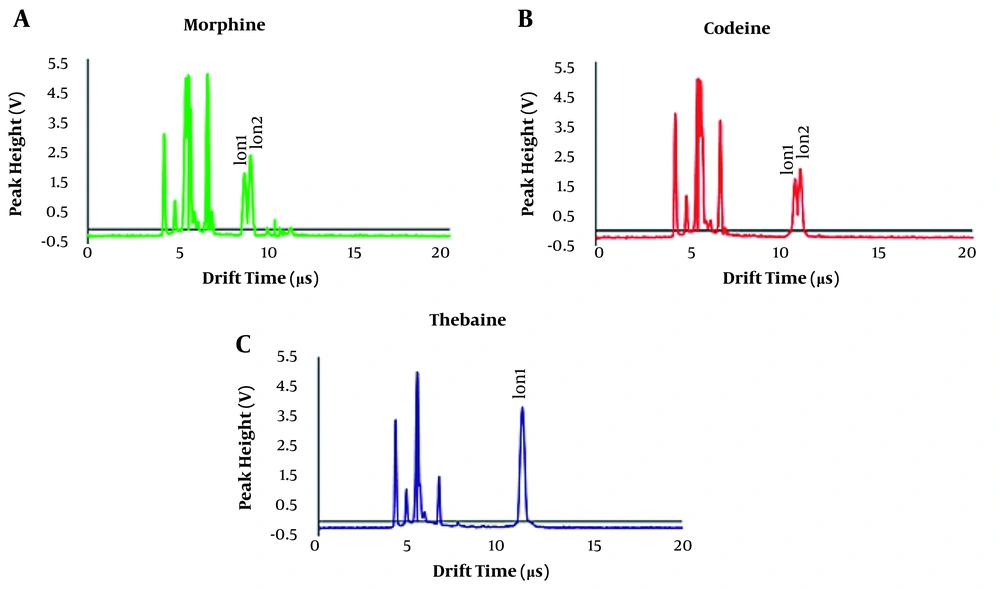
The three-dimensional response surface diagrams and the results of the optimized condition are shown in Figure 3 and Appendix 2, respectively. As shown in Figure 2, at a drift field of 700 V/cm and dopant gas flow of 70 mL/min, the maximum intensity and minimum matrix effect and noises were observed. The response intensity increased with increasing drift tube and injection temperatures. But, at temperatures above 200ºC and 250ºC for the drift tube and injection region, respectively, the noises and fragmentation of the target molecules increased, so 200ºC and 250ºC were chosen as the optimum temperatures. Also, as the pulse width increased, the response increased, and the resolution decreased, so the proper response and the maximum resolution were obtained at the shutter grid f 80 µs. In the optimum condition, two ions of morphine at the drift times of 8.8 and 9.4 ms, two ions of codeine at 10.7 and 10.9 ms, and one peak for thebaine at 11.3 ms were obtained (Figure 4). Due to the minimum overlap and maximum intensity, the first peak of morphine and codeine compounds was used to validate the method.
4.2. Method Validation
The method was validated in terms of linearity, repeatability (precision, RSD%), recovery, limit of detection (LOD), and limit of quantification (LOQ). Validation requirements were derived from the USP guideline on the validation of compendial procedures (23). Linearity was evaluated for each opium alkaloid in the range of 0.01 - 500 mg/L in the liquid extract. The method was considered linear when the correlation coefficient of the regression line was higher than 0.99. The recovery was determined by spiking samples from opium alkaloids at 0.1 and 1 mg/kg of each opium alkaloid (six replicates).
The RSD was determined from the recovery experiments of six replicates. The LOQ was defined as the lowest concentration of the spiked opium alkaloid tested that fulfilled all validation requirements in the validation study. Table 2 shows that the linear dynamic range was about two orders of magnitude for three compounds. The detection limits were 0.2, 0.2, and 0.05 mg/L for morphine, codeine, and thebaine, respectively. The analytical parameters of the corona discharge IMS method for determining morphine, codeine, and thebaine are given in Table 2. The detection limits and dynamic range of the proposed method were compared with those of other analytical methods in the literature (Table 3), showing that the HPLC-UV method (16) has the lowest detection limit of 0.02 - 0.06 mg/mL for morphine, codeine, and thebaine; however, the method is costly, and these results were obtained in a simple water sample. In addition, morphine must be derivatized with pentafluoro-1-propanol to make it suitable for measurements. A few methods have lower detection (24), but the proposed method presents lower detection limits than several other methods (25-27).
| Analyte | Analysis Method | Linear Range (mg/L) | LOQ (mg/L) | % RSD | Sample | Ref. |
|---|---|---|---|---|---|---|
| Morphine, codeine | HPLC-UV | 0.05 - 0.75 | 0.05 | 1.5 - 9 | Plasma | (24) |
| Morphine, codeine, thebaine | HPLC-UV | - | 0.02 - 0.06 | 0.8 - 3.3 | Water | (16) |
| Morphine, codeine | HPLC-UV | 5 - 100 | 5 | - | Water | (25) |
| Morphine, codeine, oripavine, thebaine | Capillary electrophoresis | 3.0 - 300 | 3.0 | 0.6 - 1.5 | Process liquors | (26) |
| Morphine, codeine, thebaine, noscapine, papaverine, narceine | LC-MS/MS | 0.1 - 5 | 0.1 - 20.0 | 4 - 20 | Poppy seeds | (27) |
| Morphine, codeine, thebaine | LLE-IMS | 0.2 - 25 | 0.2 - 0.5 | 3.3 - 14.0 | Herbal extract | Proposed method |
Comparison of the Proposed Method with Other Reported Methods
4.3. Analysis of Real Samples
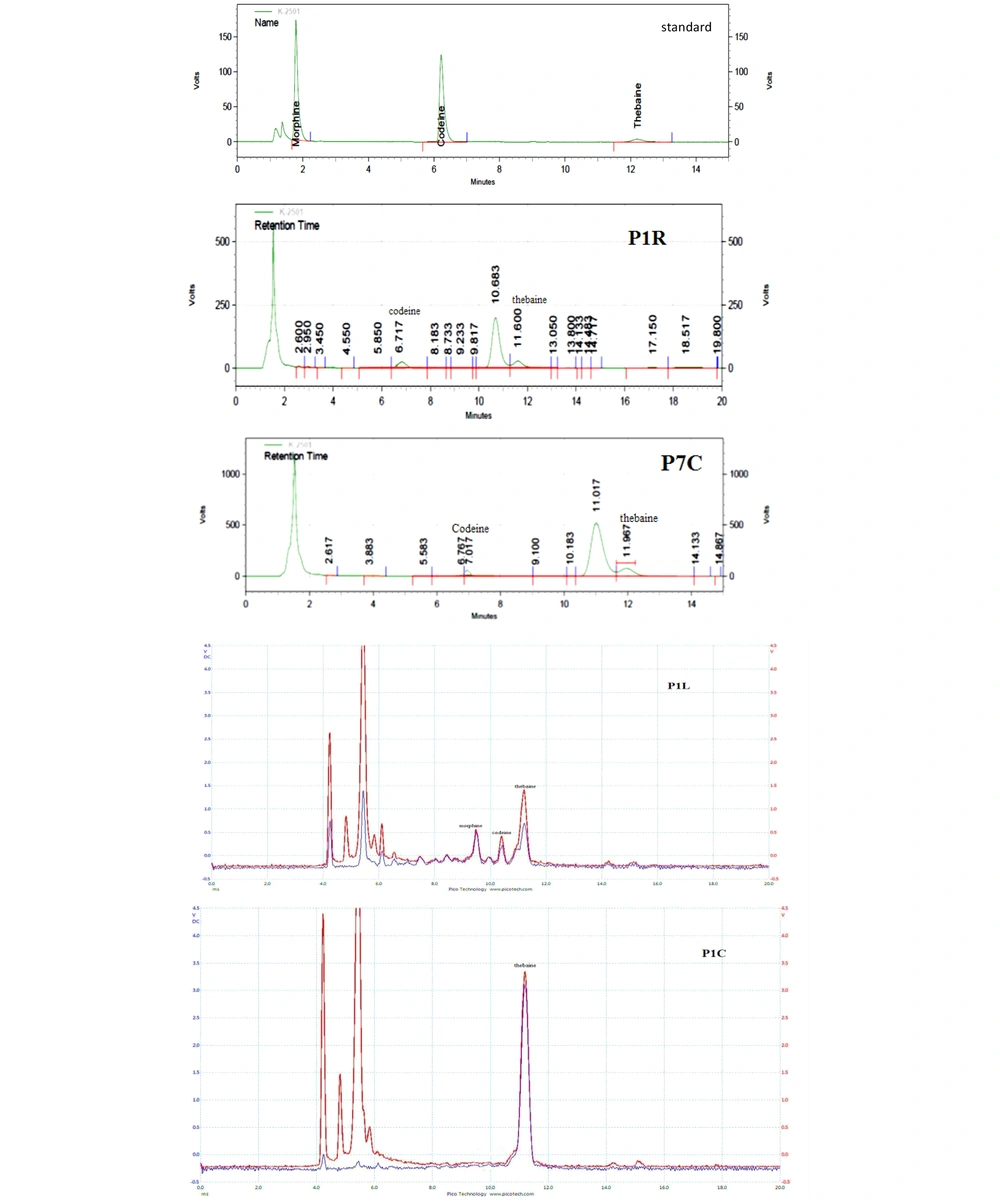
The alkaloids of six species of Papaver were extracted by the method described in the extraction procedure section. The obtained extracts were analyzed by HPLC and validated by the IMS method (Figure 5). The obtained results from the two methods were comparable. The results (Table 4) show that the P. bracteatum sample collected from the height of 2,455 meters in Mazandaran province had the highest amount of thebaine in all parts of the plant, including roots, stems, leaves, and capsules. Also, thebaine was detected in the stems and roots of all collected species, except for P. pseudo-orientale and P. orientale. Morphine was one of the compounds with the lowest quantity in all parts of the samples, detected only by the validated IMS method.
| Herbarium Code | Sample Code | IMS Results | HPLC Results | ||||
|---|---|---|---|---|---|---|---|
| Thebaine (mg/L) | Morphine (mg/L) | Codeine (mg/L) | Thebaine (mg/L) | Morphine (mg/L) | Codeine (mg/L) | ||
| 17165-IMPH | P1C a | 380.3 | - | - | 363.41 | - | - |
| 17036-IMPH | P2C | 15.0 | 18.8 | - | 22.03 | - | 94.07 |
| 17030-IMPH | P3C | 9.8 | - | - | 10.70 | - | - |
| 17171-IMPH | P4C | 39.9 | - | 46.7 | 23.62 | - | 51.17 |
| 17170-IMPH | P5C | 10.2 | - | 547.7 | 7.63 | - | 604.32 |
| 17166-IMPH | P6C | - | - | - | - | - | 1192.19 |
| 17164-IMPH | P7C | 21.3 | - | 55.4 | 17.67 | - | 75.78 |
| 17165-IMPH | P1B b | 30.5 | - | 16.2 | 40.04 | - | 13.18 |
| 17036-IMPH | P2B | 40.7 | - | 22.4 | 2.73 | - | 32.85 |
| 17030-IMPH | P3B | 9.0 | - | 58.2 | 6.08 | - | 48.23 |
| 17171-IMPH | P4B | 22.77 | - | 10.5 | 20.80 | - | 11.76 |
| 17170-IMPH | P5B | - | - | Overlapping | - | - | 554.90 |
| 17166-IMPH | P6B | 5.7 | - | Overlapping | 3.80 | - | 246.10 |
| 17164-IMPH | P7B | 20.3 | - | 178.6 | 29.62 | - | 157.54 |
| 17165-IMPH | P1L c | 120.5 | 30.9 | 35.7 | 107.89 | - | 15.71 |
| 17036-IMPH | P2L | 46.5 | 27.7 | 70.5 | 4.45 | - | 59.67 |
| 17030-IMPH | P3L | 13.5 | 64.24 | 57.14 | 10.45 | - | 53.70 |
| 17171-IMPH | P4L | 158.4 | 9.09 | - | 112.69 | - | - |
| 17170-IMPH | P5L | 10.2 | - | 634.4 | - | - | 675.98 |
| 17166-IMPH | P6L | 2.5 | - | 18.9 | 1.76 | - | 17.48 |
| 17164-IMPH | P7L | 5.0 | - | Overlapping | 6.07 | - | 37.14 |
| 17165-IMPH | P1R d | 300.5 | - | 32.5 | 366.33 | - | 22.40 |
| 17036-IMPH | P2R | - | - | 70.2 | - | - | 98.08 |
| 17030-IMPH | P3R | - | - | 18.3 | - | - | - |
| 17171-IMPH | P4R | 207.2 | - | 32.7 | 255.00 | - | 26.26 |
| 17170-IMPH | P5R | - | - | - | - | - | - |
| 17166-IMPH | P6R | 4.1 | - | 513.0 | - | - | 551.60 |
| 17164-IMPH | P7R | 20.8 | - | 634.7 | 26.58 | - | 712.32 |
Obtained Results from Collected Samples Using Ion Mobility Spectrometry and High-performance Liquid Chromatography
The HPLC and IMS showed that the amount of codeine had more abundant in the roots, stems, and leaves than in the capsule of all plants. Thebaine was observed in P5L and P6R samples, and codeine was observed in P7L and P3R samples by IMS but not detected by HPLC. The codeine in P5B, P6B, and P7L samples was quantified by HPLC accurately. However, quantifying by IMS was impossible due to the high matrix effect and overlapping analyte peaks in these samples.
Also, the obtained results showed that the analysis time in IMS was much less than in HPLC. It should be noted that the average analysis time for each injection is about 20 ms for IMS and 14 min for HPLC. In other words, in each analysis with HPLC simultaneously, a hundred samples can be analyzed by IMS. Also, IMS is an inexpensive method compared to HPLC or LC, which consume high-purity solvents as the mobile phase. Also, IMS does not suffer from problems such as column contamination, which is usual in HPLC.
4.4. Conclusions
This study showed that ion mobility spectrometry is a suitable and rapid technique for quantitative and qualitative analysis of alkaloids in complex herbal matrices. High sensitivity, short analysis time, and no need for vacuum and expensive gas or solvents are the main advantages of this technique over other analysis techniques. Also, HPLC detected morphine in none of the prepared samples, while IMS showed morphine in the capsules and leaves of four species. This result confirms the sensitivity of the IMS method compared to HPLC. Also, the obtained results in this study showed advantages such as simplicity, short-time analysis, and ease of working with IMS compared to liquid chromatography.

