1. Background
Nuclear magnetic resonance (NMR) spectroscopy has been used to elucidate the properties of small molecules up to proteins, as well as to investigate associations between drugs and their targets, ligands, and membrane assemblies, to name a few. NMR spectroscopy has been growingly used for quantitative and qualitative assessment of pharmaceutical products over the last decades (1).
NMR was first used in 1963 (2, 3) to assess substance purity and drug quantity. Since then, it has emerged as a precise quantitative tool. Despite its lower sensitivity compared to high performance liquid chromatography (HPLC) and mass spectrometry (4), the quantitative NMR (qNMR) approach has distinct advantages over them: (1) various calibration options with no need for identical reference materials; (2) access to both qualitative and quantitative data simultaneously; (3) analysis of multicomponent mixtures without pre-isolation; (4) minimal and simple sample preparation; (5) comparatively short analysis time; (6) non-destructive in nature; and (7) no need for intensity calibrations in the case of assessing the ratios.
The availability of 1 well resolved and integrable resonance in the spectrum is the only necessity for qNMR. Any available pure compound that is soluble in the same solvent and has at least 1 NMR signal isolated from the analyte can be used as an internal standard. In contrast to chromatographic techniques, qNMR reduces the time spent on sample preparation, and it also does not require preparing large volumes of buffered mobile phases with expensive solvents, conditioning analytical columns, developing analytical methods, and repeating blanks/standard injections. Therefore, it provides a high cost and time benefit while maintaining high efficiency.
Despite the fact that NMR is a powerful analytical tool, it has been underutilized for drug determination. This is mostly due to the high expense of requiring a superconducting magnet, as well as the related operational costs. However, new advancements in benchtop NMR spectrometers with cryogen-free permanent field homogeneous magnets have made this technique more appealing and accessible, as they are cost-efficient, need quite little maintenance, and do not need a lot of skill to be operated. Because of the above-mentioned factors, benchtop NMR can be used in a variety of applications where high-field NMR is constrained by cost or practical restrictions.
Despite the advantages, there are several drawbacks to tabletop instruments. For example, spectrometers operating below 80 MHz of 1H resonance frequencies lose analytical performance. In addition to the loss of sensitivity at low fields, the reduced spectral resolution results in overcrowded spectra with frequent signal overlaps, particularly in multicomponent mixtures.
Peak overlap is typical in 1HNMR, even in high field instruments. This is intensified at benchtop systems due to lower field strengths, particularly for multicomponent samples, where multiple resonances overlap, resulting in broad baselines.
Phenobarbital (PhB) and phenytoin (PhT) were developed as the first generation of antiepileptic drugs (AEDs) in 1911 and 1938, respectively (5, 6). Despite the introduction of subsequent generations of AEDs, first-generation drugs continue to play an important role in the clinic and are still widely in use.
As per the literature search, some analytical methods are available to quantify PhB and PhT in bulk drug forms, pharmaceutical formulations (7-9), and biological fluids (10-12), but almost all the methods are based on lengthy chromatographic techniques. No pharmacopoeial or validated non-pharmacopoeial method exists to assay these drugs in combined dosage forms.
2. Objectives
To the best of our knowledge, no qNMR method for PhB, PhT, or their combination has been reported. Since the combined dosage form of these drugs, which is available on the market, contains large quantities of them, the poor sensitivity of benchtop devices would probably not be an issue. Therefore, we used it as an example to assess the suitability of benchtop devices for the quantification of multicomponent dosage forms. The other aim of this work was to overcome the signal overlap in the NMR spectrum that is a challenge for simultaneous measurement of these 2 drugs and development of an advantageous NMR method for the determination of these active ingredients in formulations and API samples on a benchtop NMR, complying well with the validation requirements as per International Conference on Harmonization (ICH) guidelines.
3. Methods
3.1. Materials
High purity PhB and PhT were given by Loghman Pharmaceutical Ltd, Tehran, Iran. PhT compound tablet formulation containing 100 mg PhT and 50 mg PhB, manufactured by Loghman Pharmaceutical Company, Iran, was purchased from the local market. Method development was carried out using picric acid (PA) as an internal standard in DMSO-d6 (99.8%, Mesbah Energy). PA was procured from Sigma Aldrich. Methanol (HPLC grade), potassium phosphate monobasic, and sodium acetate trihydrate were purchased from Merck.
3.2. Instrumentation
1H NMR (1H-Nuclear Magnetic Resonance) experiments were carried out at 60.15 MHz proton resonance frequency by Nanalysis NMReady 60 PRO benchtop NMR. Temperature is set at 32ºC automatically by the spectrometer. The acquisition parameters optimized for qNMR were recorded in Table 1. Before the Fourier transform, a 0.5 Hz line broadening was applied to free induction decay (FIDs). All chemical shifts were automatically referenced by the spectrometer and reported in ppm. MestReNova software version 14 was used to manually adjust the 1H NMR spectra phase and correct baseline distortions. Each calculation was done 3 times.
HPLC analysis was performed using a Merck Hitachi LaChrom 7000 Series system with a UV detector. The column was LiChrospher RP-18 (250 mm, 4.6 mm; 5 µm particles, Merck KGaA, Darmstadt, Germany).
| Parameters | Values |
|---|---|
| Spectral width (ppm) | 14 |
| Spectral center (ppm) | 7 |
| Number of points | 8192 |
| Number of scans | 128 |
| Dummy scans | 2 |
| Inter-scan delay (s) | 20 |
| Acquisition time (active scan time) (s) | 10.3 |
| Pulse width | 14.6 |
All solid substances were weighed using analytical balance Sartorius CP225D (Germany). All liquid volumes were handled using Transferpette (Brand, Wertheim, Germany).
3.3. Sample Preparation
3.3.1. Preparation of Standard Solutions
Ten synthetic mixtures with PhB and PhT amounts of 20 - 30 and 50 - 60 mg, respectively, were built (Table 2). A central composite design (CCD) with 5 points for each compound was used to minimize the impact of unpredictable variables. CCD was used to achieve an orthogonal, rotatable model.
| Row | Picric Acid | Phenytoin | Phenobarbital | ||||||||
|---|---|---|---|---|---|---|---|---|---|---|---|
| Taken (mg) | Taken (mg) | NMR | HPLC | Taken (mg) | NMR | HPLC | |||||
| Recovery (%) | RSD (%) | Recovery (%) | RSD (%) | Recovery (%) | RSD (%) | Recovery (%) | RSD (%) | ||||
| 1 | 49.94 | 59.69 | 98.54 | 2.40 | 98.26 | 1.07 | 24.92 | 98.23 | 0.80 | 99.11 | 0.42 |
| 2 | 49.71 | 50.47 | 103.46 | 0.29 | 99.16 | 0.20 | 30.98 | 98.67 | 1.73 | 100.95 | 0.05 |
| 3 | 50.07 | 49.80 | 98.75 | 1.04 | 100.34 | 0.47 | 24.90 | 98.54 | 0.83 | 99.71 | 0.19 |
| 4 | 50.16 | 57.18 | 97.89 | 1.47 | 98.83 | 0.02 | 28.71 | 96.70 | 0.23 | 98.69 | 0.52 |
| 5 | 49.62 | 40.18 | 102.64 | 1.81 | 98.61 | 0.48 | 24.96 | 100.99 | 2.23 | 98.63 | 0.24 |
| 6 | 50.11 | 43.04 | 104.03 | 1.35 | 100.85 | 0.27 | 21.89 | 99.21 | 0.92 | 98.24 | 0.15 |
| 7 | 49.73 | 43.27 | 104.75 | 0.67 | 99.39 | 0.25 | 28.22 | 98.59 | 1.60 | 98.34 | 0.55 |
| 8 | 49.91 | 57.53 | 99.24 | 2.26 | 101.01 | 0.14 | 21.51 | 98.63 | 1.75 | 100.87 | 0.16 |
| 9 | 50.30 | 49.58 | 102.56 | 0.30 | 100.89 | 0.07 | 25.07 | 102.26 | 0.97 | 99.01 | 0.28 |
| 10 | 50.27 | 50.28 | 103.87 | 0.91 | 99.48 | 0.23 | 19.79 | 101.99 | 0.70 | 98.77 | 0.22 |
| Mean | 101.57 | 1.25 | 99.68 | 0.32 | Mean | 99.38 | 1.18 | 99.23 | 0.28 | ||
Standard solutions were obtained by weighing the required amounts of drugs and about 50 mg of PA. Weighed substances were transferred into a stoppered tube, and then 0.6 mL of DMSO-d6 was added to fully dissolve the materials with the aid of ultrasound. The transparent liquid was loaded into a 5-mm NMR tube and assigned for the spectrum acquisition. Each concentration solution was made 3 times.
3.3.2. Tablet Powder Solution Preparation for qNMR
Ten commercial PhT compound tablets were weighed and powdered in a mortar. Then, proper tablet powder (equivalent to 50 mg PhT and 25 mg PhB) and 50 mg of PA were accurately weighed and transferred to a stoppered tube. Next, 0.6 mL of DMSO-d6 was added using a calibrated micropipette. The solution was thoroughly mixed and ultrasonicated, and the supernatant was taken for analysis after 15-minute centrifugation at 14000 rpm.
3.4. Relaxation Time
Since relaxation time has a significant impact on qNMR, its duration was determined using the longitudinal relaxation time (T1) of all signals between acquisitions, which was calculated using the following formula:
Mz and M0 indicate the magnetizations along the z-dimension as a function of repetition time (τ). T1 denotes the proton’s longitudinal relaxation time and is obtained using the inversion recovery technique (13). The inversion-recovery pulse sequence is given below:
d1 → p1 (180°) → d2 → p2 (90°) → FID
The nuclei are allowed to relax to equilibrium initially in this experiment (d1). The signals are then inverted using a 180° pulse (p1). After that, the signals are allowed to relax for a different amount of time (d2) in each experiment step. FID is obtained once variable d2 is given, and a 90° pulse (p2) is applied. The spectrum is recorded by FID as a function of variable delay d2, and the peak intensity will represent the relaxation degree.
3.5. Calculations
The basic principle of qNMR, as stated in the literature (14), is that NMR signal intensity (I) has a direct relation with the number of protons (n), as shown by the following equation:
Ks is unknown, but it is a constant for all resonance in the same 1H NMR spectrum. Although different signals contain different numbers of nuclei, their relationship can be described by the following equation:
For purity determination of a substance, based on Equation 3, the component purity can be calculated from the NMR intensity via Equations 4 with a known standard that was added gravimetrically (15):
where mx and px correspond to the mass and purity of the analyte, Mx and Mstd are the molar masses of the analyte and the standard, Is and Istd represent the integrated signal area of the analyte and the standard, Nx and Nstd are the number of protons in the integrated signal area of the analyte and the standard, mx and mstd define the mass of the analyte and the standard, and Pstd is the assay of standard, respectively.
3.6. Method Validation
Parameters such as specificity, accuracy, precision, range, linearity, limit of detection (LOD), limit of quantification (LOQ), and stability were used to validate the method. All these parameters were undertaken according to ICH guidelines Q2 (R1) (16).
4. Results and Discussion
4.1. Determination of Relaxation Time
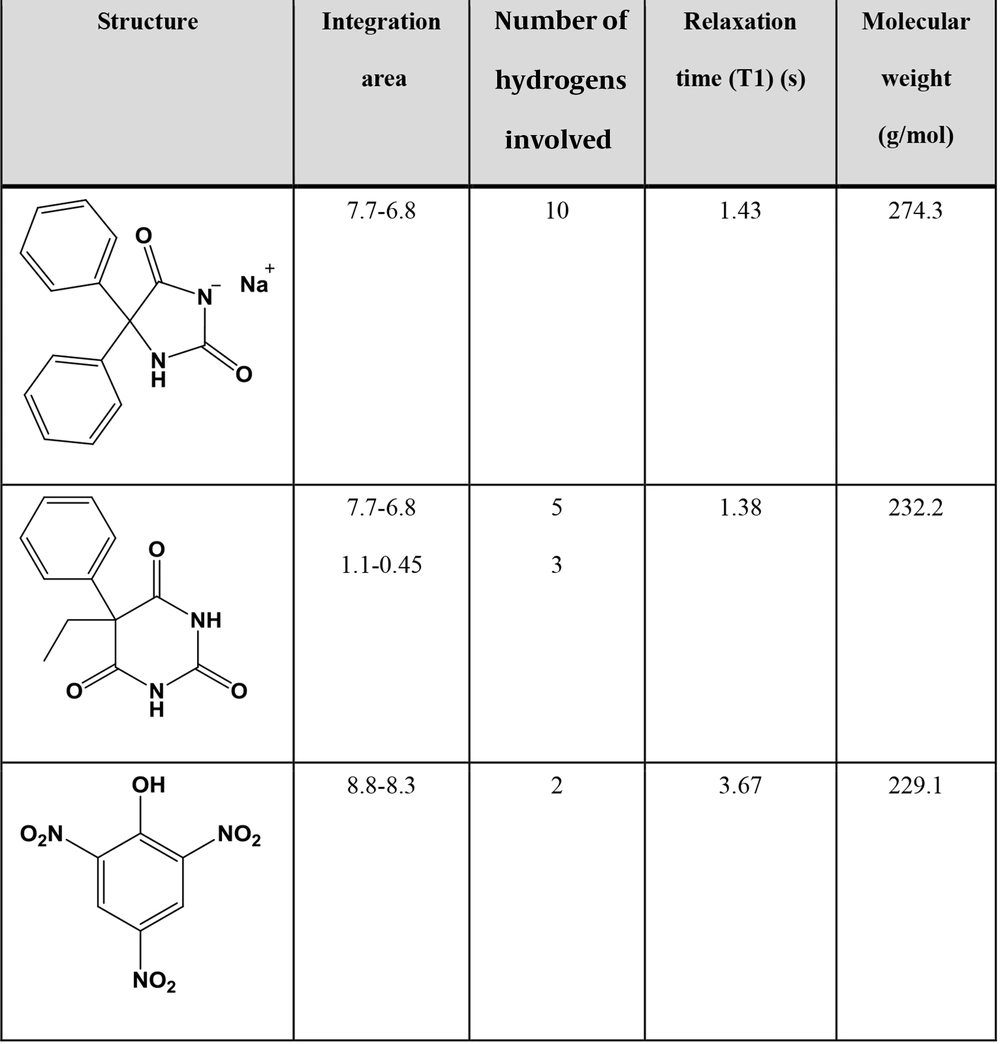
T1 was obtained in DMSO-d6 for PhT, PhB, and PA using the inversion recovery technique (Figure 1) (13). PA had the longest relaxation time of 3.67 seconds. Therefore, 7 × longest T1 and intervals between pulses were considered to ensure the relaxation of more than 99.9% of protons. Since the time between pulses equals recycle delay (D1) plus acquisition time (AQ) and, with adjusted parameters, AQ equals 10 seconds, setting D1 to 20 seconds seems adequate.
4.2. qNMR Methods
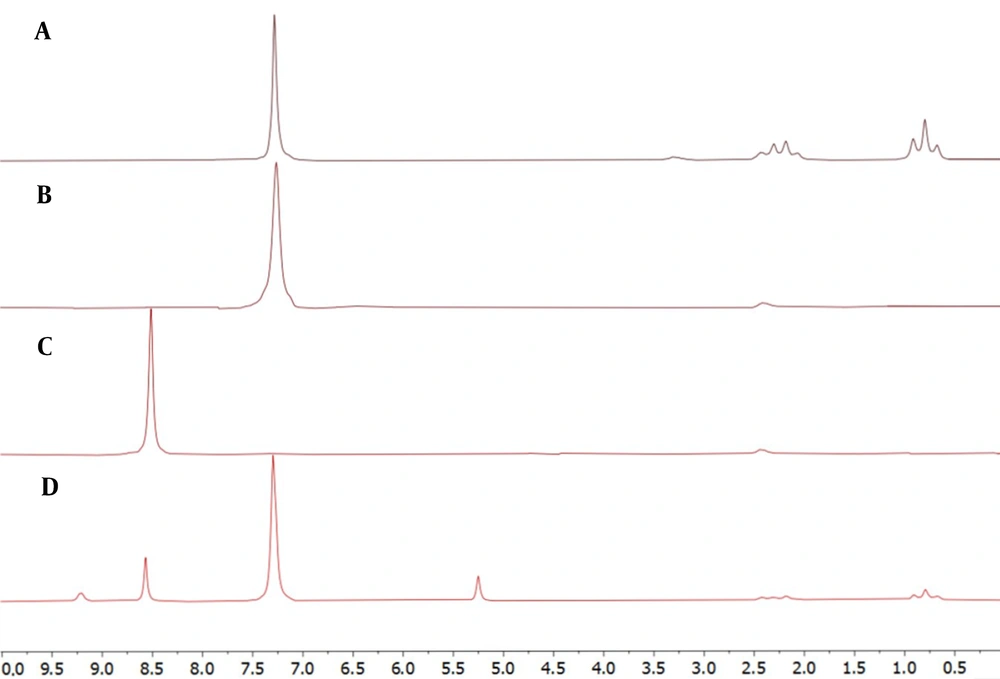
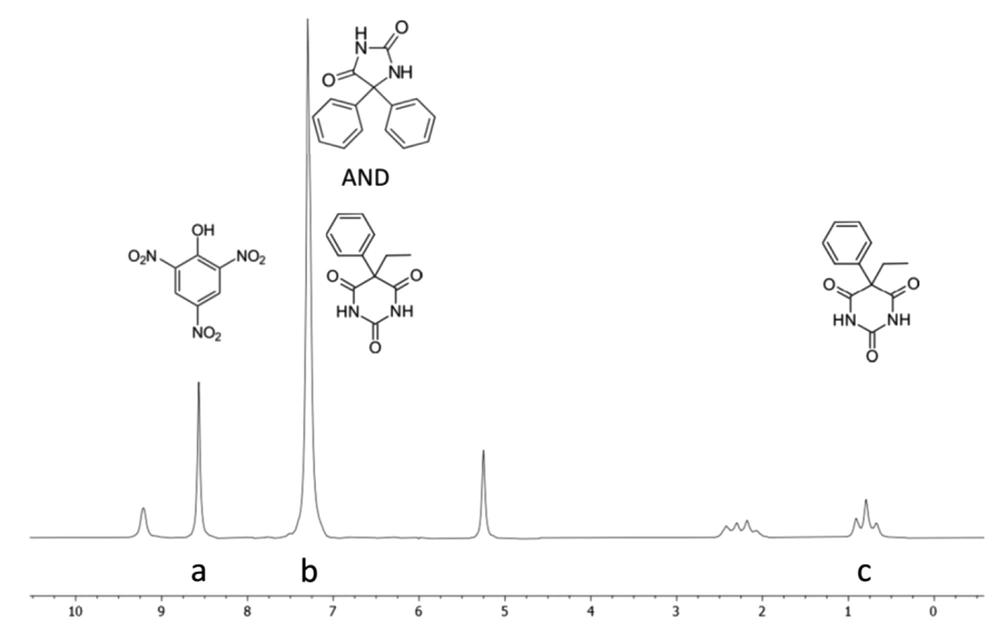
DMSO-d6 was used as the solvent in the NMR experiments because of its good solubility for PhT, PhB, and PA. PA was used as the internal standard because its NMR signals do not overlap with those of analytes in the 1H NMR spectrum. The NMR spectra of analytes, internal standard, their mixture, and PhT compound tablet in DMSO-d6 are shown in Figure 2. As shown in Figure 3, the signal at δ 7.30 ppm assigned to the phenyl groups of PhB (5H, s) and PhT (10H, s), which completely overlap, and the signal at δ 0.79 ppm (3H, t), belonging to the methyl group of PhB, which do not overlap with any other signals, were selected as the analytical signal for quantitative purposes. The 1H NMR spectrum of PA exhibited the characteristic signal of 2 aromatic protons at δ 8.57 ppm (2H, s, H-3, H-5; Figure 3, signal A). This well-resolved aromatic signal is suitable for quantification. From these data, 3 signals at δ 0.79, 7.30, and 8.57 ppm were used to quantify the PhB and PhT mixture through qNMR. The PhB methyl signal was used to quantify it (Figure 3, signal C). However, there is an overlap problem for the PhT measurement, and no well-separated signal is obtained. PhT produces only 1 non-exchangeable hydrogen signal, which is located in the aromatic region and overlaps with the PhB signal (Figure 3, signal B). Therefore, considering the 3 to 5 ratio of hydrogens of the methyl group to the hydrogens of the phenyl group of PhB and determining the share of PhB from the integral of the aromatic region signal, the share of PhT could be calculated and used to calculate its amount. The following equations have been used:
Where mPhB = weight of PhB, mPhT = weight of PhT, mPA = weight of PA, IPhB = integral value of the signal at δ 0.79 ppm, IPhT = integral value defined in Equation 7, IPA = integral value of the signal at δ 8.57 ppm, IAr = integral value of the signal at δ 7.30 ppm, NPhB = number of protons in the integrated signal of PhB (3.0), NPhT = number of protons in the integrated signal of PhT (10.0), NPA = number of protons in the integrated signal of PA (2.0), MPhB = molar mass of PhB (232.2 g/mol), MPhT = molar mass of PhT (274.3 g/mol), and MPA = molar mass of PA (229.1 g/mol).
4.3. Validation of the qNMR Method
4.3.1. Specificity and Selectivity
Inspection of potential interference as a result of the presence of components in the sample solution was done to assess the specificity and selectivity.
The specificity study was performed by analyzing DMSO-d6, internal standard solution, drug standard solutions, and sample solution. 1H NMR spectra of each solution are presented in Figure 2. The only interference was related to PhT and PhB in the aromatic region (7 - 7.5 ppm), which is addressed in section 3.2.
4.3.2. Linearity
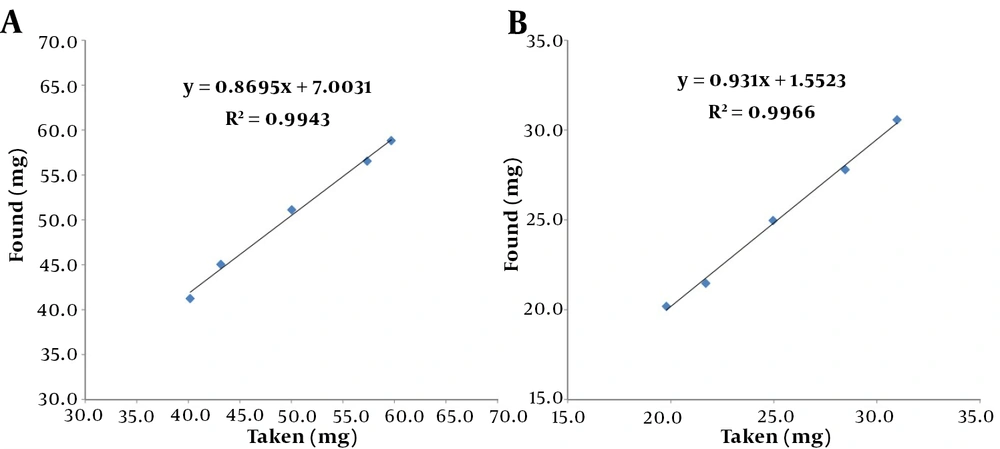
According to Equation 2, the amplitude of the response signal in NMR is directly proportional to the number of nuclei; thus, qNMR is assumed linear in theory. Linearity analyses were carried out using standard solutions of PhB and PhT ranging from 20 to 30 mg per 0.6 mL DMSO-d6 and 40 to 60 mg per 0.6 mL DMSO-d6, respectively. To establish a calibration curve, taken values were plotted on the x-axis, and observed values were plotted on the y-axis (Figure 4). The equations had r2 coefficients of 0.9966 and 0.9943 for PhB and PhT, respectively. This means that the regression was significant. The curve equation was y = 0.931x + 1.5523 for PhB and y = 0.8695x + 7.0031 for PhT.
4.3.3. Accuracy
The accuracy of an analytical procedure expresses the closeness of agreement between the theoretical and experimental values. According to ICH Q2 (R1), the accuracy of a process can be determined by comparing the results of the proposed analytical technique to those of a second well-characterized procedure. As a result, the method was compared to the United States Pharmacopoeia (USP) assay method to ensure that it was accurate. The mean recovery and relative standard deviation (RSD) of the developed procedure and reference method for both analytes are given in Table 2. A comparison of these factors shows acceptable accuracy for the NMR method.
4.3.4. Precision
The precision of an analytical procedure indicates the closeness of agreement between independent measurements acquired by multiple sampling of the same homogenous sample and being evaluated by RSD. Precision tests were performed using 6 repeated determinations, and intermediate precision was measured by different analysts and/or devices on different days. Samples were prepared by taking about 25 mg PhB and 50 mg PhT. The detailed records of each sample preparation and statistical results are shown in Table 3. The maximum RSD was found to be 2.09%.
| Taken (mg) | Assay (mg) | Recovery (%) | ||||
|---|---|---|---|---|---|---|
| PhT | PhB | PA | PhT | PhB | PhT | PhB |
| Precision | ||||||
| 50.22 | 24.57 | 50.14 | 51.11 | 24.52 | 101.77 | 99.80 |
| 50.27 | 24.94 | 49.69 | 50.63 | 25.18 | 100.71 | 100.95 |
| 50.75 | 25.10 | 50.32 | 51.51 | 24.98 | 101.49 | 99.52 |
| 49.73 | 25.02 | 49.88 | 48.97 | 25.57 | 98.48 | 102.21 |
| 50.30 | 24.66 | 49.81 | 49.62 | 24.59 | 98.65 | 99.71 |
| 49.98 | 25.28 | 50.47 | 51.06 | 25.84 | 102.16 | 102.21 |
| Mean ± SD | 100.54 ± 1.61 | 100.73 ± 1.25 | ||||
| RSD% | 1.94 | 2.09 | ||||
| Intermediate Precision | ||||||
| Taken (mg) | Assay (mg) | Recovery (%) | ||||
| PhT | PhB | PA | PhT | PhB | PhT | PhB |
| 50.25 | 25.08 | 50.42 | 49.18 | 24.80 | 97.88 | 98.89 |
| 49.53 | 25.17 | 50.19 | 49.13 | 24.96 | 99.19 | 99.16 |
| 49.44 | 24.98 | 50.31 | 50.52 | 24.64 | 102.18 | 98.65 |
| 50.01 | 24.76 | 50.00 | 50.56 | 24.14 | 101.11 | 97.50 |
| 50.49 | 24.64 | 50.58 | 51.27 | 25.04 | 101.55 | 101.64 |
| 50.16 | 24.83 | 50 | 49.27 | 24.72 | 98.23 | 99.56 |
| Mean ± SD | 100.02 ± 1.83 | 99.23 ± 1.37 | ||||
| RSD% | 1.83 | 1.84 | ||||
According to USP general chapter bracket <761>, validation criteria for NMR is the RSD of not more than (NMT) 1.0% for precision and intermediate precision for drug substances and NMT 2.0% and 3.0% for precision and intermediate precision of finished pharmaceutical products, respectively. Therefore, the precision and intermediate precision of this method are within or close to the acceptable range for final drug products, and no systematic errors were observed.
4.3.5. Range
The range of an analytical procedure is the interval between the upper and lower concentrations (amounts) of the analyte in the sample, for which it has been demonstrated that the analytical procedure has a suitable level of precision, accuracy, and linearity. ICH Q2 (R1) guidelines for the assay of a drug substance or a finished (drug) product specified that a minimum range from 12% to 80% of the test concentration should be considered. The developed method covers the specified range (20 - 30 mg for PhB and 40 - 60 mg for PhT) and has good figures of merit (Tables 3 and 4 and Figure 3).
4.3.6. Limits of Detection and Quantification
The signal-to-noise ratio cannot determine LOD and LOQ; the reason is that NMR signals are Lorentzian lines. Thus, LOQ and LOD were investigated according to the standard deviation of the response (δ) and the slope (S) of the calibration curves using Equations 9 respectively:
LOD and LOQ were found to be 5.313 and 16.1 mg for PhT and 4.125 and 12.5 mg for PhB, respectively.
4.3.7. Stability
The stability test revealed whether there was an important change in the initial sample after being kept for a certain time. Method’s stability was assessed by the percentage difference (which should be less than 2.0%) and RSD (which should be no more than 3.0%). The sample was tested at room temperature after 0, 3, 6, 12, and 24 hours. The observations are shown in Table 4. The results illustrated that the test solutions were adequately stable.
| Time | Assay (mg) | Recovery (%) | Difference (%) | |||
|---|---|---|---|---|---|---|
| PhT | PhB | PhT | PhB | PhT | PhB | |
| Initial | 50.82 | 25.48 | 101.81 | 101.63 | n/a | n/a |
| 3 h | 50.99 | 25.11 | 102.16 | 100.14 | 0.35 | -1.49 |
| 6 h | 50.65 | 25.90 | 101.49 | 103.33 | -0.32 | 1.70 |
| 12 h | 49.76 | 25.43 | 99.96 | 101.43 | -1.85 | -0.20 |
| 24 h | 50.96 | 25.47 | 102.10 | 101.58 | 0.29 | -0.05 |
| RSD% | 1.01 | 1.29 | ||||
4.4. Comparison with HPLC Method
The results acquired by qNMR were verified by comparing them with those obtained from an HPLC-based method. The chromatographic analysis was performed according to USP 41 monographs for PhB and PhT. All the 10 standard samples were properly diluted and analyzed by the HPLC method (Table 2). The findings of the HPLC approach are shown in Table 2, which do not vary significantly from those of the qNMR method.
4.5. Assay of Tablets
The tablets were assayed after extraction using the method described in the experimental section and compared to the USP assay method. As data showed (Table 5), the qNMR result was in good agreement with HPLC and labeled content.
Goicoechea and Olivieri and Boeris et al. (7, 8) reported 2 investigations on the simultaneous determination of these medications in dosage forms. UV spectroscopy and chemometric approaches were used in these studies. Because there is no need to establish a chemometric model or a calibration curve in our suggested technique, it is simpler and faster than both previously developed methods. Our technique outperforms both previous studies in terms of accuracy and precision. None of these studies reported intermediate precision or stability.
5. Conclusions
In the present study, a qNMR method has been developed using PA as an internal standard and DMSO-d6 as the NMR solvent to determine PhT and PhB in bulk and combined dosage forms, which was validated according to ICH guidelines. It has been shown that the benchtop NMR spectrometer can be used to determine PhT and PhB in bulk and combined dosage forms with comparable accuracy to the HPLC method, which is the standard for this type of analysis. Minimum sample pre-treatment, simple instrument use, and short analysis times make this an appealing tool compared to other approaches.
-thumbnail.webp)


