Materials And Methods
Design, Production, and Characterization of rTRAIL protein
TRAIL gene (Ensemble: ENSG00000121858) was amplified from human TRAIL cDNA. XhoI and Notl restrictions sites had been added at the 5’end of the forward and reverse primers, respectively, and their sequences were as follows: 5`ATGCCTCGAGA TAGAGAAGGAAGGGCTTCAGTG`3 and 5`ATGCGCGGCCGC TGCGATCTTTTAGTGGTGCCT `3.
Primer was designed and analyzed with software (Primer-BLAST, NCBI). The amplification of the human TRAIL gene was performed using DNA Polymerases (F530S Phusion High-Fidelity DNA Polymerases, Thermo Scientific) with PCR (T100 Thermal Cycler, Biorad). pET28a, his tagged bacterial expression plasmid (EMD Biosciences, USA), was digested with XhoI and Notl (R0146S and R0189S, New England Biolabs). Then TRAIL gene was ligated to pET28a and named pET28a.TRAIL. The pET28a.TRAIL expression plasmid was also transformed into Escherichia Coli (E. coli) BL21 (DE3). E. coli was cultured in LB with Kanamycin (Santa Cruz, USA) at 100 µg/mL, and recombinant protein expression was induced with 1 mM isopropyl β-d-1-thiogalactopyranoside (IPTG, Sigma). Recombinant TRAIL protein (rTRAIL) was purified on Ni-NTA affinity beads (Santa Cruz). Protein was controlled with 15% SDS-PAGE gels and staining Coomassie brilliant blue. Commercial TRAIL protein (Sigma T9701) was used as a positive control to TRAIL purification.
Synthesis of silver nanoparticles
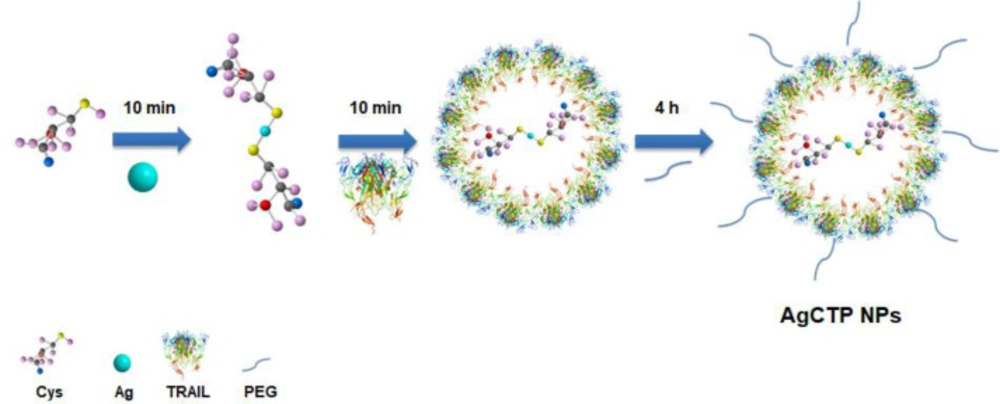
After the magnetic stirrer was adjusted to 37 °C, 100 mL of met-NaOH (0.02 M, 99%) solution and 1 mL of cysteine solution (0.1 M) were added in a 250 mL beaker. pH was adjusted to 9 by 1M HCl and 2N NaOH, and then 1 mL of AgNO3 (0.1 M) solution was added dropwise to this mixture. One-hundred μL TRAIL (20 μg/mL) and 100 μL PEG400 were respectively added in the same way after every 10 min and stirred for 4 h. The mixture was centrifuged for 5 min at 4000 rpm (Hettich 320R, Germany). To remove impurities, the pellet was separately washed 3 times with methanol and dH2O. The powder form of nanoparticles obtained by lyophilization and was kept at 4 °C for further studies. AgC (Silver-cysteine), AgCT (Silver-cysteine-TRAIL) and AgCTP (Silver-cysteine-TRAIL-PEG) NPs were synthesized by the same procedure.
Characterization of silver nanoparticles
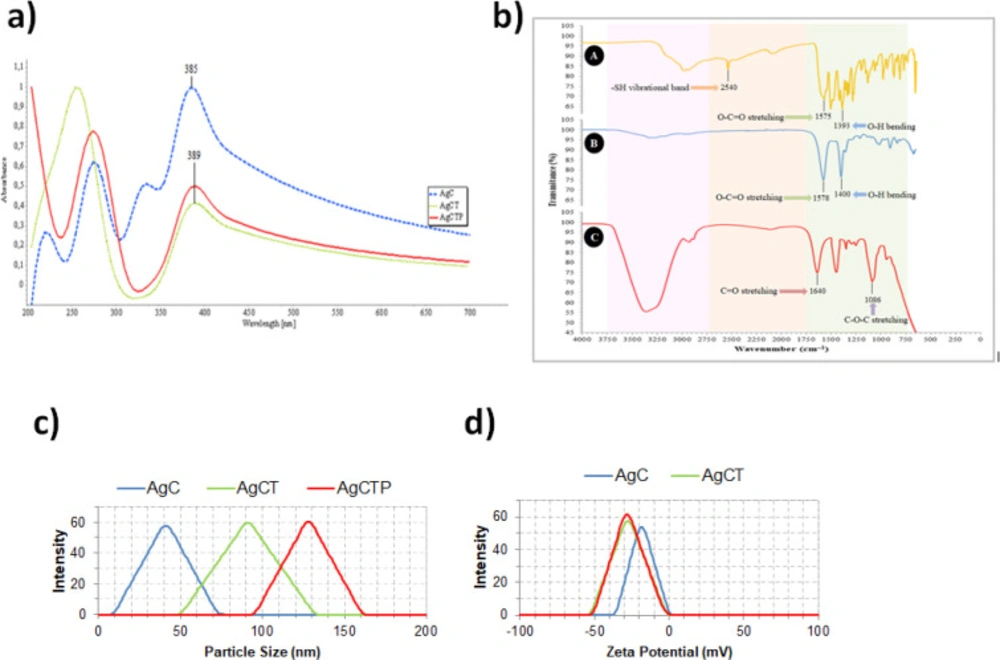
Polarized light-absorbing properties of AgCT NPs were examined by Ultraviolet-visible (UV-Vis) spectrophotometer (Thermo Scientific Multiskan Spectrum 1500, USA) with a range of 200-800 nm. The functional groups of AgCT NPs were confirmed by Fourier-transform infrared (FTIR) spectroscopy in the range of 650-4000 cm-1 (PerkinElmer UATR two, U.S.). Particle size and zeta potential values of the synthesized AgCT NPs were determined by Zetasizer (Nano ZS-90 Malvern Instruments, England).
Cell culture and cell survival assay
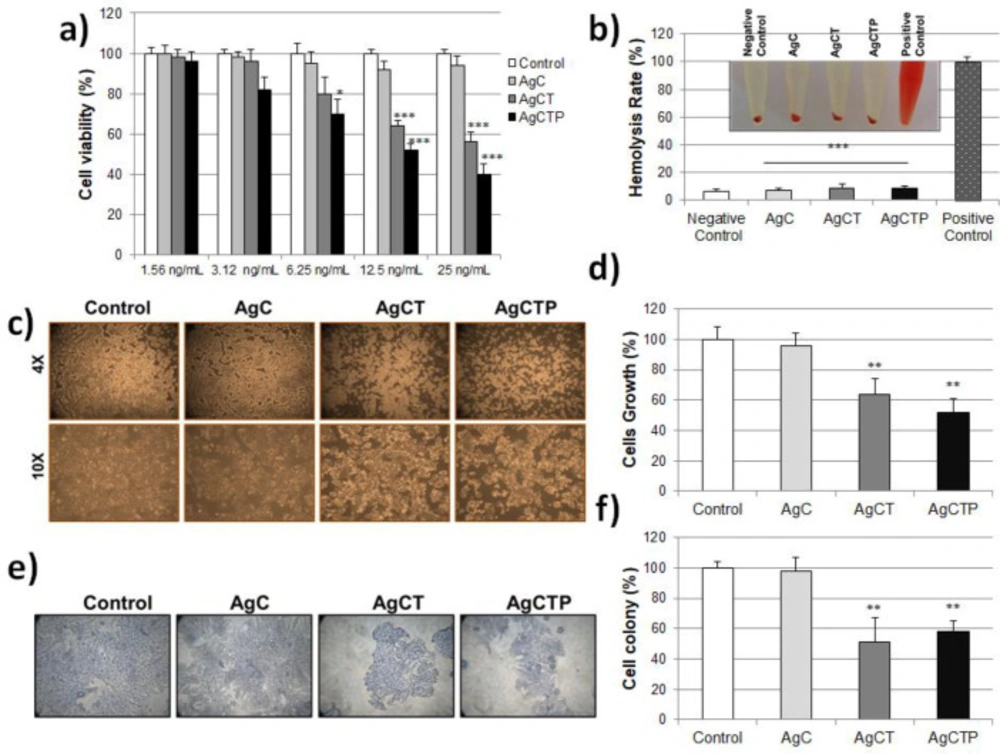
HT-29 human colon cancer cell lines were purchased from the American Type Culture Collection (ATCC, Manassas, VA, USA). These cells were cultured in Dulbecco’s Modified Eagle’s Medium (DMEM) supplemented with 10% FBS, 2 mM L-glutamine, 100 U/mL penicillin and 100 μg/mL streptomycin, and kept at 37 °C under 5% CO2. To determine the cell viability, cells were trypsinized and seeded into 96-well plates (1 × 10⁴ cells/well). The cells were treated with different concentrations (1.56–25 ng/mL) of AgCT NPs. Control cells were incubated without AgCT NPs. All wells were incubated for 24 h, then washed with PBS and added to 100 μL DMEM. For MTT assay, ten microliter of the MTT (3-(4,5-dimethylthiazol-2-yl)-2,5-diphenyltetrazolium bromide) (Vybrant, Invitrogen) labeling reagent was added to this wells and incubated for 4 h in a humidified atmosphere at 37 °C incubators with 5% CO2 in the air. After the incubation, 100 μL of the SDS buffer was added into each well for solubilization of formazan precipitate. Then absorbance was measured by microplate reader at 570 nm (Thermo Scientific Multiskan Spectrum 1500, USA). Each analysis was repeated 3 times. Cell viability was calculated as follows:
Cell viability% = (Abs(sample) - Abs(blank))/(Abs(control) - Abs(blank)) × 100
Cell growing assay
In order to investigate the effects of AgCT NPs on cell survival of HT-29 cells, these cells were treated with AgCT NPs, a final concentration of 1.19 ng/mL, in DMEM without antibiotics. In microscopic analysis, images were collected under an inverted microscope (Olympus CX51) with bright light. After 24 h, methylene blue staining was used in cell viability for Microscopic analysis. The cells extracted with 1% SDS in PBS solution were stained with 0.01% methylene blue solution and then spectrophotometrically was evaluated at 600 nm. Each experiment was repeated three times.
Colony formation assay
For evaluating colony formation, HT-29 cells seeded in six-well plates (1000 cells per well) were treated with AgCT NPs and cultured in a growth medium for 14 days. The medium was refreshed every 3 days until incubation was completed. At the end of incubation, each well in the plate was washed with PBS, fixed with cold methanol/acetic acid, stained with 0.5% crystal violet staining solution for 15 min and washed with dH2O, respectively. The stained cells were examined with a microscope. The number of colonies in each well was counted and analyzed.
Hemolysis Assay
The freshly obtained blood sample was put into tubes involving EDTA and centrifuged at 1000 ×g for 15 min. After discarding the supernatant, 10% (w/v) RBC solution was prepared with pellet in PBS (pH 7.4). One-hundred μL RBC solution and 900 μL AgCT NPs with different concentrations (25, 12.5 and 6.25 ng/mL) were mixed in a microtube and then were incubated at 37 °C for 1 h. By the way, 900 μL 0.9% NaCl and dH2O were used for negative and positive control, respectively. The mixtures were centrifuged at 1000 ×g for 15 min following incubation and supernatants were spectrophotometrically measured at 540 nm. The experiments were repeated three times. The percentage of hemolysis was calculated as follows:
Hemolysis% = (Abs(sample) - Abs (-control))/(Abs (+control) - Abs (-control)) × 100
According to this formula, the negative control was accepted as blank.
Western blot analysis
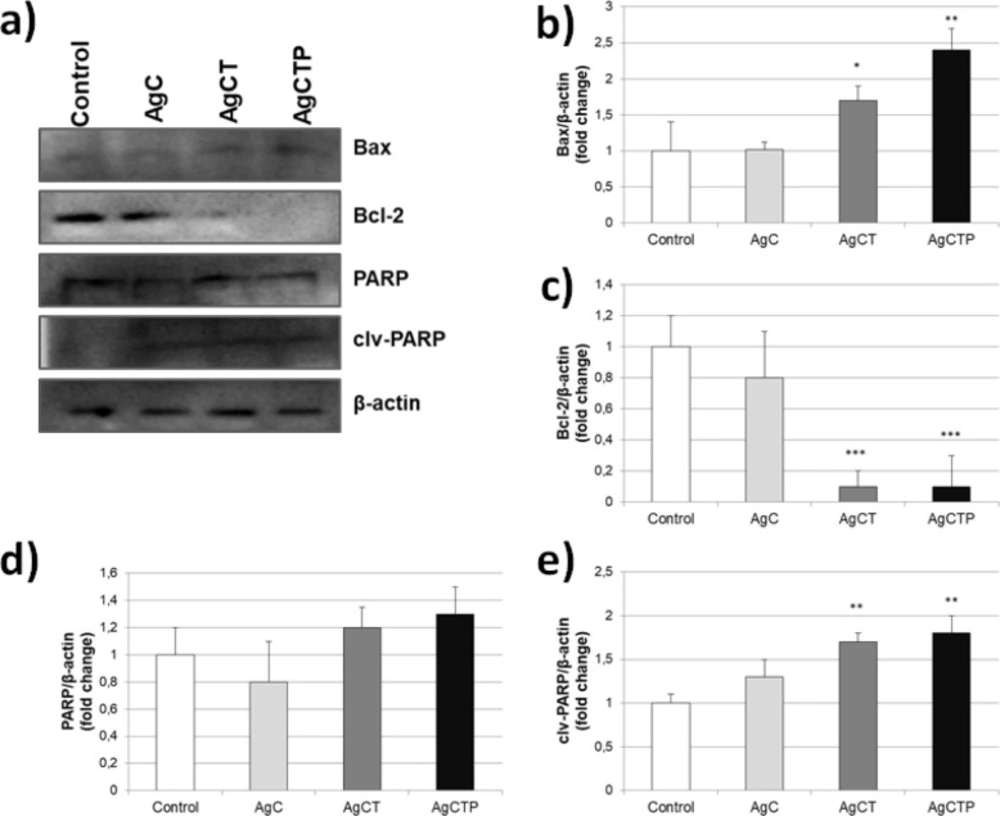
HT-29 cells were lysed with RIPA buffer after incubation with AgCT NPs. Protein detection was performed with bicinchoninic acid assay (BCA) and then 30 µg protein was loaded per well in 12% SDS-PAGE gel. Proteins were separated by SDS-PAGE and transferred onto PVDF membrane (sc-3723, Santa Cruz). The membrane was blocked with 3% BSA for 2 h at room temperature and then was incubated with primary antibodies (1:500 dilution of Bax, Bcl-2, PARP, clv-PARP and β-actin from Santa Cruz) at 4 °C overnight. After the incubation with primary antibody, PVDF membrane was washed with TBST (Tris-buffered saline, 0.1% Tween 20) and incubated with horseradish peroxidase-conjugated secondary antibody (mouse anti-rabbit IgG-HRP and goat anti-mouse IgG1-HRP from Santa Cruz) for 2 h at room temperature. Then the membrane was washed with TBST. Bands were visualized by the chemiluminescence Western blotting detection reagent (sc-2048, Santa Cruz) in imaging system (G:BOX Chemi XRQ SynGene, USA). β-Actin protein levels were used as a control to equal loading of the gel. The experiments were repeated three times.
Statistical analysis
The student t-test and analyses of variance (ANOVA) test were used for statistical analysis. If the p-value which is used to determine the level of statistical significance and difference, was equal to 0.05 or less than 0.05, it was considered significant. All data were represented as mean ± SD unless otherwise indicated. All experiments were repeated three times.