1. Background
Diazepam (DZ) is a drug in the benzodiazepine family commonly used for anxiety, muscle spasms, seizures, and sleep disorders (1). It is one of the most commonly prescribed medications for insomnia in the world. It is also an abused drug whose high dosage can lead to epileptic seizures. Overdose symptoms include drowsiness, confusion, coma, and decreased reflexes (2, 3). Various analytical methods have been used to determine diazepam in both biological and pharmaceutical samples, such as spectrophotometry (4, 5), capillary electrophoresis (2), electrochemical methods (6-8), and various chromatographic methods (9-11). Chemical and biochemical sensors are measuring devices that convert a chemical of a particular analyte into a measurable signal, where the signal is proportional to the concentration of the analyte (12). Among the sensors, fluorescent sensors have several advantages, such as sensitivity, simplicity, specificity, and fast response times (13).
Quantum dots (QDs) are one of the most promising materials for fabricating chemical sensors because of their unique size-dependent optical and electronic properties (14). However, the selectivity of QD-based fluorescent sensors is low. However, the main advantages of molecularly imprinted polymers (MIPs) are selectivity and affinity for the target molecule, which are used to separate and deliver bioactive molecules (15).
Therefore, the combination of the excellent optical properties of QDs and the selectivity of MIPs could be used as selective and sensitive chemical sensors (12). These core-shell materials have significant advantages, such as regular shape, large specific surface area, and tunable size (15, 16).
2. Objectives
In this work, a new selective and sensitive fluorescent sensor for the determination of diazepam was fabricated by printing imprinting a layer of Polymethacrylic acid (PMAA) on the Mn-doped ZnS QDs. The quenching effect of DZ on the fluorescence of the QDs was used to determine this drug.
3. Methods
3.1. Reagents and Chemicals
All reagents and solvents were analytical grade and used without further purification. ZnCl2 .7H2O and L-cysteine hydrochloride anhydrous were provided from Fluka (Buchs, Switzerland). MnSO4.H2O, Na2S2O3, and NaOH were purchased from Merck (Darmstadt, Germany). Methacrylic acid (MAA), Ethylene glycol dimethacrylate (EGDMA), 1-Hydroxycyclohexyl phenyl ketone, and diazepam were purchased from Sigma-Aldrich.
3.2. Apparatus
All X-ray diffraction (XRD) patterns were recorded using an X-ray diffractometer (Bruker AXS D8 Advance Bruker, Germany) with Cu Kα radiation (λ = 1.5418 Å). FT-IR Spectra were recorded with an FT-IR spectrometer (Tensor 27- Bruker) in the spectral range of 4000-40 cm1. TEM Image was acquired with a Leo 912 AB TEM. UV-vis absorption spectra of Mn-doped ZnS nanocrystals were recorded from aqueous Mn-doped ZnS QDs solutions using a Cecil CE5501 spectrophotometer (Cambridge, UK). Fluorescence measurements were recorded using a Shimadzu spectrofluorometer. All optical measurements were performed at room temperature.
3.3. Synthesis of Aqueous Mn-doped ZnS Quantum Dots
Colloidal water-soluble Mn-doped ZnS-QDs were synthesized in our previous study (16); in brief, 34 mg ZnCl2 and 40 mg L-cysteine were dissolved in 25 mL DW. The pH of the solution was adjusted to pH 11 with 1.0 M NaOH. After that, 10 mg MnSO4.H2O and 124 mg Na2S2O3 were added , and the final volume was adjusted to 50 mL. Then, the solution was degassed with nitrogen for 30 min and heated at 373 K for 90 min in a three-neck flask. As a result, a solution composed of Mn-doped ZnS-QDs was prepared and precipitated with ethanol. Finally, this content was centrifuged, decanted, and dried at 40 °C in a vacuum oven. As described in our previous work (16), FT-IR, UV-Vis, fluorescence, and XRD techniques were applied to characterize Mn-doped ZnS QDs.
3.4. Synthesis of MIP Coated by Mn-doped ZnS QDs
MIP coated with Mn-doped ZnS QDs were synthesized using methacrylic acid (MAA) monomer by a photopolymerization method (17). Briefly, 200 mg MAA monomer, 4.0 g EGDMA crosslinker, and 120 mg DZ were dispersed in 50% (v/v) chloroform. Oxygen was removed by bubbling nitrogen for 10 min. 200 mg of Mn-doped ZnS-QDs were added to the degassed solution, and then 80 mg of 1-hydroxycyclohexylphenyl ketone was added to the mixture as a photoinitiator. Finally, the photopolymerization process was performed under 365 nm UV illumination for 5 min. The solution was centrifuged to obtain the precipitated MIP-coated QDs, and the residue was washed with methanol. Finally, the stencil was removed by sonication with a mixture of methanol and acetic acid (8/1, v/v) for 30 minutes and then washed with methanol and dried under vacuum at room temperature. A non-imprinted polymer (NIP) was also synthesized similarly but without a template.
3.5. General Procedure for Diazepam Measurements
The design of our MIP-QDs sensor material is based on the interaction between Mn-doped ZnS QDs and target molecules, while the MIP shell ensures analyte selectivity by preventing interfering molecules from contacting the QDs (12). In this case, fluorescence quenching of the prepared MIPs in the presence of diazepam was used to determine diazepam.
A 5 × 10⁻² M alcoholic diazepam solution was prepared and kept as a stock solution. Then, different amounts of this stock solution were injected into 1.5 mL of aqueous MIP solutions (1.5 mL, 300 µg/mL); the final volume of each sample was adjusted to 2 mL by adding aqueous NaOH solution (0.1 mg/mL, 0.1 mL) and DI water. The fluorescence intensity of each solution was measured at λex = 320 nm. Finally, the calibration curve for fluorescence emission intensities at λem = 590 nm was plotted as a function of diazepam concentration.
3.6. Measurement of Diazepam in Real Samples
The standard addition method was used to determine DZ in tablets and human serum based on triplicate analyses for each sample.
3.6.1. DZ Tablets
For this purpose, ten tablets were accurately weighed and ground into a fine powder. A stock solution of 5.0×10⁻⁴ M diazepam was prepared by dissolving a given amount of diazepam in an ethanol-water mixture and sonicated for 10 minutes. The solution was then filtered, and 200 µL of the drug solution was injected into 1.5 mL of the MIP aqueous solutions (1.5 mL, 300 µg/mL). The appropriate amount of stock solution was also added, and the final volume of each sample was adjusted to 2 mL by adding aqueous NaOH solution (0.1 mg/mL, 0.1 mL) and DI water. The fluorescence intensity of each solution was recorded at λex = 320 nm, and the obtained fluorescence emission intensity at λem = 590 nm was compared with the calibration curve to calculate the concentration of DZ in the solution.
3.6.2. Human Serum Samples.
For performance evaluation of the proposed sensor in biological samples, 0.6 mL of diazepam-free human serum samples were spiked with 0.4 mL of diazepam standard solutions at different concentrations. After that, 0.5 mL of acetonitrile was added to the mixture. After precipitating plasma proteins isolated by centrifugation at 14000 rpm, the clear supernatant (0.4 mL) was transferred to a 25 mL volumetric flask and diluted with the B.R. buffer solution (pH = 4). diazepam was determined according to the recommended procedure (3).
4. Results and Discussion
4.1. Preparation of MIP Coated QDs
So far, most optimization methods have been one-factor-at-a-time optimization methods. This method is known as the "one-variable-at-a-time" method, meaning that experiments are conducted testing one factor or cause at a time rather than multiple factors simultaneously. This method neglects the effects of interaction between factors and has low efficiency in the optimization process (18, 19). In recent years, statistical experimental design methods have been developed to eliminate these problems. In this experiment, fractional factorial design of experiments (FFD) was applied to study the effects of variables on response, and the fabrication of MIP-coated QDs was optimized by the response surface method. In the FFD method, a careful selection of subsets is performed to determine the influence of experimental factors on the response signal (20).
To optimize the method for the preparation of MIP-coated QDs, the amount of diazepam was fixed at 120 mg, and the amount of the other components was optimized. The selected variables and their values are listed in Table 1. Two levels +1, 0, and 1 (high, medium, and low levels, respectively) were selected and repeated twice.
| Factors | Levels | ||
|---|---|---|---|
| -1 | 0 | 1 | |
| (A) Amount of MAA (mg) | 200 | 300 | 400 |
| (B) Amount of EGDMA (mg) | 2 | 3 | 4 |
| (C) Amount of QDs (mg) | 200 | 300 | 400 |
| (D) Amount of photoinitiator (mg) | 40 | 60 | 80 |
The Design-Expert Version 7.0 statistical software was used in this work. A
| std | Run | A | B | C | D | Response (%) |
|---|---|---|---|---|---|---|
| 3 | 1 | 200 | 4 | 200 | 80 | 25 |
| 4 | 2 | 400 | 4 | 200 | 40 | 18 |
| 5 | 3 | 200 | 2 | 400 | 80 | 10 |
| 9 | 4 | 300 | 3 | 300 | 60 | 19 |
| 6 | 5 | 400 | 2 | 400 | 40 | 15 |
| 7 | 6 | 200 | 4 | 400 | 40 | 12 |
| 8 | 7 | 400 | 4 | 400 | 80 | 16 |
| 10 | 8 | 300 | 3 | 300 | 60 | 19.1 |
| 2 | 9 | 400 | 2 | 200 | 80 | 14 |
| 1 | 10 | 200 | 2 | 200 | 40 | 17 |
That F0 and F1 were, respectively, the fluorescence intensity of MIP coated QD solution before and after the addition of DZ.
Factorial fraction designee is useful for showing how to construct fractional designs, calculate contrasts and interpret results, but misidentifying the effect may cause ambiguity (21). The aliases structures for
[A] = A + BCD
[B] = B + ACD
[C] = C + ABD
[D] = D + ABC
[AB] = AB + CD
[AC] = AC + BD
[AD] = AD + BC
As can be seen, each main effect interacts with three other factors. In a
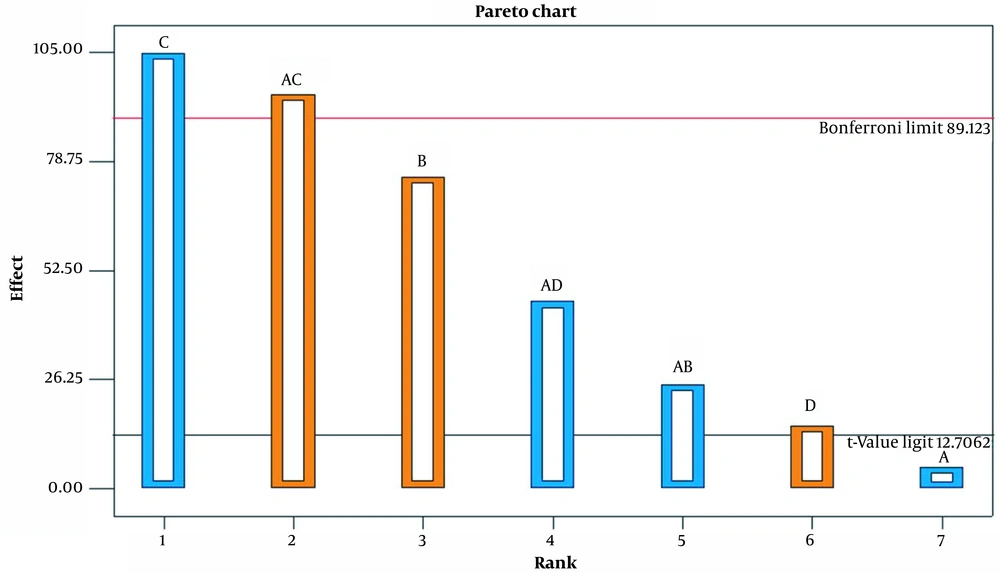
The variance method (ANOVA) analysis was used to estimate the influence of a particular factor and its interactions on the response. The influence of the factors on the experiment results is shown as a Pareto diagram in Figure 1. As can be seen, both the main effect and the two-factor interaction are important and were therefore included in the model. Table 3 shows ANOVA results for the selected factorial model.
| Source | Sum of Squares | df | Mean Square | F Value | P-Value Prob > F | Significance |
|---|---|---|---|---|---|---|
| Model | 142.88 | 7 | 20.41 | 4082.14 | < 0.01 | Significant |
| Curvature | 16.13 | 1 | 16.13 | 3225.80 | < 0.01 | Significant |
| Residual | 5.0 × 10⁻³ | 1 | 5.0 × 10⁻³ | No significant | ||
| Lack of fit | No significant | - | ||||
| Pure error | 5.0 × 10⁻³ | 1 | 5.0 × 10⁻³ | R-Squared = 0.9997; Adeq precision = 223.607 | ||
| Cor. total | 159.01 | 9 | ||||
As can be seen, the effects of the model and curvature are important, but the residual effects are not significant. The R2 value (0.9997) is very close to 1, which means that the model is appropriate, which tells us that more than 99% of the data are described by this model. Accuracy of adequacy is a rule of S/N that can be said about the model to circumnavigate the design space. A ratio greater than 4 means that the model is appropriate. In this case, the value was more than 4. The results show that LOF is not important compared to pure error.
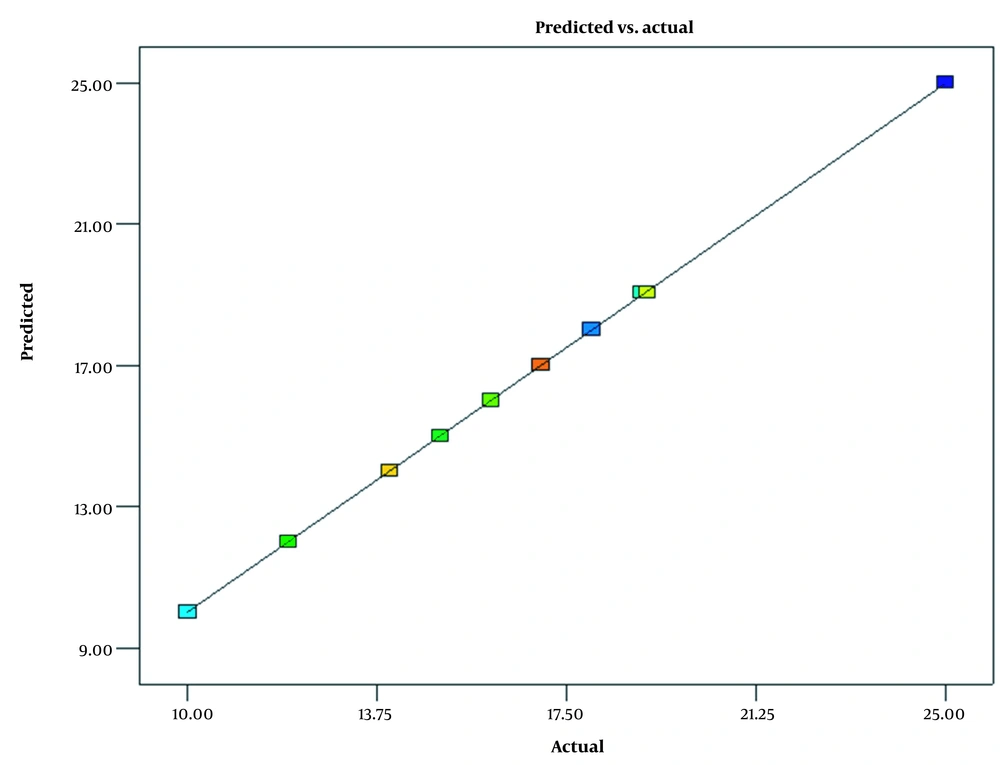
The experimental and predicted data results are shown in Figure 2. The results show that the predicted model almost agrees with the experimental data. The predicted values lie on the diagonal line. Almost all values lie on this line, which confirms the accuracy of the obtained model.
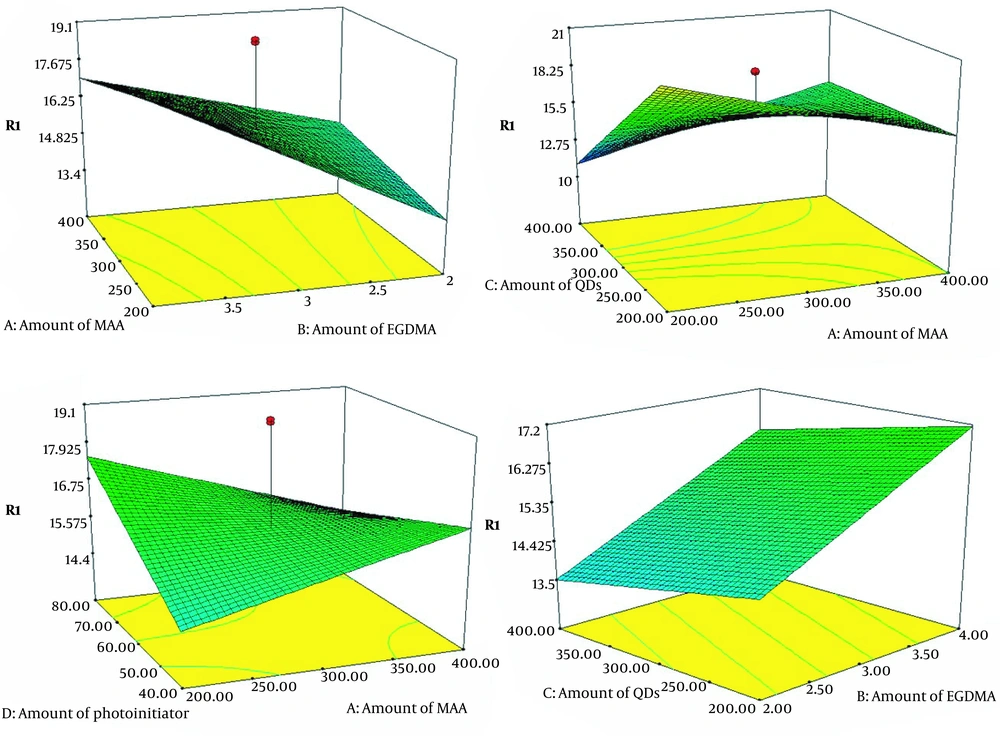
The surface plots are illustrated in Figure 3. The synthesis process was optimized by applying this model. The results are as follows: A (200), B (4), C (200), and D (80). The experiment was repeated three times under optimal conditions. The average of the obtained responses was 25, and the results had good reproducibility (RSD% = 4.7). The above-optimized circumstances were selected for synthesis.
4.2. Characterization of MIP-coated QDs
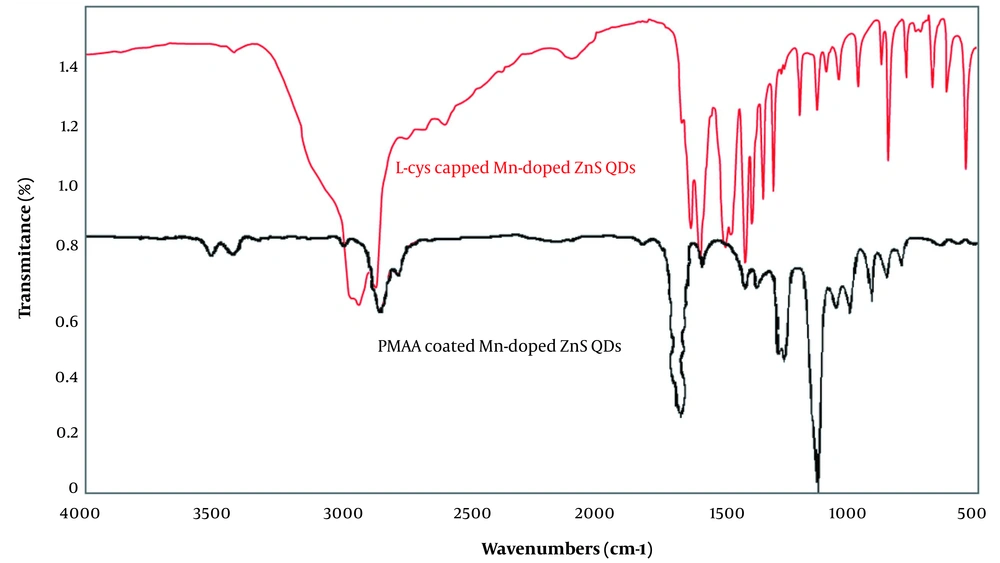
The Fourier transform infrared (FT-IR) spectra of L-cysteine-capped Mn-doped ZnS QDs, and PMAA-coated QDs are shown in Figure 4. For the L-cys capped QDs, the IR absorption band around 1550 - 1600 cm-1 (sν̄ COO−), 1400 cm-1 (mν̄ COO−), 3000 - 3500 cm-1 (mν̄ OH, COOH), indicate the –COO− group. The peak at 2900 - 3420 cm-1 (mν̄ N–H) indicates the –NH2 group and 600 - 800 cm-1 (wν̄ C–S) indicates the C–S group. These peaks show the formation of covalent bonds between thiols and Zn2+ (24), while for PMAA imprinted QDs, the peaks related to the –NH2 group and C–S groups disappeared, and the peaks related to –COOH groups were presented.
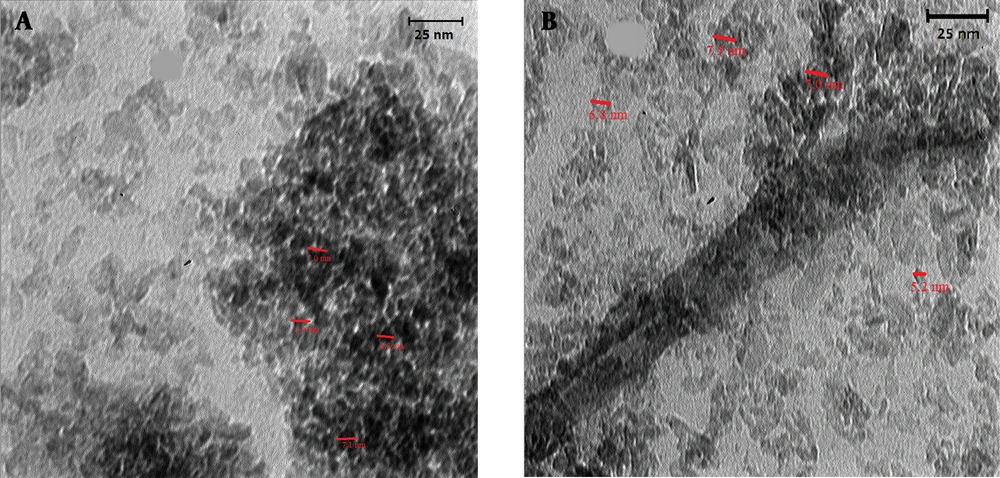
As other tools for verifying the formation of MIP coated QDs, the TEM images of synthesized Mn-doped ZnS QDs and PMAA imprinted Mn-doped ZnS QDS are shown in Figure 5. Figure 5 shows that the particles are somehow aggregated, and the size of DDs is 5 - 8 nm.
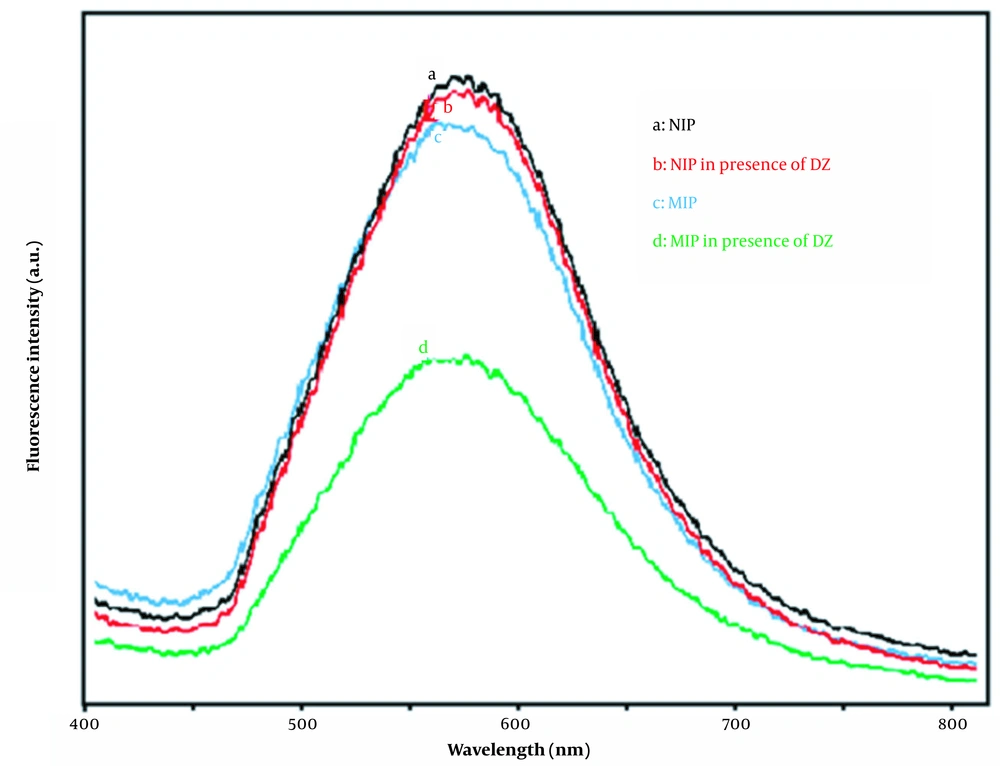
In the next stage, the fluorescence spectra of synthesized materials were compared in Figure 6. As can be seen, the fluorescence intensity of Mn-doped ZnS QDs in the presence of diazepam is decreased, but no quenching can be observed for NIPs. In NIPs, the PMAA layer on the surface of QDs provides an insulating layer to prevent the contact of DZ molecule by QDs surface. However, in MIPs, the contact of DZ molecules with the surface of QDs has been established through the template sites.
4.3. Analytical Application
4.3.1. Calibration Curve
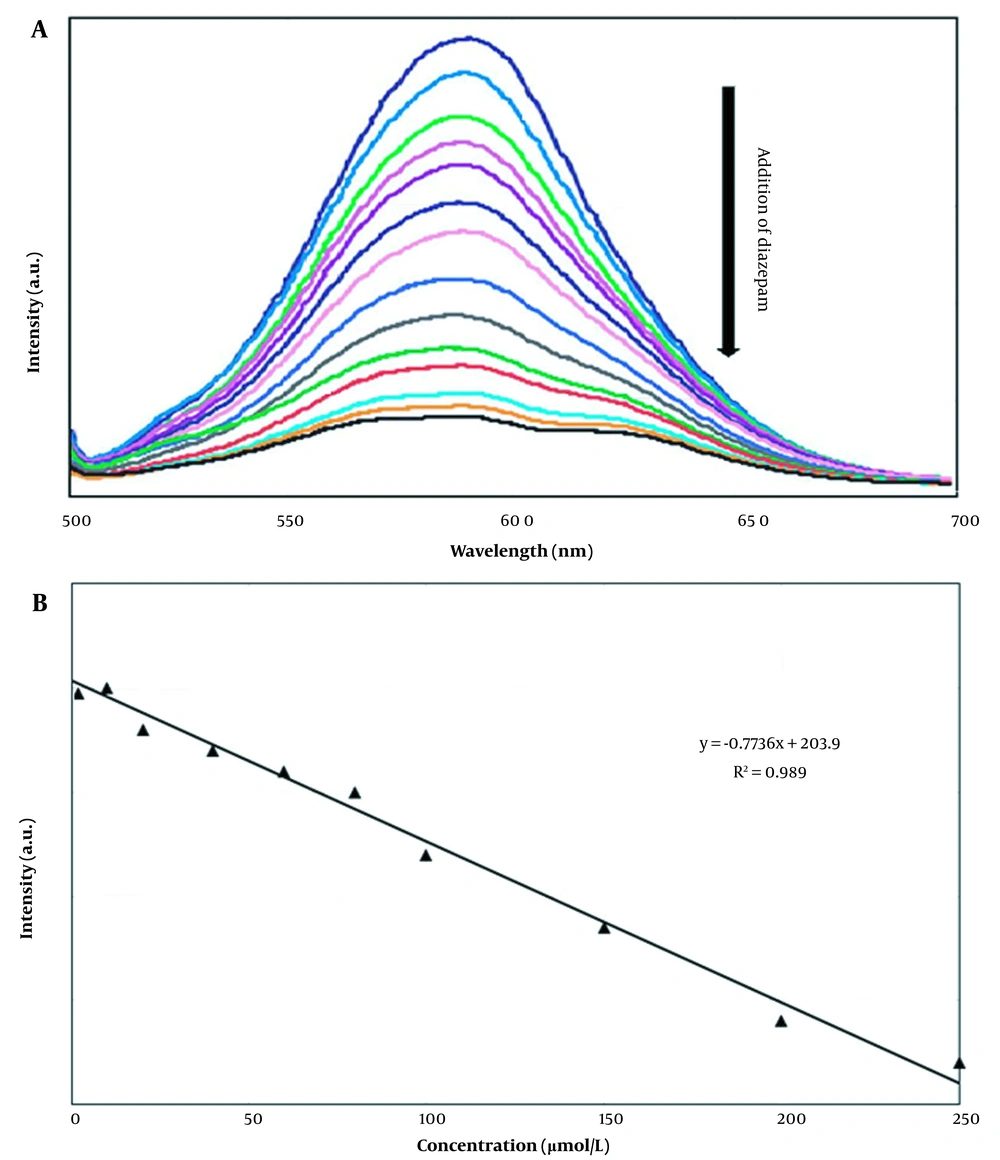
The fluorescence intensity of PMAA-imprinted Mn-doped ZnS QDs as a function of diazepam concentration is shown in Figure 6 (a). This MIP layer prevents interfering molecules from contacting the QDs and consequently provides selectivity for the target molecules (12).
The effective determination of diazepam was investigated with molecularly imprinted Mn-doped ZnS QDs from PMAA by preparing standard solutions of diazepam. The fluorescence spectra of the standard solutions were recorded in the presence of a constant amount of MIP (50 mg). The calibration curve was prepared by plotting the fluorescence intensity as a function of diazepam concentration. As shown in Figure 7B, there is a good linear relationship between intensity and diazepam concentration. The dynamic linear range (LDR), detection limit (LOD), and correlation coefficient (R2) of the calibration curve gave 0.3-250 µmol/L 8.78 × 10⁻² µmol/L and 0.989, respectively. Table 4 shows the determination of diazepam by the other methods and this work.
4.3.2. Complementary Studies
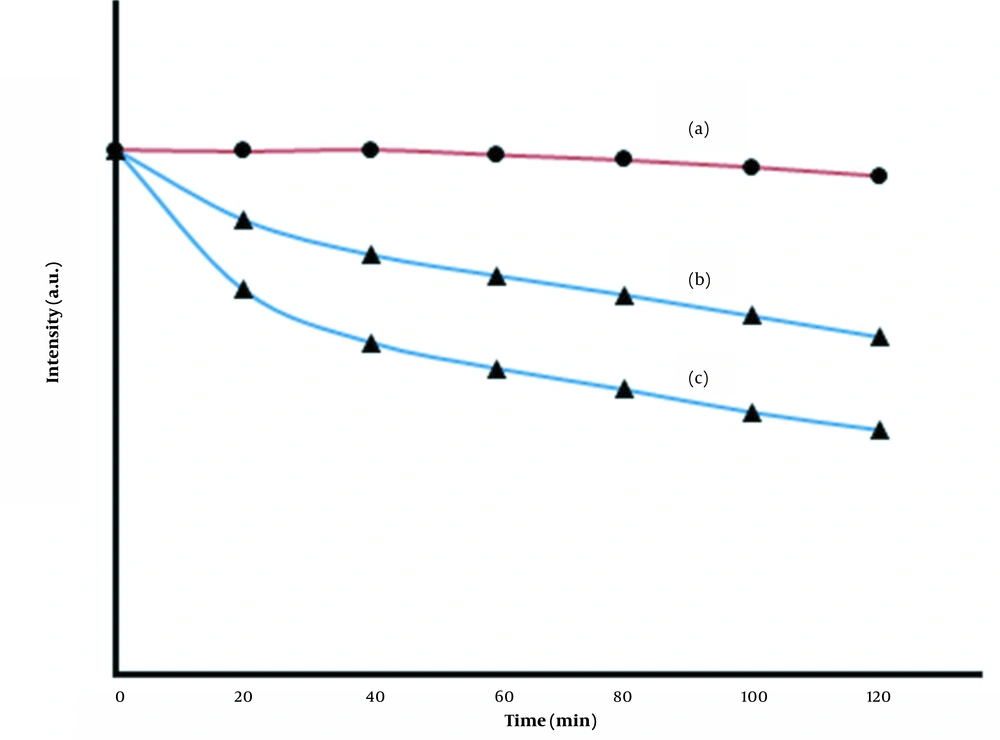
To investigate the effect of time on the fluorescence quenching of the prepared MIPs, measurements of the photostability of the MIP sensor after interaction with DZ were performed, and the results are shown in Figure 8. As Figure 8 (a) shows, the fluorescence intensity of the MIP solution did not change significantly during the incubation period, indicating that the prepared MIPs were exceptionally stable under these conditions. The trends of changes in Figure 8 (a-c) show that the quenching rate depends on the concentration DZ, i.e., the fluorescence intensity decreases with the increasing concentration of DZ.
The selectivity of the method was investigated with some inorganic ions and organic compounds. The tolerance limit was considered to be less than ±5% (RSD) of the foreign species in the presence of a constant concentration of diazepam (100 µmol/L) (24). The results are shown in Table 5. As can be seen from the table, this MIP sensor has good selectivity for diazepam over most organic molecules. The tolerance level was low in the case of oxazepam, Restoril, lorazepam, and nordazepam. These compounds are pharmacologically active metabolites of diazepam metabolism and have a similar structure to diazepam. It can be concluded that the prepared nanosensor is selective for diazepam and its metabolites. This is an advantage because diazepam metabolites are commonly found in the blood.
| Interferents | Tolerance Limit (mol Ratio) |
|---|---|
| Mn2+, Cu2+, Ni2+ | 40 |
| Na+, K+ | 200 |
| Fe3+, Al3+, Mg2+, Ca2+ | 50 |
| Glucose, starch, lactose, ascorbic acid, tryptophan | 600 |
| Phenylalanine | 250 |
| Urea | 100 |
| Oxazepam, restoril, lorazepam | 10 |
| Nordazepam | 5 |
As another result from Table 5 shows, the selectivity of the prepared nanosensor to inorganic ions is low. However, inorganic ions are excellent quenchers. The effect of inorganic ions can be considered a matrix effect since inorganic ions are present in biological fluids. This interference can be avoided when performing determinations with the standard addition technique.
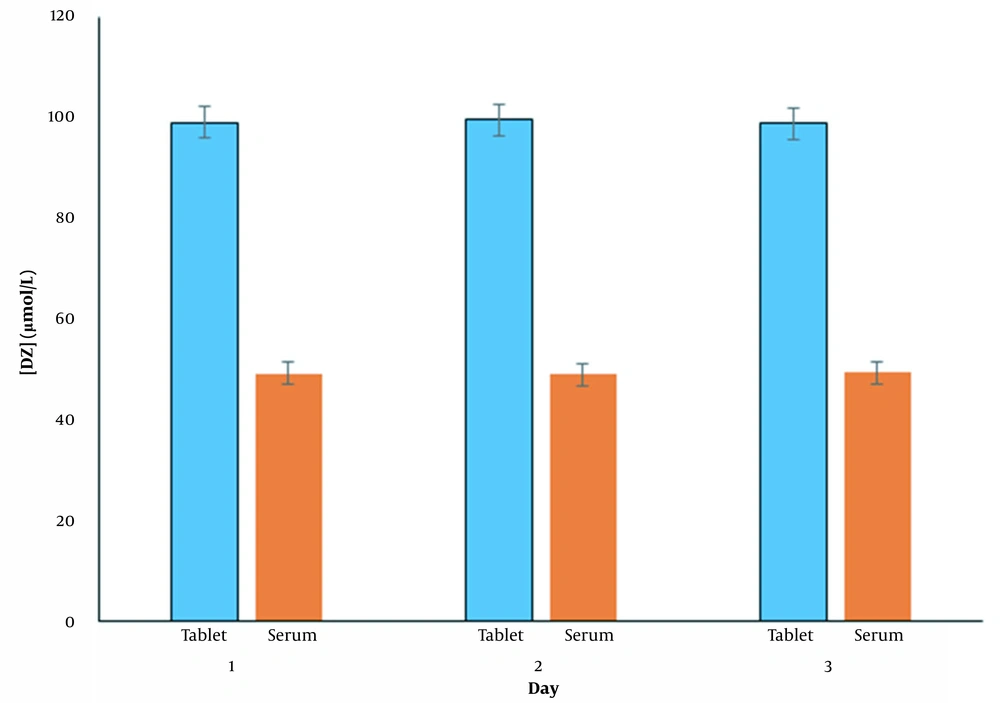
To verify the performance of the proposed method, an analysis of diazepam in diazepam tablets and human serum samples was performed. The results for measuring DZ levels on different days in tablet and human serum samples after adding 50 μmol/L DZ to each sample are shown in Figure 9. As can be seen, reasonable recoveries and RSD% were obtained, indicating that the proposed method can be used to determine diazepam in real samples. (Table 6)
| Sample, Added (µmol L-1) | Observed (µmol L-1) | Recovery (%) | RSD (n = 3) (%) |
|---|---|---|---|
| Tablet | |||
| 0 | 50.12 | 100.24 | 6.17 |
| 20 | 69.76 | 99.66 | 4.32 |
| 50 | 99.12 | 99.12 | 3.12 |
| 100 | 150.30 | 100.20 | 4.65 |
| Serum | |||
| 20 | 18.71 | 93.55 | 7.76 |
| 50 | 49.21 | 99.02 | 4.54 |
| 100 | 98.70 | 98.70 | 3.89 |
5. Conclusions
In summary, we have presented a selective method for determining diazepam using Mn-doped ZnS QDs. The diazepam was used as a monomer to provide effective recognition sites. The obtained MIPs showed good selectivity towards the target molecules (diazepam). These artificial receptors were used to determine diazepam in pharmaceutical tablets and human serum samples.

