


1. Background
According to the Food and Drug Administration (FDA) definition, a dietary supplement is a product that is taken by mouth that contains "dietary ingredients" to add more nutritional value to the diet (1).
Dietary supplement consumption has been increasing in recent years, and it seems that elite athletes use supplements much more than amateur athletes (2, 3). There are several reasons for athletes' consumption of sports supplements as a subgroup of dietary supplements: enhancing performance and post-exercise recovery, improving health status, compensating micronutrient deficiencies and macronutrient needs, preventing or treating illness, and manipulating the physique (4-6).
Dietary supplement manufacturers do not require FDA approval before producing or releasing to the market. No law requires the manufacturer to prove the correct claim before it appears on the product label. When a dietary supplement enters the marketplace and the product poses a risk to consumer health or is misbranded and contains contaminants, the FDA's role begins (7, 8). The lack of local rules and ease of access to these products in online shops, supermarkets, and parallel markets in the gym creates new concerns about their safety, composition, and adulterants. There is also a concern specifically about supplements containing anabolic steroids filled in underground laboratories and sold illegally in the market (9-11).
The prevalence of positive doping tests in those using supplements is 3.5 times compared to those who do not use any supplements, so consumption of contaminated products with prohibited substances announced by the World Anti-doping Agency (WADA), whether intentionally or unintentionally, will cause a positive doping test for athletes in professional competitions (12-14). Among sports supplements, anabolic-androgenic steroids have been banned since the mid-1970; nevertheless, anabolic androgenic steroids (AAS) is a major latent contaminant in muscle-building supplements and the most abused class of drugs in competitive sport (half of the 4500 adverse analytical findings in doping testing at WADA laboratories) (15-17).
On the other hand, the improper use of AAS among youth and adolescents causes serious medical problems such as hair loss, acne, sexual and reproductive dysfunction, psychiatric disorder, and an increase in cardiovascular risk (18).
Due to the mentioned side effects and the prevalence of AAS as a contaminant in supplements and the evidence such as the fact that even small amounts of 2.5 μg of a nandrolone precursor (19-norandrostenedione) in 5 g of creatine supplement cause a positive urine test for 25% of consumers under WADA rules (19), a method for simultaneous assay of AAS with high accuracy, precision, availability, fast and low cost is needed to screen supplements and prevent intentional and unintentional doping.
Most of the various methods used for analyzing AASs in counterfeit products involve a GC-MS (20-22) or LC-MS/MS (23-26) for the separation/detection step. We developed a simple extraction method and then used high-performance thin-layer chromatography (HPTLC) to detect and quantify the mixture of 10 AASs, which have not been previously determined simultaneously by this method. The method's advantage over the conventional LC and GC-based methods is that it allows multiple sample detection in one run with acceptable limit of detection (LOD) and limit of quantitation (LOQ). Furthermore, the liquid or gas chromatography instrumentation is more expensive than HPTLC and more complex to operate, but HPTLC is user-friendly and easily available.
2. Methods
2.1. Materials
Sulfuric acid (purity > 95 - 97%), acetone, chloroform, methanol, cyclohexane, ethyl acetate, and n-Hexane (analytical grade) were purchased from Merck (Darmstadt, Germany). 19-norandrostenedione (purity > 99.5%), 19-nortestosterone (purity > 98%), methyltestosterone (purity > 98%), clostebol (purity > 99.9%), stanozolol (purity > 98.38%), trenbolone enanthate (purity > 99.9%), oxymetholone (purity > 97%), oxandrolone (purity > 97%), testosterone enanthate (purity > 96%), nandrolone decanoate (purity > 95%) were purchased from LGC. HPTLC plates, silica gel 60 F 254 20 cm × 10 cm were from Merck KGaA, Darmstadt.
2.2. Instrumentation and Chromatographic Condition
A CAMAG system, equipped with automatic thin-layer chromatography (TLC) sampler 4 (ATS4), automatic developing chamber 2 (ADC2), TLC visualizer 2, TLC scanner 4, integrated software of WinCats (version 1.2.3), and precoated silica gel TLC-cards was used for the analysis of AASs. The samples and standards were spotted on the TLC sheet as 8mm width bands by CAMAG 25 μL syringe using ATS4 CAMAG. A fixed application rate of 0.1 μL.s-1 was selected, and the distance between the two bands was 18.7 mm. Several mobile phases with various ratios were examined to optimize the retardation factor (Rf) values of the compounds. The plate was transferred to ADC2, and the development was carried out with an optimized mobile phase under unsaturation conditions. Based on our experience, no saturation condition is necessary during the TLC development process, and saturation condition has no effect on Rf values. The TLC scanning was performed on CAMAG TLC scanner 4 at 254 nm, 366 nm, and visible (Table 1). Detection under UV 366nm and daylight required the plate's pretreatment with 10% sulfuric acid in methanol and heating for 10min at 100°C. Eventually, an evaluation of the plate by WinCats software using the peak areas of spots was performed.
| Steroids | Retardation Factor (Elution System) a | UV 254 | UV 366 (Sulfuric Acid 10% in MeOH) | White Light (Sulfuric Acid 10% in MeOH) |
|---|---|---|---|---|
| 19-nor androstenedione | 0.72 (Elution system 1) | + | + (Dark green) | + |
| 19-nortestosterone | 0.4 (Elution system 1) | + | + (Green-brown) | + (Orange-brown) |
| Methyltestosterone | 0.29 (Elution system 2) | + | + (Yellow) | + (Yellow) |
| Clostebol | 0.25 (Elution system 2) | + | + (Violet) | + (Light green) |
| Stanozolol | 0.1 (Elution system 1) | - | + | + |
| Trenbolone enanthate | 0.65 (Elution system 2) | + | + (Light green) | + (Green) |
| Oxymetholone | 0.59 (Elution system 1) | + | + | |
| Oxandrolone | 0.44 (Elution system 1) | - | + | + (Blue) |
| Testosterone enanthate | 0.8 (Elution system 3) | + | + | + |
| Nandrolone decanoate | 0.82 (Elution system 3) | + | + | + |
Retardation Factor Values and Absorption Wavelengths for the Ten Steroids
2.3. Standard Solutions
The standard substances were kept according to the supplier's directions. Stock solutions were prepared at the final concentration of 1 mg/mL in methanol solvent.
2.4. Samples and Extraction
The samples included in this study were whey proteins for athletes collected from pharmacy stores in the city to verify the presence/absence of AASs adulterants. The 50 collected samples consisted of solids tablet (n = 9) and powders (n = 41).
The extraction step is performed according to the modified QuEChERS method. One gram NaCl, 4 g (± 5%) anhydrous MgSO4, 1 g trisodium citrate dihydrate, and 0.5 g disodium hydrogen citrate sesquihydrate were filled in a 15 mL PTFE centrifuge tube. Then the samples (0.5 g) were dissolved in 10 mL water/acetonitrile (50% v/v) and added to the tube. The mixture was shaken vigorously for 10 s, vortex mixed for 1 min, and then centrifuged for 3 min at 4000 rpm. One milliliter aliquot from the upper part of the extract was transferred into a microcentrifuge tube containing 150 mg (± 10%) MgSO4, 50 mg (± 10%) of primary secondary amines (PSA) sorbent, and 50 mg C18 (± 10%). The mixture was then shaken, vortex mixed, and centrifuged for 3 min at 4000 rpm. Five hundred microliters of acetonitrile extract were transferred to HPTLC vials.
2.5. Method Validation
The method was validated based on the ICH guidelines by calculating the following parameters: linearity, LOD, and LOQ, specificity and selectivity, precision, and accuracy. A sample analyzed by the LC-MS/MS system that had none of the target compounds was used as a blank matrix. The matrix-blank samples (solid and liquid types) were analyzed to confirm the selectivity and determine potential interference due to the endogenous substances in the target matrices. Linearity was evaluated by determining standard calibration solutions prepared three times at five concentration levels over the range of 3 - 250 μg/mL (the linearity range for each androgen is given in Table 2). The measured peak areas versus the corresponding concentrations were processed using the equation of calibration curves created by the least square regression method. The calibration curves were evaluated based on the value of correlation coefficients (r). The standard calibration curve's linearity was investigated at five different concentration levels, and three replicate measurements were conducted. The LOD was obtained by analyzing matrix-blank samples that were spiked at four concentrations (5, 10, 20, and 40 ng/spot), and it was found at a concentration value giving a signal-to-noise response (S/N) > 3. The LOQ was defined as the lower level of the calibration curve (e.g., 60 ng/spot for clostebol), which should give a signal-to-noise response (S/N) > 10 with an acceptable precision and accuracy (%CV < 20%). The specificity of the method was studied by simultaneously analyzing standard solutions and blank samples. The spots for AASs in the sample were confirmed by comparing the Rf of the samples' peaks with that of the standard. Any bands in the solvent blank, matrix-blank samples, and spiked matrix-blank samples were compared with standard solutions and analyzed for selectivity assessment. Also, the presence of any interfering substance at the specific Rf with a similar structure, such as corticosteroids, was checked. The precision of the method was defined by inter-day and intra-day analysis studies. To evaluate the intra-day and inter-day precision, the blank samples of the whey protein were spiked at two different concentrations (0.2 and 0.4 μg/spot). The intra-day precision of the method was determined by spotting the spiked samples in triplicate on the same day. The inter-day precision assays were determined in triplicate on three different days. Eventually, results were statistically evaluated in terms of % RSD.
| Calibration Curve Parameters | ||||
|---|---|---|---|---|
| Compound | Slope | Intercept | R2 | Range of Linearity (μg/mL = ppm) a |
| 19-nor androstenedione | 197506 | 1230.4 | 0.9953 | 7 - 50 |
| 19-nortestosterone | 155908 | 1002.8 | 0.9915 | 7 - 50 |
| Methyltestosterone | 160219 | 239.25 | 0.9946 | 3 - 20 |
| Clostebol | 153825 | 191.25 | 0.9986 | 3 - 20 |
| Trenbolone enanthate | 78928 | 57.384 | 0.9995 | 3 - 20 |
| Stanozolol | 20607 | 28.692 | 0.9985 | 3 - 20 |
| Oxymetholone | 38993 | 274.63 | 0.9976 | 25 - 250 |
| Oxandrolone | 82189 | 554.55 | 0.9945 | 7 - 50 |
| Testosterone enanthate | 204298 | 152.9 | 0.9968 | 3 - 20 |
| Nandrolone decanoate | 134813 | 193.53 | 0.9936 | 3 - 20 |
Linear Regression Data for the Calibration Curves of Anabolic Androgenic Steroids
The accuracy of the analytical method was expressed through percent recovery (%R). This item was determined by comparing the peak area from spiked samples to standard solutions at equivalent concentrations.
2.6. Analysis of Real Samples
Fifty sports supplement samples were collected from the retail market in Tehran during the time period of May 2020 to May 2021. All the samples were subjected to the sample preparation process explained in the samples and extraction section. None of the samples were screened as positive using the HPTLC method, and the validity of the results was reconfirmed by a validated LC-MS/MS method.
3. Results
The suggested method can separate the anabolic androgenic steroids in sports supplements, using a simple, fast, and efficient sample preparation procedure that guarantees accurate results.
Different combinations of organic solvents (e.g., chloroform-acetone-ethyl acetate-n-hexane) in various volume compositions were used in this study. The optimal mobile phase for the ten steroids at the beginning is chloroform/acetone (9: 1). Using this eluent solvent, five AASs get separated (19-nor androstenedione, 19-nortestosterone, stanozolol, oxymetholone, and oxandrolone) and five other AASs (methyl testosterone, clostebol, trenbolone enanthate, testosterone enanthate, and nandrolone decanoate) appear as two bands. In order to separate these five AASs, the plate was transferred to another tank, and a second eluent solvent system used ethyl acetate/n-hexane (6.5: 3.5) to separate methyl testosterone, clostebol, and trenbolone enanthate or cyclohexane/ethyl acetate/methanol (8: 2: 0.5) to separate testosterone enanthate and nandrolone decanoate.
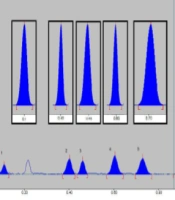
The retardation factor of each standard is listed in Table 1, based on the specific mobile phase mentioned below. Also, chromatograms of all analytes with peak purity chart were placed in the Supplementary File.
At the end of the chromatographic run, the plates were visualized at 254 nm. The plates were also immersed in sulphuric acid solution (10% in methanol) and then visualized at 366 nm and visible light. All the AASs appeared as clear spots at 254 nm except oxandrolone and stanozolol. Oxandrolone and stanozolol can be identified at 366 nm only after spraying sulphuric acid solution and can be dried in the oven at 100°C for 10 minutes. Quantifying all steroids was performed using the wavelength of 254 nm except for oxandrolone and stanozolol, which are quantified after immersing the plate in sulphuric acid solution (10% in methanol) and measurement of absorbance at 366 nm.
The HPTLC-chromatographic method was validated based on the ICH guidelines in terms
of specificity, linearity, limit of quantification, limit of detection, accuracy, and precision (27).
The first step of the method development was determining the LOD and the LOQ for each hormone. Table 3 presents the LODs and LOQs for the AASs included in the screening.
| Compound | Limit of Detection (μg on the spot) | Limit of Detection (μg/g = ppm of supplement) | Limit of Quantitation (μg on the spot) | LOQ (μg/g = ppm of supplement) |
|---|---|---|---|---|
| 19-nor androstenedione | 0.04 | 40 | 0.14 | 140 |
| 19-nortestosterone | 0.04 | 40 | 0.14 | 140 |
| Methyltestosterone | 0.02 | 20 | 0.06 | 60 |
| Clostebol | 0.02 | 20 | 0.06 | 60 |
| Trenbolone enanthate | 0.02 | 20 | 0.06 | 60 |
| Stanozolol | 0.02 | 20 | 0.06 | 60 |
| Oxymetholone | 0.16 | 160 | 0.5 | 500 |
| Oxandrolone | 0.04 | 40 | 0.14 | 140 |
| Testosterone enanthate | 0.02 | 20 | 0.06 | 60 |
| Nandrolone decanoate | 0.02 | 20 | 0.06 | 60 |
Limit of Detection and Limit of Quantitation of Anabolic Androgenic Steroids for the High-Performance Thin-Layer Chromatography Screening Method
Table 2 shows linearity parameters (slopes, intercepts, and correlation coefficients obtained on three different supplements) for each AAS included in the present study. The method showed good linearity over the range from the LOQ of each steroid to 1000 μg.g-1 of nutritional supplement.
As mentioned before, the precision of the method was determined through intra-day precision (repeatability) and inter-day precision: By studying the samples of whey protein at levels of 0.2 and 0.4 μg/spot three times on the same day (intra-day precision) and by studying the same samples on three different days over a period of three weeks (inter-day precision). Table 4 shows the results of the precision studies expressed as the coefficient of variation of the measured peak area (%CV) for AASs in the analyzed samples at two different concentrations. The accuracy of this method was calculated through the recovery study and expressed as the percent recovery of AASs at each concentration level. Percent recovery was assessed by comparing the peak area from the spiked samples to standard solutions at equivalent concentrations at three different concentrations, i.e., 0.01, 0.02, and 0.05 μg.mL-1, by triplicate analyses on three different days. The results of concentration levels for each AAS are summarized in Table 4.
| Compounds | Inter-day Precision (%CV of Peak Area) | Intra-day Precision (%CV of Peak Area) | Recovery (%) |
|---|---|---|---|
| 19-nor androstenedione | 0.72 - 7.57 | 7.57 - 11.58 | 98.12 - 113.25 |
| 19-nortestosterone | 1.15 - 1.26 | 4.58 - 12.37 | 97.7 - 114.41 |
| Methyltestosterone | 2.58 - 5.03 | 6.58 - 7.61 | 98.61 - 105.48 |
| Clostebol | 1.13 - 1.38 | 3.04 - 6.73 | 99.48 - 101.5 |
| Trenbolone enanthate | 4.02 - 4.11 | 0.35 - 1.75 | 99.5 - 101.6 |
| Stanozolol | 4.28 - 5.03 | 0.45 - 1.4 | 99.12 - 103.84 |
| Oxymetholone | 0.67 - 3.16 | 4.7 - 6.7 | 98.74 - 108.66 |
| Oxandrolone | 1.48 - 3.09 | 3.78 - 10.75 | 99 - 106.81 |
| Testosterone enanthate | 6.66 - 7.10 | 10.33 - 12.01 | 94.21 - 105.44 |
| Nandrolone decanoate | 7.38 - 8.84 | 7.86 - 13.82 | 99.27 - 106.07 |
Inter-day and Intra-day Precision and Recovery for Determination of Anabolic Androgenic Steroids in Supplement Analysis by High-Performance Thin-Layer Chromatography (n = 3)
4. Discussion
A fast, cheap, and simple HPTLC method was developed for the multi-residue analysis of ten anabolic androgenic steroids in sports supplements using the QuEChERS clean-up method. The method was validated based on the ICH guidelines. This method permits efficient simultaneous analysis of the most prevalent AASs at the concentration level of 60 - 500 ppm with acceptable repeatability, selectivity, and sensitivity in the sports supplements.
Restani et al. have developed a screening HPTLC method for seven steroids in sports supplements (11). However, their method does not quantify the analytes and is only proper for qualitative detection (11). In another study, Musharraf and Gulzar reported an HPTLC method for determining testosterone derivatives in pharmaceutical formulations (28). However, their sample preparation method could not be used for sports supplements due to the simplicity of the matrix of their samples. There are other reported methods in which a single steroid has been determined by HPTLC (29). However, in our study, simultaneous determination of ten AASs has been reported.
A few other studies have reported using different elution systems to separate steroids on a single HPTLC plate. However, they have used 2D HPTLC (30) or programmed multiple developments (31, 32). We used three eluting solvent systems to achieve the optimum resolution for separating and identifying AASs on TLC plates. The extract is first subjected to the elution by chloroform/acetone (9: 1), separating five AASs (19-nor androstenedione, 19-nortestosterone, stanozolol, oxymetholone, and oxandrolone). The other five AASs (methyl testosterone, clostebol, trenbolone enanthate, testosterone enanthate, and nandrolone decanoate) appear as two bands in this system. The plate is transferred to another chamber containing ethyl acetate/n-hexane (6.5: 3.5) to separate methyl testosterone, clostebol, and trenbolone enanthate, or cyclohexane/ethyl acetate/methanol (8: 2: 0.5) to separate testosterone enanthate and nandrolone decanoate.
To the best of our knowledge, the seperstion of nandrolone decanoate and testosterone enanthate on silica plates using the three elution systems, has not been reported anywhere else. The best elution system was a mixture of cyclohexane/ethyl acetate/methanol (8: 2: 0.5). To the best of our knowledge, no report has been published on separating these two compounds on silica plates so far.
Besides the explicitness of the method, the most important advantage of the HPTLC method for supplement screening is the possibility of running multiple samples (up to 10 samples) in one run. Furthermore, the costs of purchasing and maintaining this device are lower than LC-MS/MS. High-performance thin-layer chromatography is user-friendly and does not require an expert person.
4.1. Conclusions
A simple screening method for anabolic androgenic steroids in sports supplements was developed based on thin layer chromatography, which is a short, easy, cheap, and fast alternative to classic HPLC methods. The method could be adopted by food and drug control laboratories.
