Introduction
The most common malignant neoplasm of the head and neck regions is laryngeal cancer which
presents a significant international health problem. This type of cancer has high rate of
mortality because of the poor diagnosis in early stage of the disease. Despite favorable
treatment in early-stage laryngeal cancers, survival rates for advanced-stage disease are
less than 50%. Surgery and chemotherapy are two suitable treatment options that are used for
laryngeal cancer. However, their combination is also is used. Recently the number of
patients treated with radiotherapy and chemotherapy is increased (1). However, survival is decreased (2). Laryngeal cancer has been considered as a multifactorial disease associated
with the interaction between environmental factors and genetic background (3). Environmental factors of laryngeal cancer are
introduced as a lower consumption of vegetables and fruits, and higher consumption of milk,
eggs, meat, tea, alcohol, and smoking (4). Recently,
various studies have established the changes in molecular level which are associated with
the development of laryngeal cancer. For example, several studies have investigated
associations between CYP1A polymorphisms and laryngeal cancer risk (5). Alcohol consumption or smoking beside the uridine diphosphate
glucuronosyl transferase enzyme (UGTs) rs4148323 act synergistically to increase the risk of
laryngeal cancer (6). It has also reported the
relationship between this type of cancer and nucleotide excision repair pathway genes such
as ERCCs and XPA (7). The proteomics studies on
laryngeal cancer show that the changed expression proteins regulate cellular proliferation,
differentiation, and apoptosis that may directly related to the pathogenesis of cancer
(8). Another one reported that some significantly
changed expression proteins were the products of oncogenes and others were related to signal
transduction and immune defense (9). Deeb A and
colleagues showed that related DNA repair pathways are curtail in larynx cancer patients
(10). For better understanding of molecular
mechanisms of laryngeal cancer pathogenesis, protein-protein interaction (PPI) network
analysis can provide an informative concept and detail schema (11-20). Therefore, we used a
systems biology approach (based on the available proteomics literature data) as a rational
strategy to reveal novel specific markers and probably therapeutic targets for laryngeal
cancer.
Experimental
Data collection
In this study, the inclusion criteria were the studies on the human species using cell line
and laryngeal squamous tissue samples involved in the comparison between the tumor and
normal tissues. Exclusion criteria were the studies on non-human tissue and studies on
samples of biological fluids, including plasma, serum, saliva, and urine. Studies only
involved in comparison between the tumor tissue and tumor metastasis one. There was no
limitation in methods in proteomic studies. We manually evaluated the publications in line
with the above conditions; a total of 275 significantly changed expression proteinsextracted
of which 136 proteins belong to up regulated protein group and 139 proteins were as down
regulated proteins (See Tables 1 and 2).
Table 1The list of up-regulated genes in tissue of human laryngeal cancer
| NO. | Gene name | NO. | Gene name | NO. | Gene name | NO. | Gene name |
|---|---|---|---|---|---|---|---|
| 1 | ACAA1 | 35 | EEF1D | 69 | HSPD1 | 103 | PSMD2 |
| 2 | ACTR2 | 36 | EEF1G | 70 | IDH1 | 104 | RAB2A |
| 3 | AKR1C2 | 37 | EEF2 | 71 | IMPDH2 | 105 | RAP1B |
| 4 | ALB | 38 | EIF2S1 | 72 | ISOC2 | 106 | RPL14 |
| 5 | ALDH3A1 | 39 | EIF3F | 73 | KPNB1 | 107 | RPL6 |
| 6 | ANXA11 | 40 | EIF3H | 74 | LAP3 | 108 | RPS15A |
| 7 | ARHGAP1 | 41 | EIF3I | 75 | LCP1 | 109 | S100A16 |
| 8 | ARHGDIA | 42 | EIF4A1 | 76 | LDHB | 110 | S100A8 |
| 9 | ARHGDIB | 43 | EIF5A | 77 | LGALS7 | 111 | S100A9 |
| 10 | ARL1 | 44 | ENO1 | 78 | LTA4H | 112 | SERPINB3 |
| 11 | ARPC4 | 45 | EPPK1 | 79 | MAPRE1 | 113 | SF3A3 |
| 12 | ATIC | 46 | EPS8L1 | 80 | METAP1 | 114 | SFPQ |
| 13 | ATP6V1A | 47 | ERO1L | 81 | MPO | 115 | SND1 |
| 14 | BLVRB | 48 | FABP5 | 82 | MYL6 | 116 | STAT1 |
| 15 | C1QBP | 49 | FBP1 | 83 | NAP1L1 | 117 | TACSTD2 |
| 16 | CA2 | 50 | FLOT1 | 84 | NCL | 118 | TAGLN2 |
| 17 | CAND1 | 51 | FN1 | 85 | NDRG1 | 119 | TALDO1 |
| 18 | CAP1 | 52 | FSCN1 | 86 | NDUFA8 | 120 | TAPBP |
| 19 | CAPN2 | 53 | FTL | 87 | NP | 121 | TF |
| 20 | CAPNS1 | 54 | FUS | 88 | PABPC1 | 122 | TFRC |
| 21 | CCT6A | 55 | G3BP2 | 89 | PDIA4 | 123 | TKT |
| 22 | CCT7 | 56 | G6PD | 90 | PDXK | 124 | TLN1 |
| 23 | CDC37 | 57 | GAPDH | 91 | PFN1 | 125 | TPI1 |
| 24 | CES1 | 58 | GCN1L1 | 92 | PGAM1 | 126 | TPT1 |
| 25 | CFL1 | 59 | GFAP | 93 | PGK1 | 127 | TRAP1 |
| 26 | CLIC1 | 60 | GNAI2 | 94 | PGM1 | 128 | TXNDC5 |
| 27 | CMPK1 | 61 | GSTP1 | 95 | PLEC1 | 129 | TYMP |
| 28 | COL12A1 | 62 | HADHA | 96 | PLS3 | 130 | USP14 |
| 29 | CPSF6 | 63 | HIST1H1B | 97 | PPA1 | 131 | VASP |
| 30 | CTSB | 64 | HMGA1 | 98 | PPP2R1A | 132 | VCL |
| 31 | CTSC | 65 | HNRNPA1 | 99 | PRKRA | 133 | WARS |
| 32 | CYCS | 66 | HNRNPD | 100 | PRTN3 | 134 | WDR1 |
| 33 | DHX9 | 67 | HNRPDL | 101 | PSMD11 | 135 | XRCC5 |
| 34 | ECH1 | 68 | HSP90B1 | 102 | PSMD13 | 136 | YWHAZ |
Table 2The list of down-regulated genes in tissue of human laryngeal cancer
| NO. | Gene name | NO. | Gene name | NO. | Gene name | NO. | Gene name | NO. | Gene name |
|---|---|---|---|---|---|---|---|---|---|
| 1 | A1BG | 29 | CORO1A | 57 | HIST1H1C | 85 | MYH11 | 113 | RPS11 |
| 2 | A2M | 30 | CORO1C | 58 | HNRNPL | 86 | MYH7 | 114 | RPS15 |
| 3 | ABHD14B | 31 | CRYAB | 59 | HP | 87 | MYL2 | 115 | RPS9 |
| 4 | ACADVL | 32 | CSTB | 60 | HSDL2 | 88 | MYLPF | 116 | RRBP1 |
| 5 | ACAT1 | 33 | CTNND1 | 61 | HSP90 | 89 | NDRG2 | 117 | SDHA |
| 6 | ACTG1 | 34 | CYB5R3 | 62 | HSPB1 | 90 | NDUFA10 | 118 | SERPINA1 |
| 7 | AGR2 | 35 | DCN | 63 | HSPG2 | 91 | NDUFA12 | 119 | SFN |
| 8 | AK3 | 36 | DDOST | 64 | IARS2 | 92 | NDUFS2 | 120 | SLC4A1 |
| 9 | ALDH2 | 37 | DLD | 65 | IGHA1 | 93 | OGDH | 121 | SOD1 |
| 10 | ANXA2 | 38 | DYNLL1 | 66 | IGHG1 | 94 | OGN | 122 | SOD3 |
| 11 | APOA1 | 39 | ECHS1 | 67 | IGKC | 95 | ORM1 | 123 | SP140 |
| 12 | APOA2 | 40 | EIF3A | 68 | IMMT | 96 | ORM2 | 124 | SPTAN1 |
| 13 | ASPN | 41 | EPHX1 | 69 | ITIH2 | 97 | PA2G4 | 125 | SPTBN1 |
| 14 | ATP5B | 42 | ERP29 | 70 | JUP | 98 | PCYOX1 | 126 | SSR4 |
| 15 | ATP5D | 43 | EVPL | 71 | KRT19 | 99 | PHB | 127 | TGFBI |
| 16 | ATP5F1 | 44 | F13A1 | 72 | LAMC1 | 100 | PHB2 | 128 | TMED10 |
| 17 | ATP5O | 45 | FAU | 73 | LGALS3 | 101 | PRDX3 | 129 | TNNT3 |
| 18 | BGN | 46 | FGB | 74 | LGALS3BP | 102 | PRELP | 130 | TPM1 |
| 19 | C1QC | 47 | FGG | 75 | LMAN1 | 103 | PSMB1 | 131 | TRIM29 |
| 20 | C3 | 48 | FKBP4 | 76 | LMAN2 | 104 | PSME2 | 132 | TROVE2 |
| 21 | CALM1 | 49 | GGT5 | 77 | LMNA | 105 | PYCR1 | 133 | U2AF1 |
| 22 | CALML3 | 50 | GLUD1 | 78 | LMNB1 | 106 | PYGB | 134 | UNC84B |
| 23 | CANX | 51 | GOT2 | 79 | LRP1 | 107 | RAN | 135 | UQCRB |
| 24 | CFH | 52 | GPD2 | 80 | LTF | 108 | RPL10 | 136 | UQCRC1 |
| 25 | CFL1 | 53 | GRP94 | 81 | LUM | 109 | RPL19 | 137 | UQCRC2 |
| 26 | CKM | 54 | GSN | 82 | LYZ | 110 | RPL23A | 138 | VDAC1 |
| 27 | CKMT1A | 55 | GSTP1 | 83 | MARCKS | 111 | RPL9 | 139 | VDAC2 |
| 28 | COL15A1 | 56 | H2AFY | 84 | MTPN | 112 | RPN1 |
Table 3Presentation of the hub proteins in the up-regulated and down-regulated protein–protein
interaction networks of laryngeal cancer (top 20 in each PPI network). The hub nodes
that play as bottleneck node are asterisked (for more details see Table 4 and
discussion
| ID | Degree | ID | Degree | ID | Degree | ID | Degree | |
|---|---|---|---|---|---|---|---|---|
| Up regulated | YWHAZ* | 1634 | CAND1* | 827 | PSMD2* | 636 | ALB* | 524 |
| FN1* | 1538 | PABPC1 | 725 | FUS* | 631 | NCL | 508 | |
| PPP2R1A* | 1208 | MAPRE1* | 716 | KPNB1* | 618 | STAT1* | 503 | |
| CDC37* | 1158 | HNRNPD* | 703 | DHX9 | 554 | ACTR2* | 492 | |
| HNRNPA1* | 1054 | XRCC5* | 661 | EEF1G | 538 | CCT7 | 471 | |
| Down regulated | HSP90AA1* | 2019 | ACTG1* | 681 | RPL23A | 449 | LMNA* | 407 |
| CALM3* | 1276 | P31947 | 569 | CANX* | 427 | Q13813 | 390 | |
| HSPB1* | 1038 | RPL9P9 | 484 | P20618 | 424 | PHB2 | 364 | |
| RPL10* | 992 | RAN* | 479 | EIF3A | 412 | HNRNPL* | 351 | |
| DYNLL1* | 792 | RPS9 | 450 | IGHG1* | 411 | U2AF1 | 348 |
Table 4The list of top 20 up-regulated and down-regulated genes ranked based on BC from
largest to smallest values
| ID | BC | ID | BC | ID | BC | ID | BC | |
|---|---|---|---|---|---|---|---|---|
| Up regulated | PDXK | 1.0 | HNRNPA1 | 0.07400 | FUS | 0.04727 | PSMD2 | 0.03599 |
| KHC | 1.0 | CDC37 | 0.06998 | ENO1 | 0.04595 | ALB | 0.03178 | |
| YWHAZ | 0.13462 | GNAI2 | 0.06835 | HNRNPD | 0.03861 | HSPD1 | 0.03167 | |
| FN1 | 0.13420 | PPP2R1A | 0.06310 | ACTR2 | 0.03749 | XRCC5 | 0.03007 | |
| CAND1 | 0.07829 | MAPRE1 | 0.04832 | KPNB1 | 0.03667 | STAT1 | 0.02821 | |
| Down regulated | HSP90AA1 | 0.20507 | DYNLL1 | 0.06243 | LGALS3 | 0.04051 | APOA1 | 0.02707 |
| CALM3 | 0.13699 | C3 | 0.06131 | A2M | 0.03737 | IGHG1 | 0.02688 | |
| HSPB1 | 0.07676 | CANX | 0.05931 | RAN | 0.03283 | SOD1 | 0.02663 | |
| ACTG1 | 0.07472 | SFN | 0.04720 | FN1 | 0.03122 | HNRNPL | 0.02442 | |
| RPL10 | 0.06626 | LMNA | 0.04078 | PSMB1 | 0.02739 | LGALS3BP | 0.02210 |
Table 5The modules of up regulated and down regulated PPI networks of human tissue of
laryngeal cancer. The asterisked proteins are hub-bottleneck nodes
| Category | MCODE score, nodes and edges | Seed | Hub | |
|---|---|---|---|---|
| Up regulated | Up-1 | 7.6, 65 and 358 | NPM1 | HNRNPD*, DHX9, FUS*, NCL and YWHAZ* |
| Up-2 | 5.8, 65 and 320 | HSPA9 | KPNB1*, XRCC5* and CAND1* | |
| Up-3 | 4.0, 52 and 219 | NS | PPP2R1A* | |
| Up-4 | 3.8, 49 and 115 | ---- | HNRNPA1* | |
| Up-5 | 3.3, 13 and 44 | ---- | ACTR2 | |
| Down regulated | Down-1 | 5.87, 65 and 219 | UQCRC1 | ---- |
| Down-2 | 4.06 , 30 and 80 | ---- | RPL9P9 ,DYNLL1* | |
| Down-3 | 4.0 , 15 and 43 | ---- | ---- | |
| Down-4 | 4.0 , 10 and 30 | ---- | CALM3* | |
| Down-5 | 4.0 , 18 and 80 | ---- | ACTG1* , HSP90AA1* | |
| Down-6 | 3.25, 17 and 42 | ---- | PHB2, U2AF1 |
Table 6GO functional enrichment analysis of up- regulated and down-regulated PPI network
modules. Top three terms of each module are tabulated
| Category | Term | Description | |
|---|---|---|---|
| Up regulated | Up-1 | GO:0006396 | RNA processing |
| GO:0000380 | Alternative mRNA splicing | ||
| GO:0071826 | Ribonucleoprotein complex subunit organization | ||
| Up-2 | GO:0000082 | G1/S transition of mitotic cell cycle | |
| GO:0042769 | DNA damage response | ||
| GO:1901992 | Positive regulation of mitotic cell cycle phase transition | ||
| Up-3 | GO:0031398 | Positive regulation of ubiquitination | |
| GO:0046364 | Monosaccharide biosynthetic process | ||
| GO:0006098 | Pentose-phosphate shut | ||
| Up-4 | GO:0008380 | RNA splicing | |
| GO:0022613 | Ribonucleoprotein complex biogenesis | ||
| GO:0031123 | RNA 3 -end
processing | ||
| Down regulated | Down-1 | GO:0022904 | Respiratory electron transport chain |
| GO:0046034 | ATP metabolic process | ||
| GO:1902600 | Hydrogen transmembrane transport | ||
| Down-2 | GO:1900739 | Regulation of protein insertion into mitochondrial membrane involved in apoptotic signaling pathway | |
| GO:0031110 | Regulation of microtubule (de) polymerization | ||
| GO:0016259 | Selenocystein metabolic process | ||
| Down-3 | GO:0010257 | NADH dehydrogenase complex assembly | |
| GO:0006099 | Tricarboxylic acid cycle |
PPI network analysis
PPI network analyzed by Cytoscape Version 3.4 and Betweenness centrality (BC) and node
degree the two major centrality parameters were analyzed by using a Cytoscape plug-in called
‘Network Analyzer’ (21). Degree indicates the number
of connectivity belongs to a node and nodes having high degree were introduced as hub
proteins. BC value the other centrality index reflects the shortest paths that pass through
a node (22).
Screening of network modules and functional analysis
The modules of the two constructed networks (including up and down regulated networks) were
provided by MCODE analysis and parameters including Node Score Cutoff: 0.2, K-Core: 2,
Degree Cutoff: 2 and, Max depth = 100 were used as the cut-off criteria for network module
screening. MCODE score > 3 and node > 6 were considered for functional enrichment
analysis of the modules. Kappa statistic ≥ 0.4 and Bonferroni step down method for
probability value correction were used for annotation analysis of the selected modules.
Results
After the submission of up-regulated and down-regulated proteins into Cytoscape, a total of
7312 and 6707 nodes related to the up-regulated and down-regulated proteins are included in
the networks, respectively. In the final networks (Figures
1 and 2), the node›s degree was organized
based on size; the nodes with high degree have bigger size and the blue to brown color
represented low to high BC values for each node. \ The nodes with high degree were
considered as key proteins. Then, the top 20 proteins with highest connectivity were
identified as the hub proteins for each of the networks and similarly, the top 20 proteins
based on betweenness centrality value were selected as bottleneck proteins (See Tables 3 and 4).
Module analysis
A total of 11 modules including 5 up-regulated and 6 down-regulated network modules were
obtained using default criteria. It was selected modules with MCODE score > 3 and node
> 6. Five up-regulated modules (Up, 1-5) (Figure 3),
and six down-regulated modules (Down, 1-6) (Figure 4)
were selected for enrichment analysis.
There were some key proteins (hubs) in total of 5 up-regulated modules and 3 up-regulated
network modules among them have 3 seed proteins (see Table
5). While, in down-regulated network modules, only Down-1 module has seed. The hubs
in this network are distributed as tabulated data in Table
5.
Functional enrichment analysis for modules
Four up-regulated modules (Up, 1-4) and three down-regulated modules (Down, 1-3) were
enriched based on functional annotation. The top three GO terms for each module are shown in
Table 6.
Discussion
Protein-protein interaction (PPI) network analysis has a significant growth in cancer
studies to facilitate introducing early stage biomarkers (23). In our study, the laryngeal cancer related proteins were analyzed via PPI
network construction, hub gene identification, module analysis, and functional enrichment
analysis of most significant modules. These stages were carried out for up-regulated
proteins and down-regulated ones in human laryngeal cancer tissue, separately. As it is
shown in Tables 1 and 2, there are 275 changed expression proteins (including up and down regulated
proteins) related to the human tissue of laryngeal cancer. Data management and analysis is a
difficult process due to huge numbers of the collected proteins. Since PPI network analysis
is a powerful method in categorization and ranking of the candidate and related proteins for
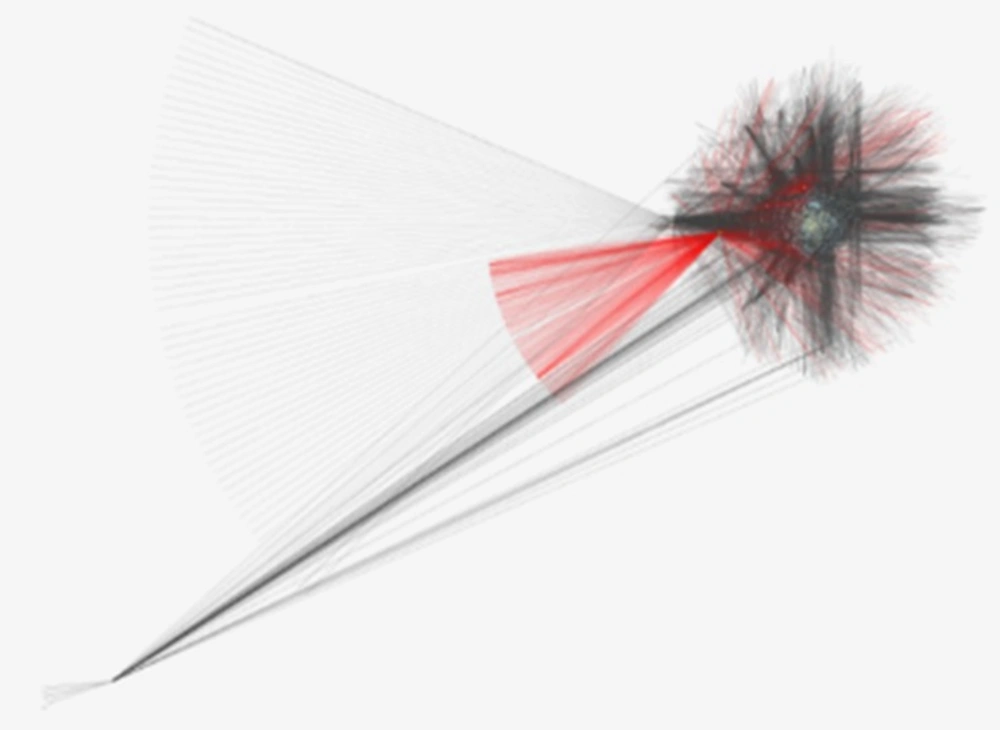
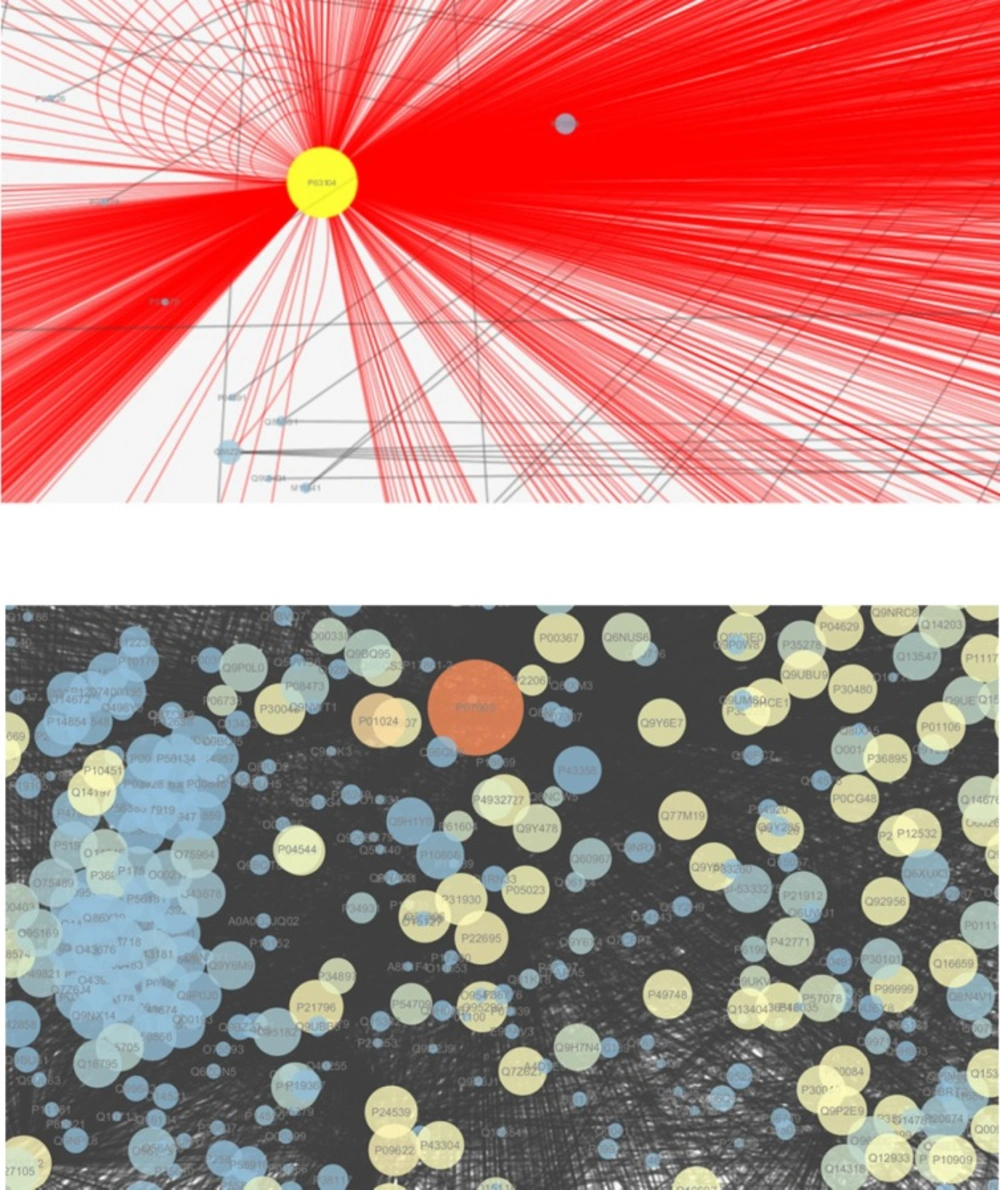
a certain disease, here the up and down regulated networks are constructed separately (Figures 1 and 2).
Topological analysis of the networks lead to rank of the nodes based on networks properties
(18). By using two centrality indices including
degree and betweenness, totally 80 nodes are selected among 275 initial proteins as
important proteins (see Tables 3 and 4). However, the number of 80 nodes can not be considered
as a suitable biomarker panel related to laryngeal cancer and more screening is required.
The hub-bottleneck nodes for the up and down regulated networks are shown in Table 3. As it is shown in this Table there are 15 and 11
hub-bottlenecks for up and down regulated networks respectively. Module is a part of a
network including closed related proteins havig specific biological function (20). Determined modules of network can provide
informative perspective about different roles of the nodes (
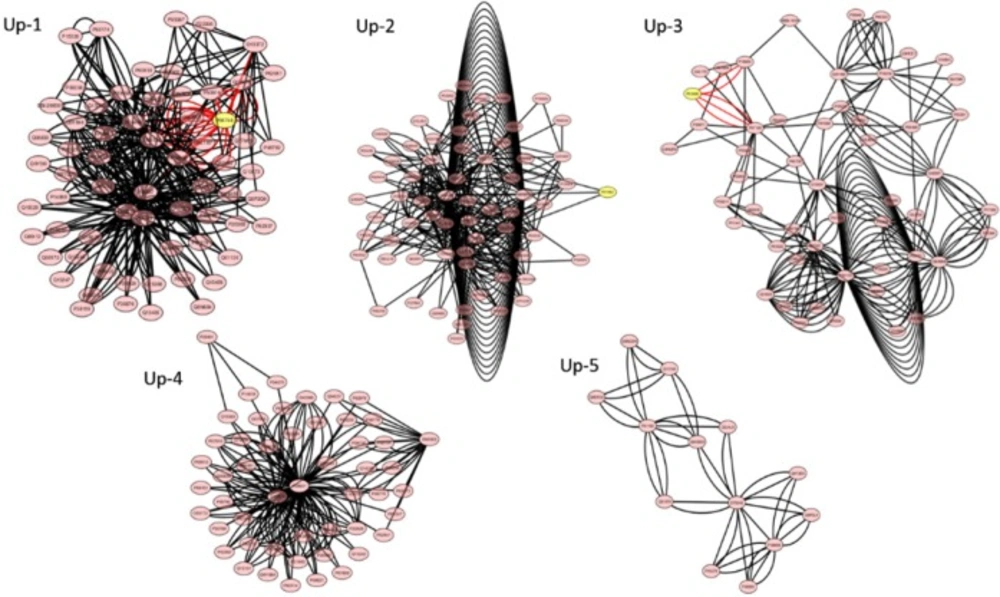
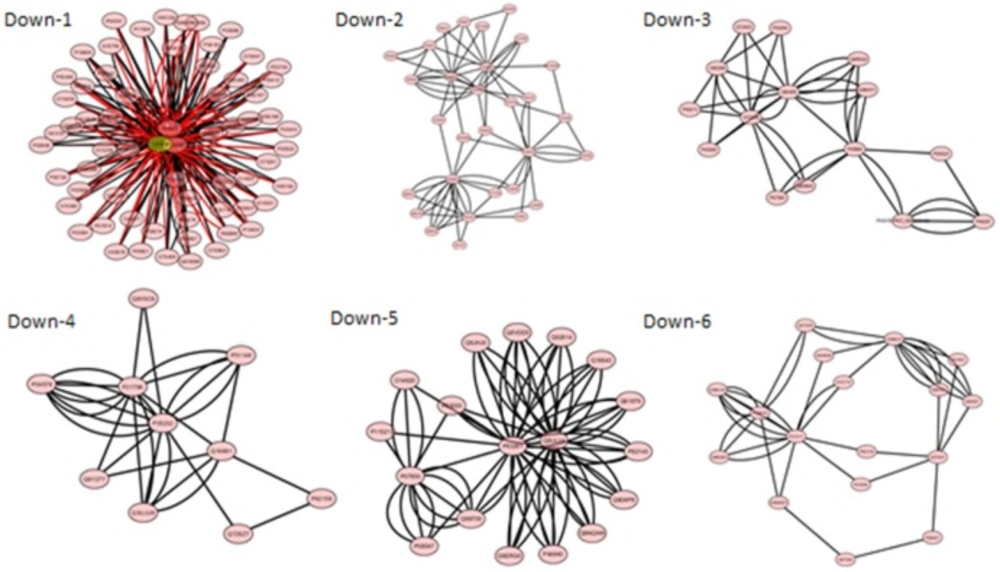
24). As it is shown in Figures 3 and 4 and
Table 5 there are 5 and 6 modules for the up and
down regulated networks respectively. Functional enrichment analysis for top score modules
indicated that RNA processing and splicing, mitotic cell cycle regulation and sugar
biosynthesis are affected by up-regulated modules while metabolic pathways and mitochondria
are the main affected subjects by down regulated modules (see Table 6). The most significant pathways in four modules Up, 1-4 were RNA
processing, G1/S transition mitotic cell cycle, protein ubiquitination and RNA splicing. It
has been revealed overlapping between important pathways involved in the conversion of
pre-mRNA to mature mRNA. In previous studies, it shows that polymorphisms of mRNA processing
genes can be considered as risk factors for development of laryngeal cancer (25). The most significant pathways in down regulated
modules (Down, 1-3) were respiratory electron transport chain, regulation of protein
insertion in to mitochondrial membrane involved in apoptotic signaling pathway, and NADH
dehydrogenase complex assembly. Proliferating cancer cells, such as laryngeal cancer,
preferentially use anaerobic glycolysis rather than oxidative phosphorylation for energy
production (26). In one system biology study, the
glycolysis/gluconeogenesis pathway has been introduced as the most important pathway in
laryngeal cancer (27). Then, the production of energy
from mitochondrial respiratory may shift to glycolysis in laryngeal cancer. To prove this
hypothesis and determine the energy supply sources of laryngeal cancer cells, more studies
are needed. Regulation of protein insertion into mitochondrial membrane involved in
apoptotic signaling pathway is the other important pathway in down regulated modules. One of
the mechanisms impaired cancer cells is apoptosis. Apoptosis can be activated through
several different signaling pathways, but a part of this mechanism is controlled in
mitochondrial membrane through insertion apoptotic proteins (28). According to these results, in laryngeal cancer, apoptotic mechanism may
disturb through the impairment of transporter proteins which transform apoptotic proteins
into mitochondria. According the results of Table 5,
the scattering of hubs in up-modules was more than down ones. Interestingly, the finding
indicate that the seeds and hubs in up-modules have the similar functions with each other
that are associated with regulation of cell cycle (29, 30). Among 26 hub-bottleneck nodes 12
proteins (8 up-regulated and 4 down-regulated proteins) are distributed in 8 modules (see
Table 5). These proteins are tabulated in
supplementary Table S1 and are ranked based on amounts of degree value. Here two suggestions
are feasible: first investigation about expression changes of these 12 genes in the field
and the second idea is selection of the top up and down regulated genes for more
examinations. We choose cutoff 1200 for degree and therefore YWHAZ and PPP2R1A as the top
two up-regulated genes and also HSP90AA1 and CALM3 as the top two down-regulated genes are
introduced as human laryngeal cancer. YWHAZ gene with the highest degree and BC scores
encodes 14-3-3 protein zeta/delta that has an essential role in tumor cell proliferation
(31) through the regulation of multiple cellular
processes, such as cell cycle control, anti-apoptosis, signal transduction, inflammation,
and cell adhesion/motility (32). YWHAZ has been
introduced as candidate proto-oncogene in head and neck squamous cell carcinoma whose
reduced expression causes lower level of DNA synthesis rates (33). 14-3-3 proteins could be a key regulatory components in many
processes that are crucial for development of cancers (34) such as laryngeal cancer (8). PPP2R1A
gene encodes one subunit of protein phosphatase 2. This protein phosphatase is involved in
control of cell growth and cell division processes. The role of this subunit in integrity of
enzyme is highlighted. Therefore, it is expected that PPP2R1A plays a crucial regulatory
role in cell proliferation in cancer cell line(35).
HSP90AA1 and CALM3 were found as two top ranked genes in the down-regulated PPI network.
These proteins belong to family of proteins which involved in the regulation of specific
target proteins in cell cycle control and programmed cell death (36, 37). On the other hand, CALMs
in addition to cell cycle, related to centrosome cycle and deregulation of this protein can
be the origin of chromosomal instability in cancer (38). Interestingly, all determined possible biomarkers are related to the cell
cycle process.
Conclusion
In this study, it has been represented a model of important proteins and pathways that
provide a new level of information for laryngeal cancer that increases our knowledge about
diagnostic and therapeutic aspects of this disease. Finally, a possible biomarker panel
including YWHAZ and PPP2R1A as the two up-regulated genes and HSP90AA1 and CALM3 as the two
down-regulated genes for human laryngeal cancer is introduced.


