1. Background
Acquired immune deficiency syndrome (AIDS), known as advanced HIV (human immunodeficiency virus) infection or late-stage HIV, is one of the world’s significant public health challenges. In line with the newest statistics, 79.3 and 36.3 million people have become infected with HIV and died from AIDS-related illnesses since the beginning of the epidemic, respectively (1). Appropriate treatment could lead to increased life expectancy and improved HIV-infected patients' quality of life (2).
Efavirenz (EZ) is a widely prescribed anti-HIV drug belonging to the non-nucleoside reverse transcriptase inhibitors, administered orally as a part of antiretroviral therapies (3). EZ is a BCS (Biopharmaceutics classification system) class II compound having very poor aqueous solubility and high permeability. The low water solubility of this drug hinders its oral absorption and bioavailability, which has been reported to be about 40% (4, 5).
The low intrinsic dissolution rate of EZ indicates its absorption to be dissolution rate-limited (6). Adequate absorption of the drug is essential for its effectiveness following oral administration. Drug solubility enhancement is a suitable way to overcome this problem. Various approaches have been investigated to increase the solubility, dissolution, and bioavailability of EZ as a poorly soluble compound, such as solid dispersion (7, 8), micronization and co-micronization (9, 10), cyclodextrin inclusion complex (6), liquisolid (11), and self-nanoemulsifying system (12).
Particle size reduction is one of the promising approaches widely used for formulating poorly aqueous soluble compounds. Nanonization, which is the production of nanosized particles, could increase the saturation solubility based on Ostwald–Freundlich's equation and the dissolution. All these factors could result in improved bioavailability (13).
Nanosuspension (NS) is the dispersion of nanosized drug particles in a liquid media stabilized by suitable stabilizers, including polymers and surfactants. Stabilizers could prevent the instability of NSs by inhibiting the aggregation and growth of particles (14). In addition to the improved drug dissolution and solubility, other advantages could be considered for NSs, such as high drug content, reproducible oral absorption, improved bioavailability, adhesion to the biological surfaces, reduced side effects, and improved patient compliance (14, 15).
Wet media milling, a well-accepted technique in the pharmaceutical industry, is widely applied to prepare NSs due to the simplicity of the production method, cost-effectiveness, and ease of scale-up. High drug loading and the absence of organic solvent are other beneficial advantages of this method (16).
Few studies have been conducted on preparing EZ nanosuspensions (EZ-NS). Nanoprecipitation (17, 18), precipitation-sonication (19, 20), HPH (21), and combination of precipitation and HPH (22) are the methods used in the literature. To our knowledge, only one investigation has been published on the development of EZ-NS using the milling technique (23). In this study, the optimal NS has been achieved using polyvinyl pyrrolidone as a steric stabilizer by milling for 22 h. One of the problems associated with wet milling methods is the possibility of product contamination following ball surface erosion due to the mixing forces in the milling chamber, which is more pronounced with high milling time and milling speed (24). Furthermore, elevated process time increases production costs. It was expected that using appropriate process and formulation parameters while reducing the production time could result in NSs with enhanced dissolution.
Design of experiment (DOE), as a mathematical modeling approach, is an efficient method to evaluate different factors simultaneously, study the interaction between variables, and optimize them in a minimum number of experimental runs (25). Box-Behnken is an efficient and useful experimental design with fewer experiments compared to central composite and full factorial designs (26). In addition, experiments under extreme conditions, which might lead to unsatisfactory results, are eliminated in the Box-Behnken design (27).
2. Objectives
The objective of the present study was to examine different milling conditions and formulation parameters to achieve appropriate EZ-NS in a shorter period of time. Various stabilizers were applied and screened along with the beads' size and weight in the preliminary studies. In the next step, we employed the Box-Behnken design as a well-established model to study the effect of selected variables on the targeted responses and to achieve the optimum formulation. Milling speed, milling time, and stabilizer concentration were the independent variables, and particle size and polydispersity index (PDI) were considered as the responses. The optimized formulation was characterized in terms of different physicochemical properties.
3. Methods
3.1. Materials
The raw efavirenz (EZ) was obtained from Shanghai Desano Chemical Pharmaceutical Co., Ltd. (China). Polyvinyl alcohol (PVA) with an average molecular weight of 30000 - 70000 and Pluronic F68 (poloxamer 188 (F68)) were supplied from Sigma-Aldrich (Germany). Sodium carboxymethylcellulose (CMC) was from ICN Biomedicals (USA). Hydroxypropyl methylcellulose (HPMC E5), mannitol, sodium lauryl sulfate (SLS), methanol, ethanol, and acetonitrile (HPLC grade) were purchased from Merck (Germany).
3.2. Preparation of Nanosuspensions
Nanosuspensions of EZ were prepared by the wet media milling method, a typical top-down approach, using a planetary ball mill (NARYA-MPM 2*250 H, Amin Asia Fanavar Pars Co., Iran). In the first step, the drug (50 mg) was dispersed in the aqueous solution of stabilizers by a magnetic stirrer at 600 rpm for 30 min. The obtained suspensions were subjected to wet milling process in a milling chamber containing zirconium oxide beads. Milling was performed at the specific milling speed for up to 3 h. To prevent sample overheating, each grinding cycle of 15 min was followed by 10 min break. Prepared NSs were separated from the grinding beads by sieving.
3.3. Preliminary Studies
Preliminary experiments were performed to determine the ideal process conditions and choose suitable stabilizers for the preparation of the EZ-NS by the wet milling method. The size of the beads (0.1 and 0.6 mm) and the weight of the milling media (4, 6, and 8 g) were the process parameters studied at this step. F68 (1%w/v) was used as a stabilizer in the above experiments.
Also, to select an appropriate polymeric stabilizer, F68, HPMC, CMC, and PVA were used as steric stabilizers with the concentrations of 1 and 0.25%w/v, except for CMC, which was studied at the concentrations of 0.25 and 0.5%w/v. After selecting a suitable polymer, SLS concentration as co-stabilizer (0.01 - 0.1%w/v) was also tested at this step to choose its appropriate amount in the preparation process.
Four different milling times (0.5, 1, 2, and 3 h) at the constant milling speed (400 rpm) were studied to prepare nanosuspensions at this step. All the above experiments were carried out using the one variable at a time (OVAT) approach, keeping others constant. The best size and weight of beads and the type of stabilizer, according to the particle size, were used to prepare and optimize EZ nanosuspensions based on experimental design.
3.4. Experimental Design
A three-factor, three-level Box-Behnken design was applied to study the effect of different variables on each response and find an optimized nanosuspension formulation with small and uniform particle size. Milling speed (A), milling time (B), and polymeric stabilizer concentration (C) were selected as independent variables, and the Zave (Y1) and PDI (Y2) were chosen as dependent factors (responses). The levels of each independent factor and their actual values used in the study are presented in Table 1. Seventeen experiments with different combinations were designed using Design Expert® software (Stat-Ease Inc., Minneapolis, MN, USA). After performing the experiments, the results were analyzed, and the significance of each term and model was tested by analysis of variance (ANOVA) at the probability level of 0.05.
| Independent Variables | Design Levels | ||
|---|---|---|---|
| Low (-1) | Medium (0) | High (+1) | |
| A: Milling speed (rpm) | 300 | 400 | 500 |
| B: Milling time (min) | 60 | 120 | 180 |
| C: Stabilizer concentration (% w/v) | 0.25 | 0.625 | 1 |
3.5. Freeze-drying of Nanosuspensions (FD-NS)
After the preparation of the optimized EZ nanosuspension, the freeze-drying process was performed to provide the long-term stability of the nanosuspension as well as to obtain highly dispersible dry nanoparticles. EZ-NS was freeze-dried at -55°C for 48 h using a laboratory-scale freeze dryer (Alpha 1 - 2 LD plus, Christ, Germany). After the completion of the drying process, the obtained solid mass (Freeze-drying of Nanosuspensions [FD-NS]) was stored in a desiccator for further experiments. Mannitol with the concentration of 5%w/v (28, 29) was previously added to the samples as a cryoprotectant to inhibit nanoparticles aggregation during the drying process.
3.6. Preparation of Physical Mixture
Physical mixture (PM) was prepared by mixing all the powders in the same proportion as the optimized nanosuspension. Finally, the physical mixture was passed through sieve no. 30.
3.7. Characterizations of the Optimal FD-NS
3.7.1. Determination of Particle Size and Zeta Potential
Zetasizer (Nano ZS, Malvern Instruments, UK) based on dynamic light scattering (DLS) was used to measure the Zave, PDI, and zeta potential (ZP) of the nanosuspensions. Fresh samples were appropriately diluted to yield the required scattering intensity before the analysis.
The particle size of the intact drug was determined by Malvern Mastersizer 2000 (UK) following dispersion in water and sonication (3 min) to create a homogenous suspension. D0.5 corresponding to the 50% of cumulative undersize particles and span (the width of the distribution) values were reported. All measurements were carried out in triplicate, and the results were expressed as mean ± standard deviation (SD).
3.7.2. Redispersibility Index
Redispersibility index (RDI) of solidified nanosuspension, as a quantitative measure of sample redispersibility, was evaluated according to the following equation (30):
where D represents the mean particle size of the redispersed suspension formed by the freeze-dried powder and D0 is the particle size of the freshly prepared nanosuspension before solidification. An RDI of near 1 means that the freeze-dried powder can completely be redispersed and recovered back to the original EZ-NS, following rehydration. For RDI measurement, approximately 5 mg of FD-NS was redispersed in 2 mL distilled water, sonicated for 3 min on the ultrasound bath (16), and analyzed for particle size as described above.
3.7.3. Differential Scanning Calorimetry
The thermal properties of EZ, stabilizer, FD-NS, and related physical mixture (PM) were analyzed using a differential scanning calorimetry (DSC) apparatus (DSC-60, Shimadzu, Japan). A sample of 5 mg was weighed and placed in sealed standard aluminum pans fitted with lids and heated from 25 to 160°C at a heating rate of 10°C/min with a nitrogen flow of 30 mL/min. An empty pan was used as a reference, and the instrument was calibrated using indium standard prior to analysis.
3.7.4. Fourier Transform Infrared Spectroscopy
The molecular structures of unprocessed materials and prepared formulations were studied using fourier-transform infrared (FTIR) spectroscopy (Agilent Technologies, CARY 630, USA). The samples were well mixed with potassium bromide in a mortar, and the FTIR spectrum was recorded in the range of 400 to 4000 cm-1.
3.7.5. X-ray Diffraction
Crystalline properties of the samples were evaluated using a PANalytical X’pert Pro MPD (The Netherlands) X-ray diffractometer. X-ray diffraction (XRD) studies were carried out using CuKα radiation at the wavelength of 1.5405 A°, generated at a voltage of 40 kV, and a current of 40 mA. The scanning range was 4 - 40° of 2θ values at the scan rate of 1°/min.
3.7.6. Field Emission Scanning Electron Microscopy
The morphological properties of EZ and FD-NS were evaluated by field emission scanning electron microscopy (FE-SEM) (Tescan Mira 3, Czech Republic) operating at 30 kV. Before observation, the samples were placed on a metal stub and coated with gold by a sputter coater.
3.7.7. Solubility Study
Saturation solubility of EZ, FD-NS, and PM was evaluated in deionized water at 25 ± 0.5°C. An excess amount of each sample was dispersed in 5 mL of medium and stirred for 48 h to ensure that the solubility equilibrium had been reached. The samples were subjected to ultracentrifugation at a speed of 30,000 rpm for 20 min (Optima XPN, Beckman Coulter, Inc, USA), and supernatants were collected. Quantification of the diluted samples was carried out spectrophotometrically at 247 nm. The reported values represent the average of three measurements.
3.7.8. Dissolution Studies
Dissolution experiments were carried out using the USP Type-II (paddle) apparatus with a stirring rate of 50 rpm. SLS aqueous solution (0.1%w/v) was selected as dissolution media (20). A temperature of 37 ± 0.5°C was maintained throughout the experiment. Accurately weighed samples equivalent to 25 mg of the drug were dispersed in 500 mL of the dissolution medium. Sampling was carried out at predetermined time intervals and immediately replaced with an equal volume of pre-heated fresh medium. Then, samples were passed through a 0.1-µm PTFE syringe filter and analyzed by a UV spectrophotometer (UVmini-1240, Shimadzu, Japan) at 247 nm. The same procedure was also employed to study the dissolution of the samples in the phosphate buffer solution (pH = 6.8) containing 0.1% SLS.
3.7.9. Dissolution Data Analysis
The dissolution performance of the intact drug and the prepared samples were quantified and compared using different parameters. The mean percentage of the drug dissolved in 30 min (Q30) was used to compare various formulations.
Dissolution efficiency (DE) is the area under the dissolution curve up to the time t, expressed as the percentage of the area at maximum dissolution at the same time (31). DE at 60 (DE60) and 120 min (DE120) were calculated based on the below equation where Y is the percent of drug dissolved at time t (32):
The mean dissolution rate (MDR) for 60 min was calculated according to the following equation:
where n represents the number of dissolution sample times, ∆t is the time at the midpoint between t and t-1, and ∆Mj is the additional amount of drug dissolved between t and t-1 (33).
3.7.10. Drug Content
The drug content of the dried nanosuspension was determined by high-performance liquid chromatography (HPLC) (Smartline 1000 pump, Knauer, Germany) at room temperature (34). Chromatography was performed on a C18 ODS column (4.6 × 250 mm, 5 µm particle size) using a mixture of acetonitrile: Methanol: Water (30:45:25), adjusted to pH 3.5 with orthophosphoric acid 85%, as the mobile phase. The flow rate was 1 mL/min, and detection was accomplished with a Smartline 2500 UV detector at 247 nm. The run time was set for 10 min and the retention time was 5.8 min. Good linearity was obtained over the 1-10 µg/mL concentration range. The detection limit (LOD) and limit of quantitation (LOQ) values were found to be 0.059 µg/mL and 0.18 µg/mL, respectively. The FD-NS was analyzed by dispersing a weight equivalent to 5 mg of the drug in methanol, followed by sonication and filtration through 0.1 µm filter. Each determination was performed in triplicate, and the mean ± SD was calculated.
3.7.11. Stability Study
Stability studies were conducted to determine the effect of aging on the properties of the drug in the formulation. The optimized EZ dried nanosuspension (FD-NS) was stored in a screw-cap container at 40°C and relative humidity of 75% for three months. Particle size, dissolution, and drug content were evaluated after 1 and 3 months of storage.
4. Results
4.1. Preliminary Studies
In order to select suitable conditions for EZ nanosuspension preparation, the effect of different parameters on the particle size and distribution of the prepared formulations were studied preliminarily.
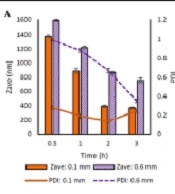
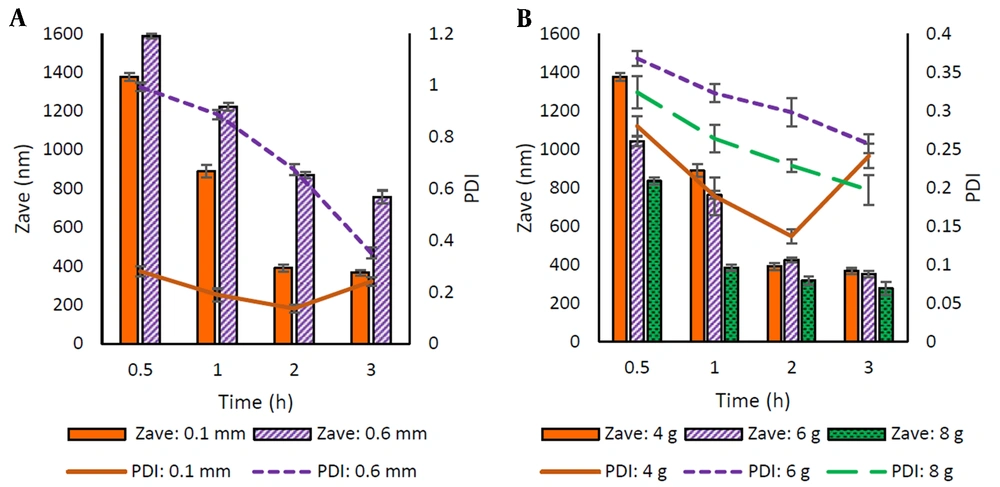
Selecting a suitable bead size and other process parameters could reduce the milling time, energy consumption, and costs to obtain the desired particle size (35). Two different sizes (0.1 mm and 0.6 mm diameter) of beads were taken for the study. Figure 1A shows the Zave and PDI of the prepared particles. Using 0.1 mm diameter beads resulted in a smaller size of particles with a more homogenous size distribution (PDI < 0.3).
The beads amount has a remarkable effect on the particle size. Therefore, the milling process was carried out by taking three different amounts of milling beads (4, 6, and 8 g). The particle size of prepared nanosuspensions is shown in Figure 1B. The best particle size and PDI results were obtained using higher amounts of the beads.
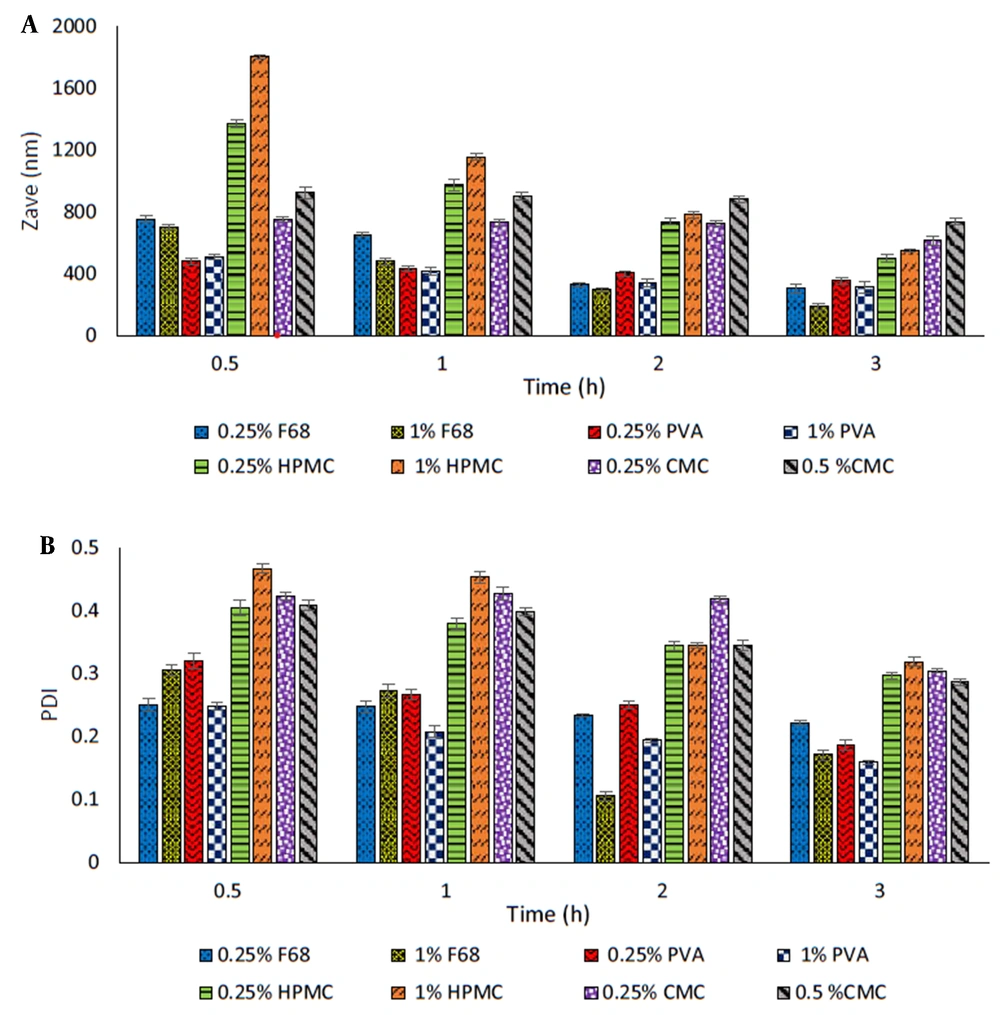
The selection of a suitable stabilizer in the wet milling technique is a critical factor in the preparation and stability of nanosuspension. In the present study, commonly used polymers, including F68, HPMC, CMC, and PVA, were used as steric stabilizers, and the obtained formulations were studied in terms of particle size (Zave) and PDI (Figure 2A-B).
Among all stabilizers studied, the particles prepared in the presence of HPMC and CMC showed larger sizes. Furthermore, an increasing trend in particle size was observed with increasing polymer concentration (Figure 2A). The smallest particle size (498 and 614 nm, respectively) was obtained after 3 h of milling using 0.25% of these polymers in the medium.
PVA and F68 proved to be more efficient in reducing the particle size (311 - 510 nm and 188 - 754 nm, respectively) along with particle size distribution (PDI ≤ 0.3) at both concentrations employed. Increasing F68 concentration resulted in significantly reduced particle size (P < 0.05). In the case of PVA, the increase in concentration, except for the sample milled for 30 min, was associated with a relative decrease in Zave as the milling time was increased, which was statistically significant after 2 h of milling (P < 0.05).
For more precise selection of stabilizers, formulations containing each of the latter polymers were kept at 25°C for one week and then examined for their particle size. The results showed that nanosuspensions prepared with F68 became aggregated, indicating the physical instability of these formulations over time. Nanosuspensions containing PVA were more stable than those containing F68; however, an increase in the particle size for both concentrations raised the possibility of Ostwald-ripening during storage. Due to the better effect of PVA on the stability of nanosuspensions compared to F68, it was used as a steric stabilizer in the subsequent experiments.
PVA-stabilized nanosuspensions were evaluated for ZP, which was found to be insufficient (-11.3 mV and -14.3 mV for 0.25% and 1% PVA-stabilized NSs, respectively). In order to improve the nanosuspensions stability, SLS (anionic surfactant) is suggested to generate electrostatic repulsion (36). Various amounts of SLS were added to a specific EZ-NS containing PVA (1%) and milled for 3 h. The results of the particle size and ZP of the prepared NSs are presented in Appendix 1 in Supplementary File.
Accordingly, the appropriate concentration of SLS in the EZ-NS formulations was selected as 0.05% to create particles with an acceptable ZP (-22.9 mV) and suitable particle size (329 ± 2.8 nm). The Zave of this sample after keeping at 25°C for one week was equal to 337.4 ± 8.1 nm, indicating its acceptable stability during storage.
4.2. Experimental Design
To investigate the possibility of achieving smaller particles, the effect of three different process and formulation parameters, including milling speed (A), milling time (B), and stabilizer concentration (C), on the quality of EZ nanosuspensions were evaluated using experimental design methodology. Based on the preliminary experiments and previous studies (37), these are among the main parameters that could influence the particle size of NSs.
In order to study the interaction between those parameters, Box–Behnken design was applied, considering the mean particle size (Zave, Y1) and PDI (Y2) as dependent variables (responses). The desirability in this part was to formulate EZ-NSs with smaller particle sizes and lower PDI. All formulations included SLS (0.05%) and were prepared using 8 g beads with the size of 0.1 mm. All 17 experimental runs of Box–Behnken design and the obtained responses are presented in Table 2. In order to increase the predictability of the model, experiments were conducted in random order.
| Run No. | Factor A | Factor B | Factor C | Responses | |
|---|---|---|---|---|---|
| Milling Speed (rpm) | Milling Time (min) | PVA Concentration (% w/v) | Y1: Zave (nm) | Y2: PDI | |
| 1 | 300 | 60 | 0.625 | 690.3 | 0.536 |
| 2 | 500 | 60 | 0.625 | 356.9 | 0.220 |
| 3 | 400 | 120 | 0.625 | 359.1 | 0.357 |
| 4 | 300 | 120 | 0.25 | 621.4 | 0.279 |
| 5 | 500 | 120 | 1 | 386.3 | 0.184 |
| 6 | 400 | 120 | 0.625 | 252.6 | 0.471 |
| 7 | 300 | 120 | 1 | 427.8 | 0.602 |
| 8 | 400 | 120 | 0.625 | 334.5 | 0.284 |
| 9 | 400 | 120 | 0.625 | 381.5 | 0.297 |
| 10 | 500 | 180 | 0.625 | 685.1 | 0.195 |
| 11 | 400 | 120 | 0.625 | 258.2 | 0.248 |
| 12 | 400 | 180 | 0.25 | 353.9 | 0.089 |
| 13 | 400 | 60 | 0.25 | 435.9 | 0.153 |
| 14 | 400 | 60 | 1 | 251.2 | 0.216 |
| 15 | 400 | 180 | 1 | 322.6 | 0.236 |
| 16 | 500 | 120 | 0.25 | 698.5 | 0.407 |
| 17 | 300 | 180 | 0.625 | 344.9 | 0.248 |
The values of particle size and PDI were in the ranges of 251.2 - 698.5 nm and 0.089 - 0.602, respectively. The ratio of maximum to minimum values of these responses was equal to 2.78 for Zave and 6.76 for PDI, indicating no power transformation of responses was required. Transformation of the responses is important for data analysis and is necessary when the ratio of maximum to minimum response is greater than 10 (38).
Multiple linear regression analysis was carried out to generate different polynomial models. For analyzing the responses, the model selection was made based on different parameters, including high R-squared, low predicted residual error sum of square (PRESS) values, and insignificant lack of fit test. The significant terms of the model were identified using analysis of variance (ANOVA).
Model summary statistics, represented in Appendix 2 in Supplementary File, suggested the quadratic model for both responses (Y1 and Y2) due to the higher adjusted and predicted R-squared and low PRESS values. The adequate precision, which measures the signal-to-noise ratio, was obtained 10.46 and 9.38 for Zave (Y1) and PDI (Y2), respectively. The values greater than 4 indicated an adequate signal, and the model could be used to navigate the design space. Lack of fit was insignificant for both responses (P > 0.05), indicating that the model fits the data well.
4.2.1. Effect of the Variables on Zave
The significance of the effect of each variable and their interactions on the responses could be determined by ANOVA analysis (Appendix 3 in Supplementary File).
The following polynomial model equation was obtained to describe the quantitative effect of the variables and their interactions on the response Y1 (Zave) in terms of coded factors:
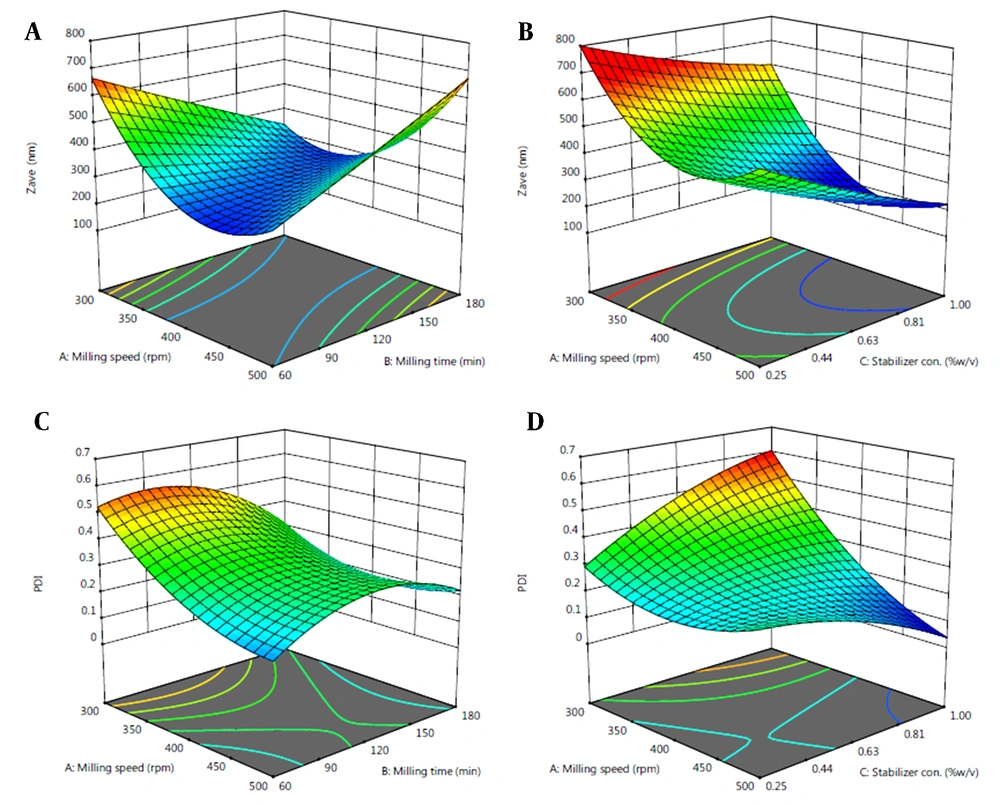
The negative coefficient of C in the model refers to reduced Zave at a higher level of PVA concentration. On the other hand, positive coefficients of AB and A2 indicate the increased Zave with increasing the respective factors. Response surface plots were used for better evaluation of the effect of variables (Figure 3).
4.2.2. Effect of the Variables on PDI
The details of ANOVA for PDI are represented in Appendix 4 in Supplementary File. The quantitative effect of the variables and their interactions on the response Y2 (PDI) in terms of coded factors could be described by the following polynomial equation:
Negative coefficients of A, AC, and B2 in the model equation for Y2 refer to their inverse relationship with the particle size distribution.
4.2.3. Optimization and Validation
To find an optimum formulation, numerical optimization was performed to determine the levels of the independent variable factors using the desirability function. The levels of the variables with the highest desirability of 1 are represented in Table 3. In order to confirm the predicted model and validity of the optimized conditions, the optimum formulation was prepared and evaluated for the responses.
| Variables a | Response | Predicted | Observed | Relative Error (%) | ||
|---|---|---|---|---|---|---|
| A | B | C | ||||
| 467 | 73 | 0.84 | Zave (nm) | 252.1 | 254.4 ± 5.14 | 0.91 |
| PDI | 0.188 | 0.195 ± 0.03 | 3.72 | |||
a A, milling speed (rpm); B, milling time (min); C, stabilizer concentration (%).
4.3. Particle Size, Redispersibility, and ZP
The Zave of the optimized FD-NS was determined after redispersion, which was equal to 299.6 ± 5.34 nm with a PDI of 0.238 ± 0.043. Narrow size distribution is an essential factor preventing the growth of the nanoparticles by Ostwald-ripening. The calculated RDI value of the optimized formulation was equal to 1.178.
ZP value of redispersed EZ nanoparticles was obtained as -20.72 ± 1.18 mV, which was almost similar to the freshly prepared NS (-21.1 ± 1.74 mV).
4.4. DSC, FTIR, and XRD Analyses
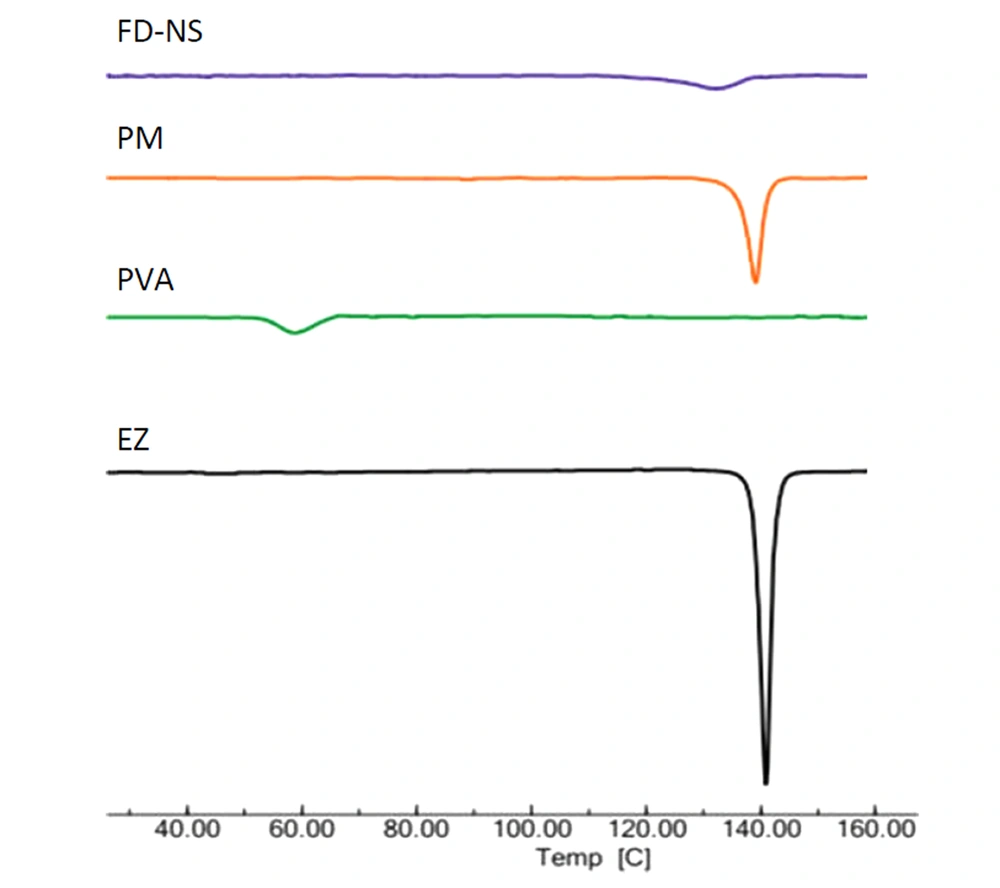
The DSC analysis was carried out to study the effect of nanosizing and freeze-drying on the solid state of EZ. The DSC thermograms of EZ bulk powder, PVA, FD-NS, and related physical mixture (PM) are depicted in Figure 4. A characteristic endotherm appeared for EZ at the onset temperature of 138.6°C, corresponding to the melting point of crystalline drug (39). The Thermogram of PVA revealed an endothermic peak in the range of 53.8 - 65.3°C, related to its glass transition temperature. A shift to a lower temperature of this peak could be due to the plasticization of the polymer by water (40).
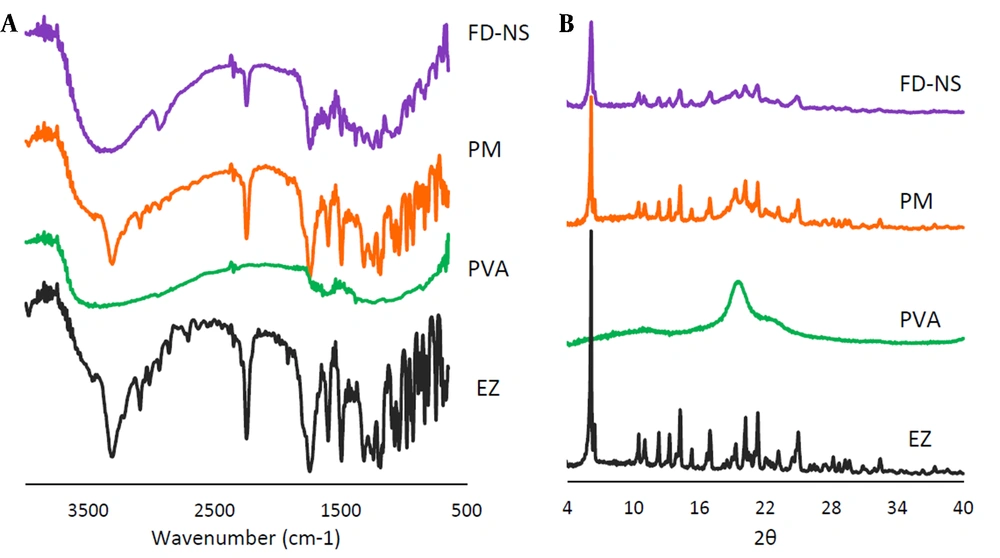
Possible interaction between the drug and the additives could be detected using FTIR analysis (Figure 5A). FTIR spectra showed EZ characteristic peaks at 3314 cm-1 (N-H stretching vibration), 1741 cm-1 (C=O stretching vibration), 2249 cm-1 (C≡C stretching vibration), 1602 and 1494 cm-1 (stretching vibration of benzene ring C=C), 1241 and 1166 cm-1 (C-N and C-O stretches, respectively) (7). The PVA spectrum exhibited a peak at 3467 cm-1 attributed to the stretching vibration of O-H group of alcohol. The vibrational band observed between 1710 and 1730 cm-1 refers to the stretching C=O group (41).
XRD can be used to get information on the crystalline characteristics of the drug and the formulations. Figure 5B represents the XRD patterns of the intact EZ, PVA, FD-NS, and related PM. Based on the diffractogram of the intact drug, multiple peaks at various 2θ angles of 10.49°, 11.03°, 12.33°, 13.31°, 14.27°, 16.99°, 19.32°, 20.20°, 21.30°, and 24.98° along with a distinct peak at 6.18°, indicated the crystalline polymorph I of EZ (7, 20). The XRD pattern of PVA showed three broad peaks at 2θ angles of 19.55° (with higher intensity), 11.31°, and 22.52° (with lower intensities), representing its semicrystalline structure (42, 43).
4.5. Field Emission Scanning Electron Microscopy (FE-SEM)
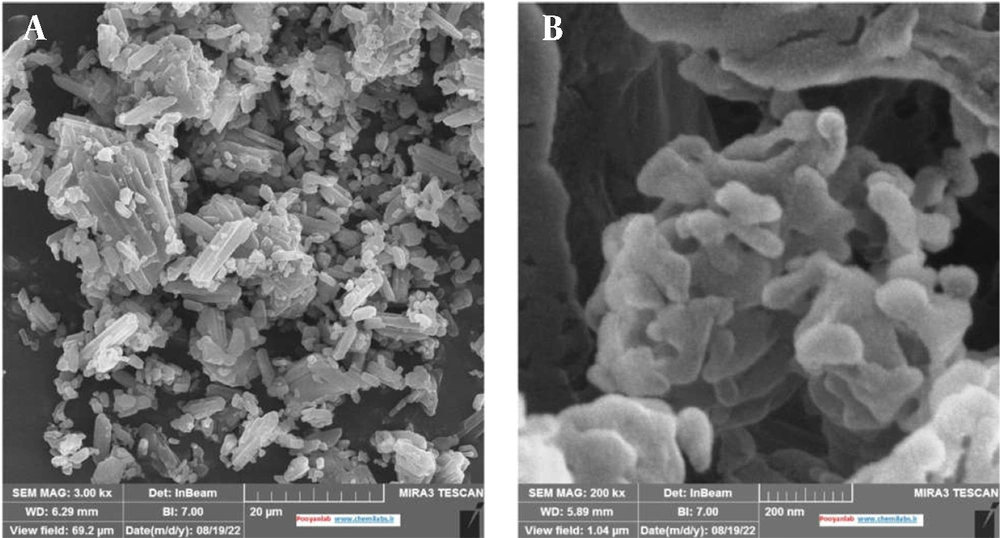
FE-SEM was applied to characterize the morphology of the intact drug and the optimized formulation. Based on Figure 6, EZ particles used in this study were mostly polyhedral and columnar in shape with different particle sizes. The modification in the morphology and shape of drug particles in FD-NS was obvious in FE-SEM micrographs. The effectiveness of the wet milling process in changing the EZ original powder to the submicron particles (less than 500 nm) was also confirmed, which was found compatible with the results of the DLS method.
4.6. Saturation Solubility and Dissolution Test
The aqueous solubility of the pure drug, optimized FD-NS, and the related PM was determined. The solubility of EZ powder was equal to 9.05 ± 1.23 µg/mL. The physical mixture showed a slight increase of about 2.6 times in the solubility of EZ (23.6 ± 0.56 µg/mL), which could be expected due to the solubilization effect of PVA and SLS. The highest saturation solubility was achieved for the FD-NS (102.8 ± 1.49 µg/mL), which was 11.3-fold higher than that of the intact drug.
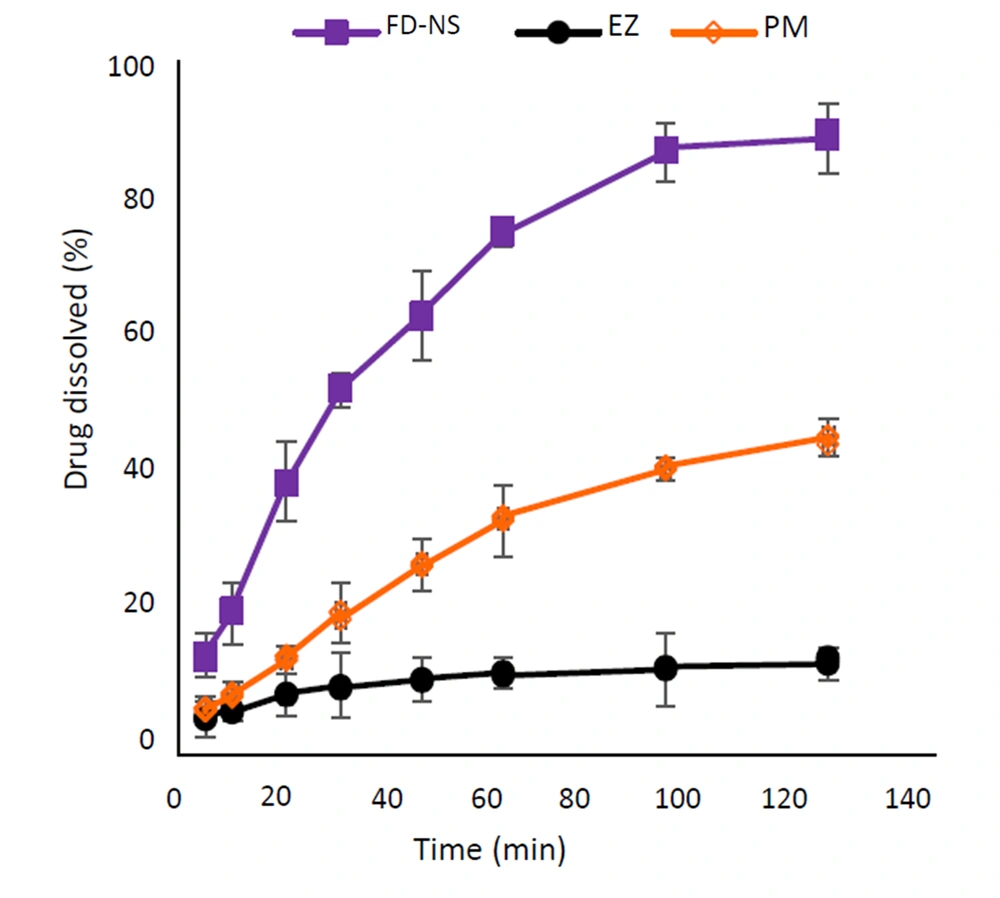
Figure 7 shows the dissolution profiles of the intact drug, the optimized FD-NS, and the corresponding physical mixture in 0.1% SLS aqueous solution. According to the results, nanosized EZ displayed a remarkable increase in the rate and extent of dissolution compared to the intact drug and PM. The dissolution parameters of the samples are represented in Table 4.
| Sample | Q30 a (%) | DE60 (%) | DE 120 (%) | MDR (%min-1) |
|---|---|---|---|---|
| EZ | 9.54 ± 3.06 | 8.94 ± 0.09 | 10.79 ± 0.12 | 0.48 ± 0.03 |
| PM | 20.49 ± 1.87 | 19.36 ± 0.19 | 30.46 ± 0.05 | 0.64 ± 0.02 |
| FD-NS | 52.57 ± 5.29 | 45.96 ± 1.08 | 78.38 ± 2.03 | 1.10 ± 0.01 |
Abbreviations: DE, dissolution efficiency; MDR, mean dissolution rate.
a Q30, amount of drug dissolved in 30 min.
A similar trend was also observed for the dissolution of the above samples in the phosphate buffer solution (pH = 6.8) containing 0.1% SLS (illustrated in Appendix 5 in Supplementary File). The relevant dissolution parameters are depicted in Appendix 6 in Supplementary File.
4.7. Stability
Optimized FD-NS was subjected to accelerated stability studies, and then its physicochemical properties, including the size (Zave), PDI, dissolution, and drug content, were studied after 1 and 3 months (Table 5).
| Variables | Fresh Sample | After 1 Month | After 3 Months |
|---|---|---|---|
| Zave (nm) | 299.6 ± 5.34 | 305.7 ± 7.21 | 318.2 ± 2.43 |
| PDI | 0.238 ± 0.04 | 0.266 ± 0.02 | 0.309 ± 0.02 |
| RDI | 1.178 | 1.199 | 1.250 |
| DE60 (%) | 45.96 ± 1.08 | 43.16 ± 3.59 | 41.85 ± 6.61 |
| DE120 (%) | 78.38 ± 2.03 | 72.41 ± 5.04 | 70.19 ± 4.28 |
| Drug content (%) | 95.37 ± 4.93 | 94.82 ± 6.13 | 93.59 ± 0.17 |
5. Discussion
Nanosuspensions of EZ with Zave below 1 µm were successfully prepared with the wet milling technique. Reducing the particle size of nanosuspensions is considered as an effective approach to enhance the solubility and dissolution of poorly soluble drugs by increasing surface area. Thus, to obtain the lowest Zave of EZ-NS, different process and formulation variables were studied, and all prepared NSs were characterized based on Zave and PDI. While the mean particle size (D0.5) and span values of the intact drug were 21.02 ± 6.4 µm and 2.30, respectively, the Zave of the prepared nanosuspensions was lowered to 188 ± 19.4 nm following wet milling at 400 rpm for 3 h using F68 as a stabilizer. Different PDIs with the lowest value of 0.106 were obtained using various conditions. PDI is an important factor in identifying if the nanosized drug particles with a homogenous size distribution have been prepared. Nanosuspensions with PDI values less than 0.5 were considered acceptable, indicating monodisperse and narrow size distribution of nanosuspensions (44).
Based on the preliminary studies (Figure 1A), the minimum particle size was obtained with smaller beads (P < 0.0001) which were similar to the results reported by Ghosh and coworkers comparing beads sizes of 0.1 and 0.5 mm (45). By reducing the bead size, while keeping the weight constant, the number of beads per volume was increased, providing a greater surface area and thus a higher probability of contact with the API. This could increase the stress frequency on the particles and consequently reduce the particle size (46).
Regarding the milling time, increasing the time was associated with reducing the particle size of nanosuspensions, which was quite evident in the 30 to 120 min (P < 0.0001). The particle size reduction rate was reduced after 2 h, which could be attributed to the need for more mechanical stresses for further particle breakage (47).
It was found that increasing the number of beads reduced the particle size significantly (P < 0.01) (Figure 1B), which was expected due to the enhanced contact points and collisions between the drug particles and the beads (48). This was in correlation with increased frictional and impact forces, as reported by Chogale and coworkers (49). The effect of this parameter was more significant in the early stages of the milling and decreased with increasing the milling time. Increment in the bead weight from 6 to 8 g reduced PDI values, reflecting the more uniform size distribution. This could be due to the enhanced collision between the milling beads and EZ particles (50). This phenomenon was not observed comparing the bead weights of 4 and 6 g. Probably, using 6 g beads was not adequate enough to uniformly decrease the size, leading to enhanced PDI values. An almost similar result was observed in an earlier study (51).
Considering the importance of obtaining desirable nanoparticles with less milling time, using a higher beads to powder ratio seems appropriate. Therefore, based on the results, 8 g of the milling beads were used for the next experiments.
The use of various stabilizers yielded different results in terms of particle size and distribution due to the nature of these polymers and their interaction with EZ particles. The milling time was less effective for CMC-containing samples, which could be attributed to its higher viscosity. Increasing the concentration of the stabilizers was also associated with increasing the viscosity of the medium. It has been shown that the viscosity of the milling medium could be very effective in the milling process because it affects the resistance to the movement of the milling beads and thus affects the milling time (47).
Considering the polymer structure, F68 could be adsorbed onto the surface of hydrophobic drug particles through its hydrophobic polypropylene oxide center block, while the polyethylene oxide chains extend in the medium, providing steric repulsion and stabilization (52). On the other hand, PVA, as a nonionic polymer, could prevent particle growth and agglomeration due to adsorption on the crystal faces and a hydrodynamic boundary layer formation around the particles.
It is evident that PVA was more effective in particle size reduction during the first hour of milling than F68, and its application led to the formation of finer nanoparticles with suitable uniformity in less milling time. This could be due to the high affinity of this polymer to the particle surfaces through the formation of hydrogen bondings between the stabilizer and the drug molecules (53). Although, several factors such as polymer composition, functional groups, and molecular weight could affect the efficiency of a stabilizer (54).
As an indication of the physical stability of NS, ZP is a measure of the electric charge at the surface of the particles. Generally, sufficient ZP could inhibit nanoparticle aggregation by providing a steric barrier or electric repulsion. A ZP of at least ±30 mV is desired for nanosuspensions to be stable by electrostatic repulsion. This value equals ±20 mV if a combination of steric and electrostatic stabilizers is used (37). Clearly, the use of SLS led to an improved ZP due to its adsorption onto the surface of drug particles (37). On the other hand, adding SLS increased Zave of EZ-NS (Appendix 1 in Supplementary File). It seems that increasing SLS concentration in the medium enhanced the drug solubility, leading to the Ostwald-ripening during the process (47).
Box-Behnken design was applied to study the effect of different variables on each response (Zave and PDI) and find an optimized nanosuspension formulation. Based on ANOVA analysis (Appendix 3 in Supplementary File), PVA concentration (C) showed a significant effect on the Zave of EZ-NS. Although the effects of milling speed (A) and milling time (B) were shown not to be significant (P > 0.05) by themselves, the effect of their interaction (AB) was found to be statistically significant. In addition, A2 as a quadratic term had a significant effect on Zave. The model F-value also confirmed the significance of the model (P < 0.05).
According to the response surface plots, in the presence of a larger percentage of PVA, a higher milling speed was necessary to achieve efficient EZ-NS size reduction (Figure 3A-B). Increasing the stabilizer concentration could be associated with increasing the viscosity of the NS preparation medium. Considering the small bead size used in this study, it could be probable that their kinetic energy was not enough at low milling speed to overcome the high viscosity of the medium, resulting in larger particles (16).
As shown in Figure 3, by reducing the milling speed (A) at the middle level of the stabilizer, a higher milling time (B) was required to achieve NSs with smaller particle size. Reducing the milling time required using milling speed higher than 400 rpm to obtain particles with Zave equal to or lower than 300 nm. On the other hand, using a high concentration of stabilizer resulted in reduced particles, regardless of the milling time. Lower particle size formation using higher PVA concentration was also reported by Lestari and coworkers (55). This could be due to the fact that higher polymer concentration could stabilize the drug particles more efficiently and prevent their aggregation (56) by covering the newly generated particle surfaces. Incomplete coverage of the particles' surfaces at low stabilizer concentration could lead to the instability of nanoparticles and higher particle size (57).
Based on the ANOVA analysis, milling speed (A) was a significant model term for particle size distribution (Appendix 4 in Supplementary File). The interaction of milling speed and PVA concentration (AC) and the quadratic term B2 (milling time) also had significant effects on PDI of NSs. The model F-value of this response indicated the significance of the model at P < 0.05. Based on the response surface plots for PDI, at a higher milling speed, the application of a higher PVA concentration (1%) decreased the PDI value (Figure 3D). A proper stabilizer with a suitable concentration could prevent the aggregation and growth of nanoparticles and result in homogenous particle size distribution (14). Both increasing and decreasing the milling time from the middle level caused reduced PDIs. Milling time higher than 120 min could result in PDI ≤ 0.3 at all milling speeds. However, in order to achieve EZ-NS with lower PDI and less preparation time, increasing the milling speed was required. Increasing the milling speed could lead to a more intense collision between the beads and the drug particles, which could decrease the particle size and PDI.
The optimum formulation was evaluated for the responses following experimental design and numerical optimization. Based on Table 3, the observed and predicted values were in good agreement, indicating the validity of the model. This was also confirmed by the low (< 5%) prediction error (58, 59), calculated by comparing the observed and predicted values (
Agglomeration of nanoparticles is a phenomenon that might occur during the drying process, which prevents the proper redispersion of the particles upon contact with water. Adding cryoprotectants to the nanosuspensions before drying can prevent this problem and help the redispersion of the nanoparticles. In this study, mannitol was used for this purpose. The RDI calculated for the optimized formulation (1.178) indicated an acceptable redispersion of the above formulation after rehydration. Usually, dried nanosuspensions with the RDI values less than 1.5 are considered to be well dispersed (30).
The effect of additives and the preparation process on the thermal properties of the drug was investigated by DSC analysis. Based on Figure 4, a drug endothermic peak with lower intensity (due to the dilution effect of the polymer) was observed in the DSC curve of PM, indicating the absence of strong EZ-PVA interaction. FD-NS thermogram showed a broader drug endotherm with a reduced melting point, which was in accordance with the literature (23). Particle size reduction is one of the reasons for the melting point depression, as predicted by the Gibbs–Thomson equation (61). Accordingly, the melting point of each compound is related to its particle size and moves backward as the particle size decreases. A similar observation has also been reported by other investigators (60, 62). A higher amount of the stabilizer captured on the surfaces of the nanoparticles (63) and disorders that occurred in the drug crystal lattice during the milling process (16) could also be considered as other reasons in this regard. The lower intensity of EZ melting endotherm in FD-NS compared to the physical mixture could be attributed to the reduced crystallinity and amorphous structures formed during the preparation process (64).
Based on FTIR analysis, all main peaks related to EZ powder appeared in the spectrum of the physical mixture, suggesting lack of a significant interaction between EZ and PVA. Regarding FD-NS, most absorption bands of the drug appeared, although a band broadening could be observed at 3314 cm-1, belonging to N-H stretching vibration. This might be interpreted as a consequence of intermolecular hydrogen bonding formation between the drug and PVA.
The XRD spectra of FD-NS and PM, consisting of a combination of both EZ and the polymer structures, appeared at the same 2θ values, indicating no polymorphic transition in the formulations. Although, the reduced peak intensities observed for FD-NS compared to the counterpart PM could be due to the formation of some amorphous structures or reduced crystallinity which is commonly associated with decreasing the particle size (19). A slight increase in the width of the peak appeared at 2θ angle of 6.18° for FD-NS could also be a sign of a decrease in the crystallinity (20).
In the wet milling process, the rotation of beads in the milling chamber causes them to collide violently with the substance, that might change the crystal structure due to the resulting mechanical forces (65). In the present study, FD-NS retained its crystal structure, and only partial amorphization seems to be occurred. Due to the higher physical stability of the crystalline structures in comparison to amorphous systems, appropriate stability of the prepared FD-NS on storage was expected. The results of the XRD analysis were in accordance with the DSC experiments described above.
Enhanced saturation solubility of the optimized NS compared to the intact drug and related PM (P < 0.0001) could be explained by Ostwald–Freundlich equation which states that particle size reduction to the nanometer scale could increase the dissolution pressure as a result of the strong curvature of the particles (66). Based on the XRD analysis, partial amorphization of the drug during the milling process could also influence the solubility of drug nanocrystals.
According to the dissolution study, the FD-NS sample exhibited a 75% drug dissolution within 60 minutes, whereas only 11.4% of pure drug dissolved during the same time interval in that media. For the PM, this value was equal to 33.8%. Various dissolution parameters were calculated to facilitate comparing the dissolution profiles of different samples (Table 4). The change in the amount of drug dissolved from the prepared samples at the first stage of the dissolution test was quite evident, and a difference of about 40% was observed between the nanosized particles and the intact drug. The results also clearly showed significantly improved values of DE and MDR of the optimized formulation (P < 0.001). The DE60 of FD-NS was more than 5.1 and 2.3-fold higher than that of EZ and PM, respectively. Also, the value of DE120 of the nanoparticles showed an increase of 7.2 times compared to EZ. A similar trend was observed for MDR, with an about 2.3-fold increase for the optimal formulation compared to the intact drug. Reduced particle size and, consequently, higher effective surface area of FD-NS are the major causes of its improved dissolution. Besides, the presence of amorphous structures on the surface of crystalline particles can also be a further cause. According to the Noyes–Whitney equation, saturation solubility of the drug could affect its dissolution behavior. Since the aqueous solubility of the nanosized formulation was increased approximately 11 times compared to the raw drug powder, this could also be considered as one of the reasons for improving the dissolution. The higher dissolution rate of PM in comparison with the intact EZ could be due to the improved wettability of drug particles in the presence of hydrophilic additives.
In addition to all the above features, the optimized formulation had acceptable stability. The particle size of the formulation did not change significantly upon storage. PDI values, increasing to some extent, were still in the range of 0.3, indicating the suitable particle size distribution. Low RDIs also indicated the proper redispersion of the formulation following contact with water after the stability test.
The results revealed that the dissolution behavior remained almost constant after storage compared to the freshly prepared sample. This is confirmed by the lack of significant difference (P > 0.05) between dissolution efficiency values (Table 5). In addition, the drug content did not show any noticeable changes in comparison with the fresh sample, which confirmed that the formulation remained chemically and physically stable during the study.
5.1. Conclusions
The wet media milling technique was successfully used for the preparation of EZ-NS with small and uniform particle sizes in a short milling time. This was achieved with careful selection of PVA-SLS combination as steric-electrostatic stabilizers and appropriate processing conditions. Box-Behnken design was applied to optimize process and formulation variables, including milling speed, milling time, and PVA concentration for nanosuspensions. Experimental analysis showed that the smallest particle size was achieved with the use of 0.84% PVA as a stabilizer, a milling speed of 467 rpm with a milling time of 73 min. Optimal EZ-NS with the Zave of 254.4 nm and PDI of 0.195 was prepared with a negligible prediction error. The solidified EZ nanocrystals exhibited significantly improved solubility (about 11-fold) and dissolution rate compared to the intact drug. The optimum formulation kept physicochemical properties after three months of stability studies.
