


1. Background
Honeybees produce a natural and valuable substance from the nectar of flowers, called honey, which has nutritional, cosmetic, therapeutic, and industrial value.
The main constituents of natural honey are sugar and water. About 95 - 99% of honey dry matter is sugar, and the water activity (WA) of honey is between 0.56 and 0.62. It also contains vitamins, amino acids, enzymes, and minerals. The intangible sour taste of honey is caused by organic acids (with a pH of about 3.9). Minerals account for a small portion of honey content; potassium is the major mineral, followed by calcium, magnesium, sodium, sulfur, and phosphorus.
The consumption of honey by humans has a historical background. Antioxidant, antimicrobial, apoptotic, anti-inflammatory, and immunomodulatory activities can be mentioned among its therapeutic properties (1, 2). American and European foulbrood bacterial infection is a significant bee disease treated by antibiotics. Another bee disease is Nosema, caused by a protozoan. Antibiotics are mixed with their food to administer them to honey bees (3).
There are no established maximum residue limits (MRLs) for antibiotics used for treating bee diseases, and each country or continent sets its own thresholds (4). Microbiological effects, carcinogenicity, reproductive effects, and teratogenicity are the long-term consequences of exposure to antibiotic residues. One of the most critical health concerns is microbial resistance (5). Studies have shown that the most commonly used nitrofurans (nitrofurantoin, furazolidone, nitrofurazone, and furaltadone) are converted to toxic metabolites rapidly, which persist for long periods in food products because they bind proteins in high proportions. Their metabolites are 3-amino-2-oxazolidone (AOZ), 3-amino-5-morpholinomethyl-2-oxazolidinone (AMOZ), 1-aminohydantoin hydrochloride (ADH), and semicarbazide (SEC) (6). In addition, some antibiotics, like nitrofurans and nitroimidazoles, can cause human cancer (5). Approximately 1.4 million tonnes of honey are produced annually worldwide, with around 40% of the global production destined for Asian countries (3). Thereby, screening the residuals of antibiotics in honey is necessary for this area.
There are methods for the detection of antibiotic residues in honey. Among them is the evidence investigator biochip array technology, a biochip-based method that enables the simultaneous detection of several antibiotics from a single sample by employing chemiluminescent immunoassay principles. A biochip is a solid substrate with an array of discrete test areas of immobilized antibodies specific to different antimicrobial drugs. The evidence investigator analyzer is a semi-automated benchtop device. The system has clinical, forensic, and veterinary applications (3, 7, 8). To our knowledge, there are limited publications on detecting four nitrofuran metabolites in honey with this system (9).
2. Objectives
The goal of this study was to validate the Antimicrobial Array III kit based on European Decision No. CE/2002/657 (C.D 657) and the European guideline for the validation of screening methods for veterinary drug residues (CRL 2010) (10, 11). Subsequently, the validated method was applied to antibiotic residue analysis in real samples.
3. Methods
3.1. Chemicals and Reagents
AOZ, AMOZ, ADH, and SEC were purchased from Supelco (USA). The Anti-Microbial Array III kit (EV 3695) was obtained from Randox-Food Diagnostics (UK).
3.2. Apparatus
Evidence investigator biochip analyzer (Randox-Food Diagnostics, UK), vortex-Hei-MIX Reax top Heidolph (Germany), centrifuge Rotinta 380R Hettich (Germany), incubator UNB 400 Memmert (Germany), and roller mixer-BMW-4-1-10-R-1-89 Behdad (IRAN) were used.
3.3. Blank and Real Honey Samples
Twenty blank samples from the Netherlands and 35 real honey samples from Iran (n = 15), Germany (n = 2), and the Netherlands (n = 18) were screened. After collecting, the samples were stored at room temperature until analysis.
3.4. Standard Solutions Preparation
Standard solutions of each antibiotic (1 mg/mL) were prepared in methanol. An intermediate standard solution and a working solution of each compound containing 100 and 1 µg/mL in methanol were prepared, respectively.
3.5. Sample Preparation
Sample preparation was performed according to the instructions provided by the company. Spiked samples were prepared at different concentrations by fortifying a working solution on one gram of each blank honey sample. The sample preparation procedure was as follows: 1 g of honey sample was weighed, and then added 4 mL of warmed deionized water (37°C), 500 µL of HCl (1 M), and 145 µL of 4-nitrobenzaldehyde (10 mM), which was melted at 50°C. Then, the mixture was vortexed for one minute. After two hours of incubation, 5 mL of K2HPO4 (0.1 M), 400 µL of NaOH (1 M), and 6 mL of ethyl acetate were added to the samples and homogenated for one minute. The extract was centrifuged (at 4,000 rpm) for 10 minutes at room temperature. Next, 3 mL of ethyl acetate (supernatant fluid) was evaporated at 50°C. Following evaporation, 1 mL of hexane and diluted wash buffer were added to dried samples and vortexed for two minutes. For the second time, samples were centrifuged (at 4,000 rpm) for 10 minutes at room temperature. Finally, the lower aqueous layer (50 µL) was used for the biochip assay.
3.6. Multi-array Biochip System
The Anti-Microbial Array III kit and the Evidence Investigator biochip analyzer were used to quantitatively detect AOZ, AMOZ, ADH, and SEC from a single sample simultaneously.
Simultaneous competitive chemiluminescent immunoassays occur on the biochip surface with an array of discrete test areas of immobilized antibodies specific to different antimicrobial drugs. An increased level of nitrofuran metabolites in the samples can decrease the binding of the compounds labeled with horseradish peroxidase (HRP), and therefore, a decreased emission of the chemiluminescent signal is produced. The signals are recorded by a charge-coupled device (CCD) camera and presented as RLU and part per billion (ppb). The concentration of each analyte was then calculated from a calibration curve (7, 9).
The screening procedures were carried out according to the instructions provided by the company. First, assay buffer (150 µL) and control/calibrator/samples (50 µL) were added to each well. A handling plate (with a capacity of up to six biochip carriers) was incubated for 30 minutes (at 25°C and 370 rpm) in a thermal shaker. Then, ready-to-use conjugate (100 µL) was added to each well and incubated for 60 minutes at 25°C and 370 rpm. After washing with diluted wash buffer, the residual wash buffer was removed. The next working signal reagent (250 µL) was added to each biochip. The biochip was covered to protect it from light. The Evidence Investigator analyzer and the dedicated software captured the images after two minutes (± 10 s).
3.7. Processing of the Data
The chemiluminescent signal from each DTR on the biochip surface was detected simultaneously with a CCD camera. By using image processing, the dedicated software determined the RLUs and analyte concentration (in ppb). The multiple data generated were processed and archived.
3.8. Validation Procedure
The validation was based on the European instruction for validating screening methods for veterinary drug residues (10), which was created on the principles of C.D 657 (11). The achievement factors to be established were practicability, applicability, specificity, CCβ, and stability. The require spike and blank samples according to European guideline (10): if the spike concentration is considered at 1/2 of the regulatory/action limit (MRL) or lower, the existence of one or no false-compliant results follow-on the analysis of at least 20 samples is enough to verify that CCβ is less than the MRL and less than or equal to the 1/2 MRL. Classifying the samples as 'screen positive' required a cut-off level in the validation of screening techniques (CRL, 2010). Minimum required performance limit (MRPL), spiking level, and calibration range of nitrofuran metabolites are presented in Table 1.
| Compounds | MRPL (EU) (ppb) | Calibration Range (ppb) Regarding Dilution Factor = 2 | Chosen Spike Level (ppb) |
|---|---|---|---|
| AOZ | 1 | 0 - 8.6 | 0.5 |
| AMOZ | 1 | 0 - 12.2 | 0.5 |
| ADH | 1 | 0 - 9.4 | 0.5 |
| SEC | 1 | 0 - 22.0 | 0.9 |
Minimum Required Performance Limit (MRPL), Spiking Level, and Calibration Range of Nitrofuran Metabolites
The cut-off level and CCβ were identified for the four nitrofuran metabolites (AOZ, AMOZ, ADH, and SEC). The signal in RLU was used for analysis. The average signal value in RLU and the SD of the spiked and blank samples were considered for each metabolite.
The threshold value T from the blank samples was calculated as follows:
The cut-off factor Fm from the spiked samples was calculated as follows:
After the threshold value and the cut-off factor Fm were determined, if the threshold value was greater than Fm, CCβ would be equivalent to the target concentration during the validation. On the other hand, if Fm was greater than the threshold value, the concentration of metabolites in validation would be increased.
3.9. Practicability
A practicability study is not a different study that would require extra investigation. The point of the practicability study was to assess whether the procedure is suitable for regular practice. During the validation, practicability was noticed by assessing the ease of use, requirement of laboratory equipment (particular or usual apparatus in the lab), instruments (specific or common instruments in the lab), reagents (accessible or not), and ecological situations.
3.10. Applicability
Different honey samples with varying geographical origins were selected to provide a representative honey group. The applicability of the kit to different types of honey was tested by evaluating the CCβ of the four nitrofuran metabolites from 35 different honey samples.
3.11. Stability
The stability of nitrofuran metabolites in methanol and honey was noticed in a literature review.
3.12. Application of This Method on Real Samples
In this experimental study, 35 domestic and imported honey samples from IR Iran (n = 15), Germany (n = 2), and the Netherlands (n = 18) were tested by the validated method to detect the four nitrofuran metabolites simultaneously to confirm the capability and suitability of this method. This study was done in Tehran, IR Iran, in 2018. The Excel software was used for data analysis.
4. Results
4.1. Detection Capabilities
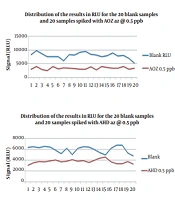
On the first day of validation, all the substances were detected; therefore, the concentrations of spike levels were not adjusted. The dissemination of the results (RLU) for the 20 blank and 20 spiked samples with the four nitrofuran metabolites is shown in Figure 1. As shown in Table 2, the RLU values of T were higher than Fm for all the metabolites when Fm was chosen as the cut-off value. Except for ADH (2 out of 20 spiked samples), no more than 5% of false-negative results (1 out of 20 spiked samples) were achieved for the other three metabolites, determining that the result was acceptable and the validated concentration was equal to CCβ. According to C.D 657, the chosen spike levels (validation concentrations) were selected as CCβ (Table 3).

Distribution of RLU results in 20 blank and 20 spiked samples for four nitrofuran metabolites.
| Parameters | AOZ | AMOZ | ADH | SEC |
|---|---|---|---|---|
| Concentration (ppb) | 0.5 | 0.5 | 0.5 | 0.9 |
| T value (RLU) | 6202.45 | 17359.41 | 4930.10 | 3676.25 |
| Fm value (RLU) | 4045.95 | 11726.47 | 4357.74 | 3593.63 |
| T > Fm | Yes | Yes | Yes | Yes |
| Number of FP | 0 | 0 | 0 | 0 |
| FP rate % | 0 | 0 | 0 | 0 |
| Number of FN | 0 | 0 | 2 | 0 |
| FN rate % | 0 | 0 | 10 | 0 |
False-Positive and False-Negative Results with Fm as Cut-Off Value
| Parameters | AOZ | AMOZ | ADH | SEC |
|---|---|---|---|---|
| LOD (ppb) (as per manufacturer) | 0.30 | 0.08 | 0.30 | 0.50 |
| Spike level used for validation (ppb) | 0.5 | 0.5 | 0.5 | 0.9 |
| CCβ (ppb) | 0.5 | 0.5 | 0.5 | 0.9 |
Detection Capabilities CCβ
4.2. Practicability
A small amount of honey sample was needed (one gram). A straightforward sample preparation procedure was required for honey samples. The amount of material supplied in the kit was adequate, and the sample preparation process was simple to follow. The software was user-friendly in its functionality. The data were attainable in ppb and RLU.
4.3. Specificity and False-Positive Rate
Forty honey samples (blank and spiked) were tested in three days for validation (Table 4). When T was selected as the threshold value, 5% of samples (one sample out of 20) were detected as false-positive for AMOZ and ADH, 10% of samples (two samples out of 20) were detected as false-positive for AOZ, and no false-positive results were detected for SEC. When Fm was considered the threshold value, 10% of samples (two samples out of 20) were detected as false-negative for ADH, and no false-positive results were obtained for any nitrofuran metabolites. Choosing T as the cut-off was more sensitive because no false negatives were observed, but the higher false-positive rate required a more expensive confirmatory analysis. The choice of Fm as the cut-off level is a balance of detection capabilities, low enough to achieve each Recommended Concentration (RC) and a reasonable false-positive rate. Therefore, Fm was determined as the cut-off value to indicate positive for the sample.
| Parameters | AOZ | AMOZ | ADH | SEC |
|---|---|---|---|---|
| T (n = 20) | 6202.45 | 17359.41 | 4930.10 | 3676.25 |
| Cut off = T (n = 20) | ||||
| False-positive | 2 | 1 | 1 | 0 |
| False-negative | 0 | 0 | 0 | 0 |
| Fm (n = 20) | 4045.953 | 11726.47 | 4357.742 | 3593.635 |
| Cut off = Fm (n = 20) | ||||
| False-positive | 0 | 0 | 0 | 0 |
| False-negative | 0 | 0 | 2 | 0 |
The Number of False-Positive and False-Negative Results When the Threshold T or the Cut-Off Factor Fm Was Selected as the Cut-Off Level
4.4. Applicability
The applicability of the Anti-Microbial Array III kit was proved by the specificity study and determination of CCβ in various types of honey. This kit could be applied to a variety of honey samples. The origin of honey did not affect the results.
4.5. Stability of Antibiotic Residues
Honey is stored at room temperature for weeks or months before it becomes available to consumers and laboratories. A survey performed in the United States showed that all four nitrofuran metabolites were found stable in honey stored at room temperature; however, they gradually decomposed (12). In that condition, they were almost stable for about eight months (12). Only the concentration of SEC was observed to decompose slightly at room temperature (12).
4.6. Screening of Real Honey Samples
This method was applied to screening AOZ, AMOZ, and SEC in 35 real domestic and imported honey samples. Samples with RLUs above the cut-off were flagged as presumed negative. Samples with an RLU below the cut-off level tested positive in the screening. The number of presumptive positive samples is shown in Table 5. Moreover, the data are separately set out in Tables 6 and 7 based on their sources. Spiked samples and control solution in the kit, as positive QCs, and blank samples, as negative QCs, were used during the validation and analyses of the 35 real honey samples. The samples were reanalyzed when the QCs during analyses of real samples in each run were invalid.
| Parameters | AOZ | AMOZ | SEC |
|---|---|---|---|
| Number of samples | 35 | 35 | 35 |
| Cut-off (RLU) | 4045.953 | 11726.47 | 3593.635 |
| Number of presumptive positive samples | 3 | 2 | 13 |
| % Presumptive Positive sample | 8.57 | 5.71 | 37.14 |
Occurrence of AOZ, AMOZ, and SEC Antibiotics in Domestic and Imported Honey Samples in RLU
| Parameters | AOZ | AMOZ | SEC |
|---|---|---|---|
| Number of samples | 15 | 15 | 15 |
| Cut-off (RLU) | 4045.953 | 11726.47 | 3593.635 |
| Number of presumptive positive samples | 1 | 2 | 5 |
| % Presumptive Positive sample | 6.66 | 13.33 | 33.33 |
Occurrence of AOZ, AMOZ, and SEC Antibiotics in Domestic Honey Samples in RLU
| Parameters | AOZ | AMOZ | SEC |
|---|---|---|---|
| Number of samples | 20 | 20 | 20 |
| Cut-off (RLU) | 4045.953 | 11726.47 | 3593.635 |
| Number of presumptive positive samples | 2 | 0 | 8 |
| % Presumptive positive sample | 10 | 0 | 40.00 |
Occurrence of AOZ, AMOZ, and SEC Antibiotics in Imported Honey Samples in RLU
5. Discussion
In recent decades, antibiotics have been increasingly used because of the growing need for food production, and there is no exception for honey and bee products. Honey's antimicrobial residues are generally in trace amounts (13). However, their presence could cause direct health risks to consumers, such as antibiotic resistance and human cancer (14).
In addition to existing chromatographic methods for screening or confirmation, many microbiological, immunological, and receptor tests have been developed to screen for residues of anti-infective substances in honey. Examples of methods available for screening four nitrofuran metabolite residues in honey are shown in Table 8 (15, 16).
| Principle of the Test (Type of Reaction) | LOD of AOZ (ppb) | LOD of AMOZ (ppb) | LOD of ADH (ppb) | LOD of SEC (ppb) | Number of Tested Antibiotic Residues | Time per Analysis (h) | References |
|---|---|---|---|---|---|---|---|
| Biochip-based immunoassays (biochip array technology) | 0.3 | 0.08 | 0.3 | 0.5 | 4 | Approx.2.5 h | As per manufacturer |
| High-throughput suspension array technology | 0.031 | 0.087 | 0.131 | 0.055 | 4 | Approx. 9 h | (17) |
| Visualized microarray sensing technique | 0.04 | 0.1 | 0.1 | 0.04 | 4 | Approx.6.5 h | (18) |
| Single liquid-liquid extraction LC-MS/MS | 0.097 | 0.062 | 0.059 | 0.060 | 6 | Approx.17 h | (19) |
| Multispot nanoarray for antibiotic screening | 0.26 | 0.09 | 6.9 | 45.8 | 5 | Approx.1.5 h | (20) |
| LC-MS/MS assay | 0.06 | 0.04 | 0.06 | 0.08 | 4 | Approx.18 h | (21) |
| LC-MS/MS assay | 0.2 | 0.15 | 0.6 | 0.2 | 4 | Approx.17 h | (22) |
Comparison of Different Screening Methods of Nitrofuran Metabolites in Honey
To our knowledge, no other studies have analyzed honey samples by biochip array technology for nitrofuran metabolite residues in IR. Iran. In this survey, the Antibacterial Array III kit was validated per C.D 657 and the European Instruction (7, 11) on validating screening methods for veterinary drugs. The results showed that this kit could be used as an effective screening method for simultaneously measuring three nitrofuran metabolites (AOZ, AMOZ, and SEC) in honey samples at validated concentrations. CCβ levels were below the MRPL defined by the European Commission for these three metabolites. This technology has proven to be quick, precise, and safe. Almost 53.3% of domestic and 50% of imported samples screened positive for these three nitrofuran metabolite residues (8 of 15 and 10 of 20 samples, respectively).
The validated method allows fast screening of nitrofuran residues from a single sample compared with other methodologies with LODs below 1 ppb. The same method was evaluated and applied to the screening of honey samples of different geographic regions and was found suitable as a screening tool for detecting nitrofuran metabolites (8, 23).
Many papers have globally focused on antibiotic residues in honey samples. In a survey carried out in Egypt, 30 honey samples were tested by a modified QuEChERS protocol coupled with LC-MS/MS. Based on the results, ADH, AOZ, AMOZ, SEC, ronidazole, and dimetridazole were not detected at levels above the detection capability in any sample (23). Simultaneous testing of 50 blind honey samples using suspension microarrays and commercial kits did not detect positive samples with either method (17). In a study carried out in Romania, the analysis of 16 samples showed one positive sample with values higher than 1 µg/kg for AOZ and SEC (6). In an assessment of furaltadone, furazolidone, nitrofurazone, and nitrofurantoin residues in 24 samples of honey (mixed flower and sunflower) from Spain and Venezuela, none showed the presence of nitrofurantoin metabolites by LC-MA-MS (22). In the study by Melekhin in Russia, the developed method was applied to analyze 20 honey samples. Three samples were positive for AOZ, ADH, and SEC, and none were positive for AMOZ. The concentrations were 2.1 µg/kg for AOZ, 6.1 µg/kg for ADH, and 3.2 µg/kg for SEC (24). Another study conducted by Morariu applied the biochip method to analyze 16 honey samples from different geographic regions of Romania and found AOZ and SEC values above 1 µg/kg only in one sample (6). Another study evaluated more than 120 honey-grown varieties from various geographic origins, mainly Latin America and the Pacific, as well as Europe, Africa, and the Middle East, using HPLC-MS/MS. In this study, 14% and 21% of the samples were contaminated with AOZ and SEC, respectively (25). In our study, the screening of 35 samples from Iran, Germany, and the Netherlands showed that more than 10% were presumptive positive.
The assortment of detection methods and the number of surveys in this field demonstrated the impact of this subject worldwide. According to our results and the previous studies, monitoring antibacterial residues in different types of honey in Tehran and other provinces of IR Iran requires more extensive screening studies.
5.1. Conclusions
As far as we know, this study represents the first validation of an antibacterial array III assay for honey in compliance with the European Instructions among Iran's veterinary drug screening methods. Contamination of honey with residues of nitrofuran metabolites can cause significant economic loss to producers and manufacturers of honey and other bee products, as well as adverse health effects.
The validated method can screen various honey-type nitrofuran metabolites at high speed and simultaneously with simple experimental procedures. The results showed that honey might contain antibiotic residues. Therefore, due to health and economic implications, regular monitoring of different types of domestic and imported honey samples in different seasons and environments seems necessary.
