1. Background
Policies that determine the maximum breath ethanol concentration (BrAC) for driving under the influence of alcohol can reduce traffic accidents by about 20% (1, 2). In several countries, the initial screening method for drivers or those suspected to be under the influence of alcohol is to measure the alcohol concentration in their breath as the testing gives rapid results and is easy to perform (3, 4). However, in animal experiments, owing to reduced lung capacity, the use of a police alcohol breath detector is challenging. Gas chromatography has typically been used to detect the presence of alcohol in the blood (5, 6). Although gas chromatography is accurate in detecting blood alcohol concentration, it is invasive and requires continuous blood collection, especially because multiple samples at different stages of metabolism are required to detect alcohol metabolism. Several methods have been developed to non-invasively estimate blood ethanol levels in rats (7, 8). Such techniques have proven useful in studies in which repeated phlebotomy is not feasible (9, 10). However, some non-invasive methods use gas chromatography and create an air chamber on the head of the rat, restricting the movement of the rat. To achieve an unlimited non-invasive measurement of alcohol concentration in rats, a rat breath alcohol detection device was designed. Its precision and feasibility were studied and a reliable methodology was established. Compared to gas chromatography, the device is simple, and reproducible and results in immediate and inexpensive alcohol detection. The device will thus prove useful for evaluating BACs. Furthermore, the movement of the experimental rats are not restricted, and the rats could be tested numerous times. All these criteria meet the requirements of pharmacokinetic experiments in animals (11, 12). Additionally, this assay was suitable for studying the dynamics of alcohol metabolism related to alcohol injury, and changes in the design can facilitate laboratory scientific research.
2. Methods
2.1. Ethics Statement
All animal experiments complied with the ARRIVE guidelines, and the Ethics Committee at Baotou Medical College approved the experimental protocols of this study (approval No.: 2021-061). All the experiments were performed in accordance with relevant guidelines and regulations. Sprague-Dawley rats were used as animal models in this study. All animals were assessed as healthy prior to the commencement of the experiments. Animals were monitored prior to and following every injection to ensure that there were no abnormalities in weight (> 10%), appearance (fur), or behavior (vocalization, respiration, and movements). All efforts were made to limit animal suffering. They were handled by experienced researchers to minimise stress prior to being sacrificed.
2.2. Materials
The Black Cat No. 3 Blowing Alcohol Tester, produced by Shenzhen Zhaowei Technology Co., Ltd., contains a gas bottle (3 L) and a syringe (550 mL). Commercial analytical grade alcohol (Tianjin Damao Chemical Reagent Factory, China, batch number: 20150503), carbon tetrachloride (Shanghai Rongbai Biotechnology Co., Ltd., batch number: HX7484), and sodium phenobarbital (Shanghai Xinya Pharmaceutical Co., Ltd., batch number: 180607) were purchased.
Male and female Sprague-Dawley rats, 8 - 9 weeks old, weighing 220 ± 20 g were purchased from Speifu (Beijing) Biotechnology Co., Ltd., with experimental animal production license number SCXK (Beijing) 2019-0010. Rats were individually housed in a cage at an average temperature of 20°C and were subjected to a 12-hour light/dark cycle, during which the experiments were performed. The rats were allowed two weeks to acclimatize to the indoor environment and had free access to water and food in the cage.
2.3. Grouping of Rats
After weighing and numbering, the animals were divided into three groups according to a random number table, with five animals in each group. The control group was intraperitoneally injected with 1 mL.kg-1 of normal saline; the injury group was intraperitoneally injected with 50% CCL4 1 mL.kg-1, which caused acute liver injury 24 h later; and the induction group was intraperitoneally injected with phenobarbital 50 mg.kg-1 once daily for three consecutive days. The method used to group male and female rats was the same as that used for modeling. On the second day after the model was established, the rats in each group were administered 56% alcohol 0.1 mL.kg-1 by gavage, and changes in breath alcohol were detected over a period of time.
2.4. Description of the Rat Breath Alcohol Tester
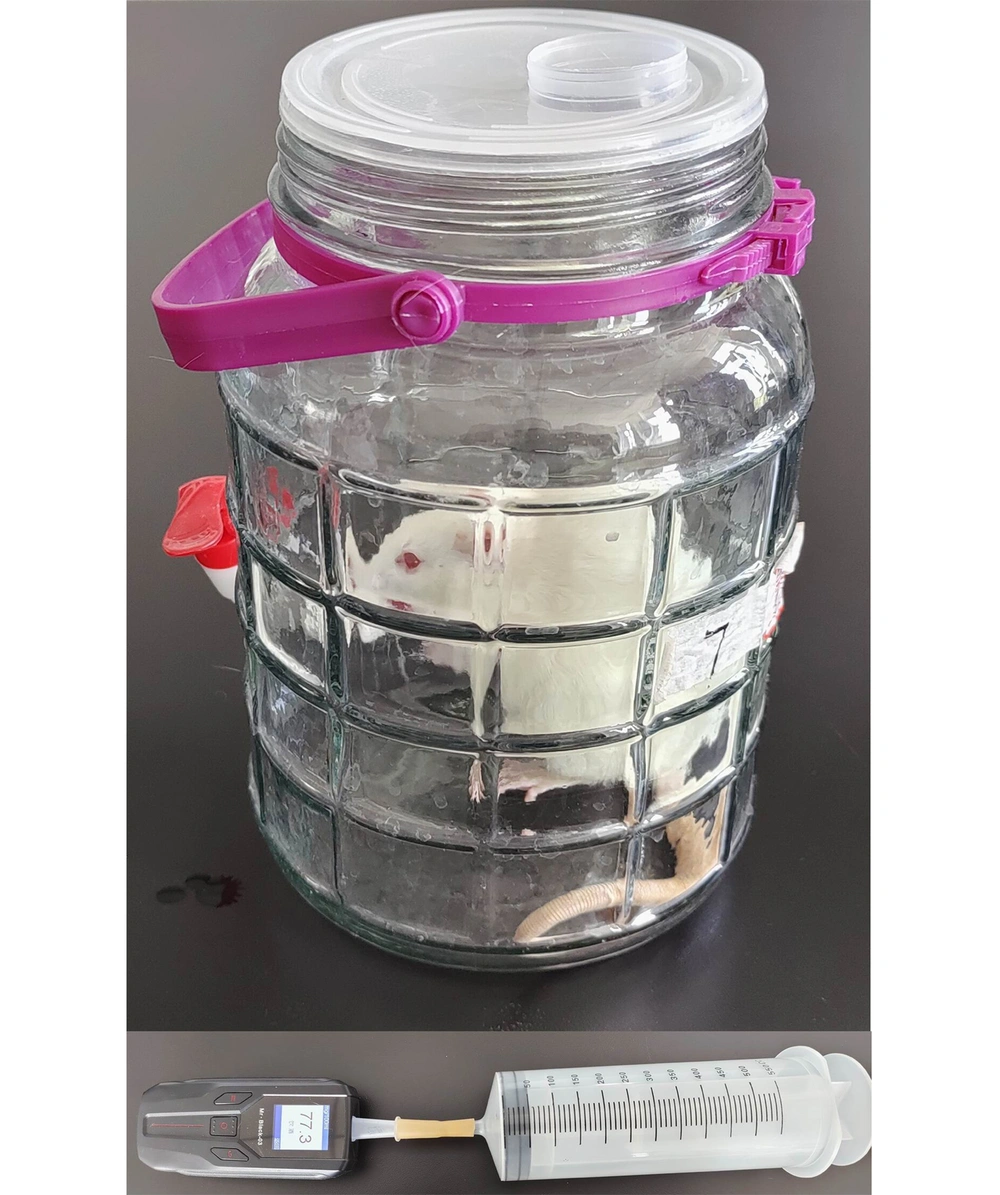
After gavage of alcohol for 5 min, rats in this group were placed in a gas collection bottle. After 15 min, 500 mL of alcohol gas was extracted from the middle of the bottle with a 550 mL syringe and quickly connected to the alcohol detector with a rubber hose to keep the connection tight to prevent the gas from escaping. The syringe plunger was depressed at a constant rate. After a few seconds, the alcohol detector automatically detected the alcohol gas concentration and converted it to blood alcohol concentration. The data were recorded (Figure 1). The rat was allowed to rest outside the chamber for five minutes, before it was placed back into the gas collecting bottle again for an additional 15 min. The measurement was performed again. This procedure was repeated every 20 min until the alcohol concentration in the exhaled breath of the rats reached zero (total of five repeats). Time-dependent changes in blood alcohol concentration were plotted. The pharmacokinetics software DAS3.0 (Mathematical Pharmacology Professional Committee of China, Shanghai, China) was used to obtain the area under the curve [AUC (0-t)], in vivo residence time [MRT (0-t)], clearance rate (CLz/F), and various kinetic parameters of alcohol metabolism.
Rat alcohol detector device. The rat was placed in the gas collection bottle, after 15 min, a 550 mL syringe was used to extract 500 mL of alcohol gas from the middle of the bottle. This was quickly connected to the alcohol detector with a rubber hose, and the syringe plunger was depressed at a constant rate. The alcohol gas concentration was detected and converted into blood alcohol concentration, and the data were recorded.
2.5. Western Blot Detection of CYP2E1 Expression in Liver Tissue
After the rats in each group were sacrificed by cervical dislocation, the livers were removed by laparotomy, weighed, and homogenized to extract proteins. The blocking solution was mixed with 5% skimmed milk powder and 1% BSA prepared with 0.02 mol.L-1 TBS buffer, shaken on a shaker (Haimen Qilin Bell Instrument Manufacturing Co., Ltd., China), and blocked at room temperature for two hours. After washing, CYP2E1 rabbit polyclonal antibody and β-actin mouse polyclonal antibody were hybridized, and a secondary antibody was added. The color was developed. The image acquisition system (Uniasia Biotechnology, China, model: OmegaLum C) was used for semi-quantitative analysis of the protein bands.
2.6. Statistical Analyses
Prism (version 8.0; GraphPad) was used for all statistical analyses. Statistical comparisons were performed using one-way analysis of variance (ANOVA), followed by Dunnett’s test. The main pharmacokinetic parameters, including AUC(0-t), MRT (0-t), and CLz, were calculated using the non-compartment analysis of Drug and Statistic (DAS) pharmaco-kinetic software version 3.0 (Mathematical Pharmacology Professional Committee of China, Shanghai, China). P-values < 0.05 were considered to be statistically significant. All data are expressed as mean ± standard deviation (SD).
3. Results
3.1. Reproducibility, Precision, Linearity and Feasibility of the Method
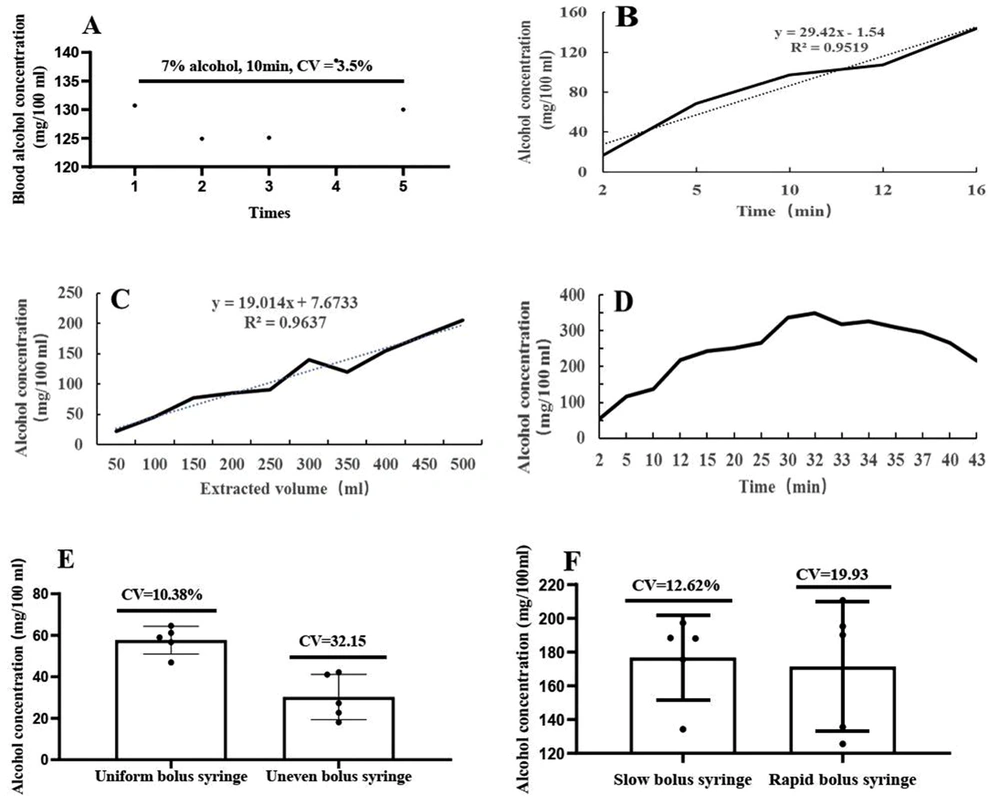
To establish a methodology for the detection of end-tidal alcohol accumulation in rats using gas collection cylinders, reproducibility, precision, linearity, and feasibility were investigated. Alcohol, 1 mL, at a certain concentration was added to a bottle cap with an inner diameter of 2.5 cm, and placed at the bottom center of the gas bottle. Statistical analyses were performed on the data based on five repeats of the same procedure, and the standard deviation was divided by the mean to obtain a coefficient of variation of 3.5% (Figure 2A), which indicated that the method was reproducible and that there were minimal errors. The concentration-dependent or time-dependent linear relationship was good with an R2 (Goodness of Fit) greater than 0.95 (Figure 2B and C). It took 32 min for 1 mL of 7% alcohol to evaporate and fill the gas cylinder (Figure 2D). The uniform and relatively slow bolus injectors had minimal errors, as shown in Figure 2E and F. A 7% alcohol solution was double-diluted until nothing could be detected, with a minimum detection limit of 0.15%.
Reproducibility, precision, linearity, and feasibility of the method. A, Coefficient of variation; B, Time dependence; C, Concentration dependence; D, Time to fill the gas cylinder. At different time intervals, the gas was drawn from the mouth of the gas collecting bottle for detection. After 32 min, the gas collecting bottle was full; E, When the syringe plunger was depressed at a constant rate, the measured value was higher and the coefficient of variation was smaller than that depressed at a non-constant rate; F, Depressing the syringe plunger slowly and smoothly resulted in a small coefficient of variation.
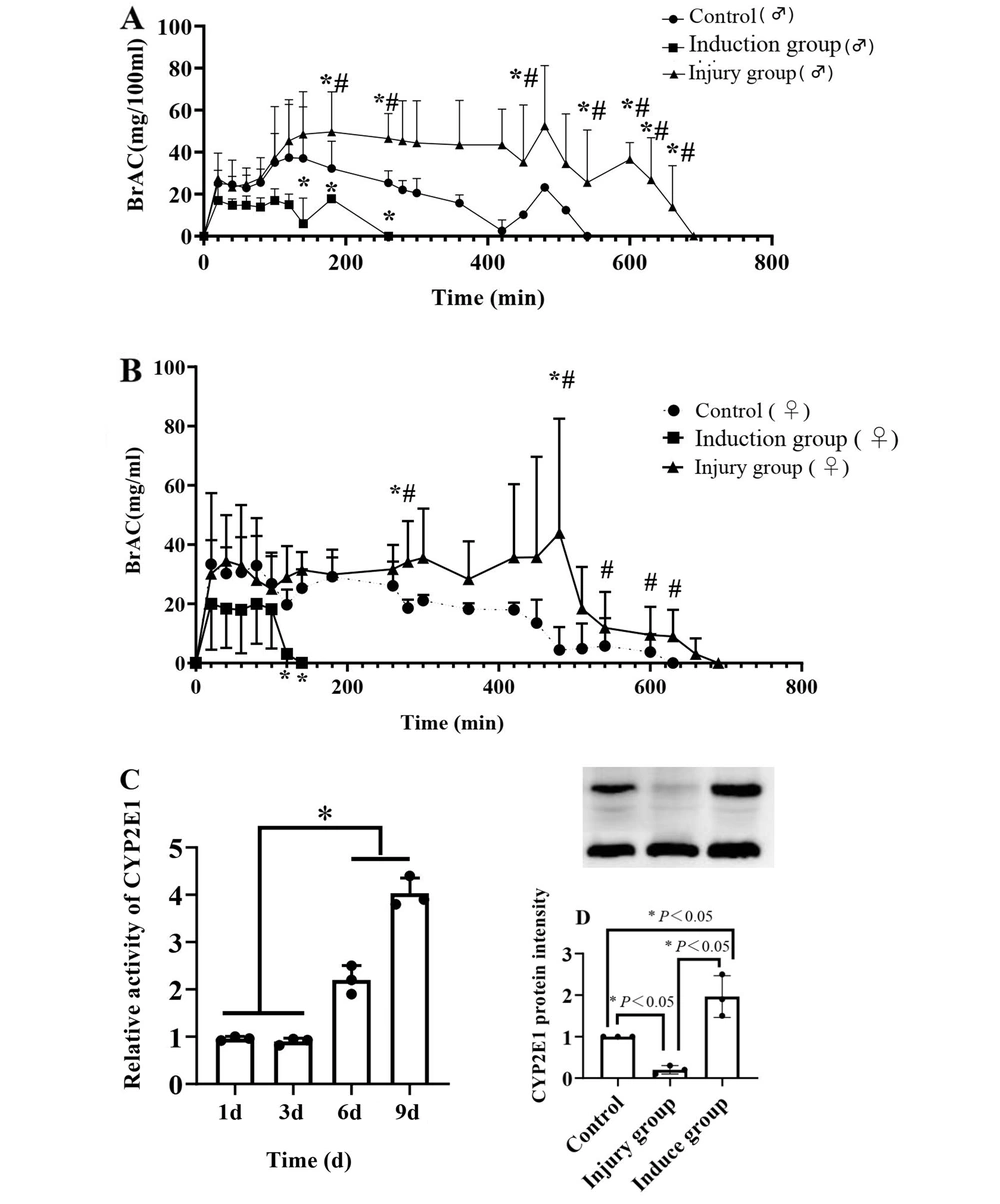
The effect of different liver pathophysiological states on the activity of alcohol metabolism was detected by measuring the alcohol metabolism activity of rats in the normal, liver injury, and liver drug enzyme-induced groups. The alcohol gavage dose of 42% alcohol 10 mL/kg showed that alcohol metabolism in the liver drug-enzyme induction group was significantly accelerated, metabolism in the liver injury group was significantly reduced, and the normal group had an intermediate level (Figure 3A and B). CYP2E1 metabolic activity was determined by evaluating the AUC value. The activity of CYP2E1 increased in the induction group, but decreased in the injury group (Figure 3C). The expression of CYP2E1 protein was detected by western blotting, and a trend similar to that of metabolic activity was observed (Figure 3D). The pharmacokinetic professional analysis software DAS3.0 was used for fitting and analysis, and the parameters of alcohol metabolism were obtained. The blood alcohol values AUC and R of the rats in the injury group were significantly increased, whereas the values in the induced group were significantly decreased, and those in the control group were at the intermediate level. The lesion clearance rate decreased and then increased in the induced group and was at an intermediate level in the control group (Table 1).
BrAC, CYP2E1 metabolic activity and protein expression changes. A and B, Temporal changes in BrAC in male and female rats; C, Changes in metabolic activity of rat CYP2E1 over a period of time; D, Rat CYP2E1 protein expression (A and B, Compared with the blank control group, *P < 0.05, compared with the induction group, #P < 0.05). (C and D, the * on the horizontal line indicates the comparison between the two groups, P < 0.05).
| Male or Female Rats (Gender) | Pharmacokinetic Parameters | Blank Group | Induction Group | Injury Group |
|---|---|---|---|---|
| Gender | ||||
| Male | AUC (0-t)/ug/L.min | 10390.58 ± 2473.14 | 2854.25 ± 1914.94 a | 23021.25 ± 6186.59 b, c, d |
| Female | AUC (0-t)/ug/L.min | 11517.03 ± 2458.26 | 1955.3 ± 1101.25 a | 17896.08 ± 5585.19 b, c, d |
| Gender | ||||
| Male | MRT (0-t)/min | 197.17 ± 25.01 | 100.40 ± 47.89 a | 289.65 ± 66.96 b, c, d |
| Female | MRT (0-t)/min | 227.22 ± 23.25 | 68.8746 ± 8.71 b | 284.57 ± 82.62 c, d |
| Gender | ||||
| Male | CLz/F/L/min.kg | 423.37 ± 103.12 | 1873.91 ± 785.83 a | 193.24 ± 52.88 c, d |
| Female | CLz/F/L/min.kg | 306.15 ± 116.26 | 2186.56 ± 659.91 b | 190.88 ± 72.37 c, d |
a Compared with blank control group, P < 0.05.
b Compared with blank control group, P < 0.01.
c Compared with induction group, P < 0.05.
d Compared with induction group, P < 0.01.
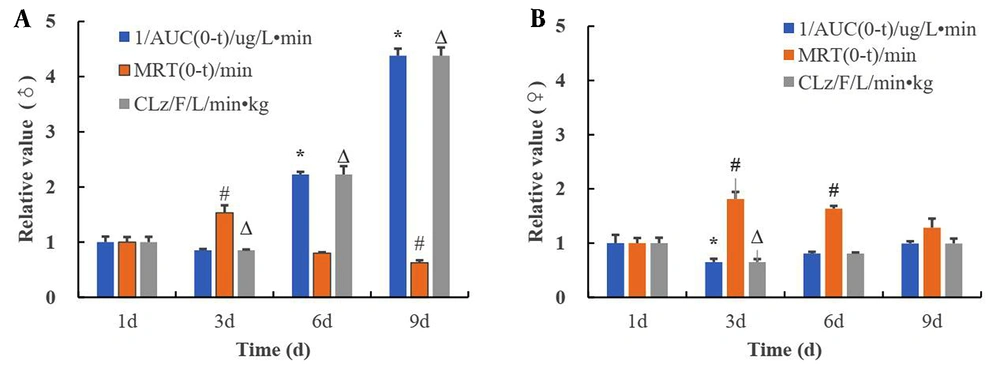
To analyze the temporal changes in the induction effect of alcohol on CYP2E1, alcohol was administered by gavage on day one, three, six and nine of the experiment, at a dose of 42% alcohol 10 mL/kg. Time-dependent changes in BrAC were detected, and the metabolic kinetic parameters AUC (0-t), MRT (0-t), and CLz/F were calculated. The metabolic kinetic parameters on the first day were weighted to obtain the corresponding time-dependent changes in the CYP2E1 metabolic parameters (Figure 4). The inverse of AUC was positively correlated with metabolic activity, indicating the strength of metabolic activity. The 1/AUC and CL of male and female rats decreased slightly at three days, and gradually increased on day six and day nine. Male rats were more significantly induced than female rats. The MRT increased minimally on day three, and gradually decreased on day six and nine. This indicated that alcohol could induce the metabolic activity of CYP2E1 (Figure 4A and B).
Time-dependent changes in alcohol metabolism parameters. A, Alcohol metabolism kinetic parameters in male rats; B, Alcohol metabolism kinetic parameters in female rats (compared with the AUC of 1 d, *P < 0.05, compared with the MRT of 1d, #P < 0.05, compared with the CLz of 1 d, ΔP < 0.05).
4. Discussion
The main finding of this study was the establishment of a laboratory method for breath alcohol testing in rats that is relatively accurate, non-invasive, simple, and allows for multiple measurements. A gas collection bottle was used to accumulate alcohol gas, and a syringe was used to collect the breath samples. This method resolved the challenges faced while using the police breath alcohol detector for detecting breath alcohol concentrations in rats. The rats were not restricted to gas collection bottles and were allowed to move freely, which is closer to the detection of the free state and more in line with the requirements of metabolic dynamics. The precision, linearity, and reproducibility of the procedure were acceptable. The breath alcohol detector has been used for detecting drunk driving for many years (13-15). Alcohol concentration was measured and accurately reflected the blood alcohol concentration. The alcohol concentration has been written in the law as a traffic police detection index. The high inconsistency in the concentrations was not a problem in this study. The procedure established in this study, such as determination of alcoholic liver injury, can be used in scientific research.
To further demonstrate the reliability, simplicity, and feasibility of this method, a protocol was designed for the detection of end-tidal alcohol concentrations in rats when the liver is in different pathophysiological states. The test results were in agreement with the intent of our design. The detected breath alcohol concentration time curve is consistent with the blood alcohol time curve (16, 17), and the AUC (0-t), MRT(0-t), and CLz/F in the alcohol kinetic data reflect the level of alcohol in the body and the rate of alcohol metabolism. The change curve of end-tidal blood alcohol concentration over time and pharmacokinetic parameters showed that alcohol metabolism in the liver drug-enzyme-induced group was significantly enhanced, alcohol metabolism in the liver injury group was significantly decreased, and in the normal control group was at an intermediate level. The main liver drug enzyme CYP2E1 was detected in liver alcohol metabolism by western blotting, and we showed that this trend was consistent with the breath alcohol detection data. Metabolic enzyme expression was consistent with that in previous reports (18, 19). This study showed that in addition to CYP2B, phenobarbital sodium significantly induced CYP2E1, which was consistent with the results of the study by Yamauchi et al. (20). Small doses of CCl4 have been repeatedly administered to induce CYP2E1 (21). In this study, large doses were used to induce acute liver injury, and CYP2E1 metabolic activity and protein expression were downregulated. Compared to the detection of blood alcohol concentration by gas chromatography, our method is simpler, does not require a gas chromatograph, and can be used in vivo (non-invasively) for an unlimited number of data collection tests. In particular, we detected time-dependent changes in the alcohol-induced effects in rats. On days one, three, six and nine of the experiment, time-dependent changes were detected in the blood alcohol concentration of the rats in vivo, and the metabolic activity of metabolic enzymes gradually increased. Gas chromatography does not permit researchers to observe the induction of metabolic enzymes because changes in blood concentration over time cannot be detected. Gas chromatography requires blood sampling, causes trauma, has limited blood sampling points, and a single rat can be monitored. Only one point can be plotted for blood alcohol concentration over time.
Interestingly, the sexes of the rats had different responses to the drugs evaluated in this study. Female rats were more sensitive to liver drug enzyme inducers, whereas male rats were more sensitive to CCl4 liver injury. Female rats were more susceptible to CCl4 liver injury. Dynamic changes in CYP2E1 metabolic enzymes were also observed in several cases of liver diseases (22), whereby gas chromatography-based blood samples were used for the experiments. As mentioned previously, gas chromatography samples are difficult to obtain because of the trauma caused by blood collection. The breath alcohol detection method in rats using gas cylinders proposed in this study successfully solves this challenging issue.
The reproducibility and precision of this procedure meet the requirements of scientific research and can be used for the detection of alcohol concentration and metabolic activity in the body related to alcohol injury; however, there are limitations. The lung capacity of rats is only 1 mL, which makes it difficult to meet the gas volume requirements of breath alcohol detectors. Thus, a gas collection bottle was used for the accumulation, and the test was performed. When the alcohol concentration in the body was too low, the final decay in a linear relationship was difficult to perform, which impacts the data, as the last three points of the blood alcohol concentration time curve are important data for calculating the half-life. However, the rate of metabolism was described by the clearance rate and retention time in the body, and the rates of alcohol metabolism in different intervention groups were compared. Compared with other similar devices (23, 24), this device does not restrict the activities of rats and is easier to operate, and the results can be obtained immediately.
4.1. Conclusions
In conclusion, the rat breath alcohol test is an accurate, convenient, and non-invasive laboratory method for estimating blood alcohol concentration from BrAC. Importantly, this method is useful for studies that require repeated assessments of alcohol levels, in which other assessment methods are prohibitive. Finally, it is possible to adjust the device to estimate BAC in other species, such as mice.


