1. Background
There are annually more than 1.93 million newly reported cases of colon cancer worldwide. Colon cancer is the third most common cancer in the world (https://www.who.int/news-room/fact-sheets/detail/cancer). A wide variety of genetic, environmental, and nutritional risk factors have the potential to lead to colon cancer. This disease is initially present in polyps at the intestinal wall, primarily from the large intestine's inner wall. Polyps are generally not cancerous but may become cancerous (1). Chemotherapy, radiation therapy, surgery, and immunotherapy are traditional methods of treating cancer (2, 3). Chemotherapy is usually the primary method. Sometimes, cancer cells become resistant to chemotherapy. This issue may present a major challenge for the treatment of cancer patients in the future (4). Most chemical anti-cancers have toxic side effects in patients that lead to vomiting, loss of appetite, anemia, hair loss, bruising, and bleeding (5). As regards these problems, the discovery or design of new molecules of low toxicity is of considerable clinical significance (6). Peptides and proteins may be more selective than chemical agents and induce the lowest toxicity in cells/tissues (7). Among natural resources, animal venoms are a valuable source of new drug discovery (8, 9). Over the past decade, anti-cancer peptides (ACPs) have successfully presented themselves as potential pharmaceutical lead with respect to their low toxicity compared to chemical agents (7, 10). During the past decades, snake venoms (i.e., Naja atra, Naja kaouthia, Naja sumatrana, Ophiophagus Hannah, Naja Haje, Naja oxiana) have been shown that some toxins of Naja species exert anti-cancer activity on different cancerous cells (11, 12). Ebrahim et al. characterized two cytotoxins, CTX-I and CTX-II, from the venom of Naja naja oxiana. Both compounds had an anti-cancer effect on four HepG2, MCF7, P, and DU145 cancer cell lines. These two anti-cancer molecules were obtained using IEX and HPLC chromatography (12).
2. Objectives
The present study aimed to identify an anti-cancer protein from the Iranian Caspian cobra venom against a human colon cancer cell line.
3. Methods
3.1. Materials, Cells, and Media
The venom of the Caspian cobra was obtained from the Pasteur Institute of Iran, Tehran. 3-(4,5-Dimethyl-2-thiazolyl)-2,5-diphenyl-2H-tetrazolium bromide (MTT) and DMSO were purchased from Sigma (Saint Louis, MO, USA). RPMI medium and fetal bovine serum (FBS) purchased from Gibco, Life Technologies (Grand Island, NY, USA). The cancer cell line of SW480 was obtained from the National Cell Bank of Iran (Pasteur Institute of Iran, Tehran-Iran). Trypsin, ammonium acetate, NaCl, Tris buffer, Dialysis tube, Coomassie blue G250, Polyacrylamide, Propidium iodide, LDH release kit, PBS (phosphate buffer saline) were bought from Sigma (Saint Louis, MO, USA).
3.2. Venom Purification
The amount of 500 mg lyophilized cobra venom was dissolved in ammonium acetate (20 mM, pH 7.4) and loaded onto a Sephacryl S200 gel filtration chromatography column (GE Health care, USA). The column was previously equilibrated with ammonium acetate (20 mM, pH 7.4). Chromatography was performed by using an FPLC instrument (Akta Purifier 10, GE, USA), and the fractions were collected manually at a flow rate of 1 ml/min, and the peaks were observed at 214 and 280 nm. For the concentration of fractions obtained by gel filtration chromatography, lyophilization was performed using a freeze-dryer (Christ, Germany).
According to the manufacturer's protocol, protein concentration was measured using the Smart BCA Assay kit (Intron, Korea). SDS-PAGE was performed using 12% polyacrylamide gel. The specimens were electrophoresed for 3 hours at 30 mA (Bio-Rad-USA). The gel was stained with Coomassie blue G250.
3.3. Cell Viability Assay
The cells were cultured in RPMI 1640, with L-Glutamine (Gibco, USA), 10% FBS (Fetal Bovine Serum), and 1% Pen / Strep and incubated in the atmosphere containing 5% CO2 at 37°C for overnight.
The cells were trypsinized, and 30,000 cells were seeded in each well (96 well microplate, Jet Biofil, China) and treated with different concentrations (0.7 - 50 µg/ml from SEC, 0.3 - 40 µg/ml from IEX) of the fractions obtained from gel filtration chromatography.
After 24 h, the supernatant was drained, and the MTT (3-(4,5-Dimethylthiazol-2-Yl)-2,5-Diphenyltetrazolium bromide) solution was added to each well. The MTT solution was discarded after four h, and DMSO (Dimethyl Sulfoxide, 100 µL) was added and incubated for 15 min with shaking. The OD of wells was measured using a microplate spectrophotometer (Epoch, Biotek Instruments, USA) at 570 nm wavelength. HEK-293 cell line was used for controlling the toxicity of the candidate fraction. The following formula gives the percentage of cytotoxicity:
3.4. Ion Exchange Chromatography
In the next stage, the toxicity of fractions was examined on SW480 colon cancer cells.
The fraction with the most cytotoxicity was selected for further purification by anion exchange chromatography.
The column (High prep HR, GE Healthcare, USA) was equilibrated with starting buffer (Tris 20 mM, pH 7.5). The candidate fraction was injected into the column, and elution was done at a flow rate of 1.0 ml/min with a linear gradient of NaCl (1 M).
The desalting process and concentration were performed using a dialysis tube (3 kDa, Millipore, USA).
3.5. Characterization and Identification of Oxilipin
LC-MS was performed to determine the mass of the candidate protein (Proteomics International Co., Australia). TOF MS spectra were searched using the Mascot database search engine against the NCBI nr protein database.
3.6. Morphological Analysis
The cells were cultured in 96-well plates at 3 × 10⁴ cells per well and incubated overnight. The cells were exposed to different concentrations (0.3 - 40 µg/ml) of Oxilipin for 24 h. After discarding the medium, the cells were washed once with normal saline, observed using a phase contrast inverted microscope (Bell, Italy), and photographed with a digital camera (Sony, Japan) at 40 × magnification.
3.7. Propidium Iodide Staining
A propidium iodide (PI) staining test was carried out to quantify the apoptotic cells. Cells were seeded in 96 microplates and treated with various concentrations (0.3 - 40 µg/ml) of Oxilipin. After 24 h, the wells were drained and washed with PBS, then two µL of PI was added into each well, incubated at 37ºC for 30 minutes, and the cells were analyzed using a fluorescent microscope (Bell, Italy).
3.8. Toxicity Assays
3.8.1. Toxicity on Normal Cells
Using the MTT assay as mentioned above, the toxicity of Oxilipin was evaluated on HEK-293 as a normal cell and compared with cancer cells. Cancerous and normal cells were treated with Oxilipin at concentrations ranging from 40 - 1 µg/ml for 24 h; under the same conditions and incubation time as detailed above.
3.8.2. Hemolysis Assay
Hemolytic assays were performed as previously described (13). Briefly, whole human blood was collected from a healthy adult, centrifuged at 664×g for 5 min, washed with PBS (1×, pH 7.4) three times, and finally, RBCs suspension (2%) was prepared with PBS (1×, pH 7.4). Serial dilution of the peptide was prepared from 40 to 0.125 µg/ml, and 100 µL of washed RBCs suspension (2%) was added to each well (96-well microplate, Nunc, Sigma Co., St. Louis, MO, USA). Phosphate buffer saline (1×, pH 7.4) and Triton X-100 (0.1%) were used as a negative and positive control, respectively.
The microplate was incubated at 37°C for two h and centrifuged at 1664 × g for 10 min.
The optical density of the wells was measured at 540 nm using a microplate spectrophotometer (EPOCH, BioTek, Winooski, VT, USA).
This assay was performed in triplicate. The degree of hemolysis was calculated using the following formula:
3.8.3. Lactate Dehydrogenase (LDH) Release Assay
A number of 30,000 cells were transferred into each well. After incubation O/N, the medium was replaced with serum-free medium, and various concentrations of Oxilipin (0.3 - 40 µg/ml) were added to each well. Untreated cells were used as negative, and the cells incubated with 0.1% (v/v) of Triton X-100 were used as a positive control. After 24 h, the activity of the lactate dehydrogenase enzyme was measured in the supernatants using the in-vitro assay kit (Pars Azmoon Test, Iran-Tehran) according to the manufacturer’s protocol.
3.9. Statistical Analysis
The tests were performed in triplicate, and results were reported as the mean ± SD. The significance of differences between means was evaluated by the analysis of variance (ANOVA) test followed by Student’s t-test when various experimental groups were compared with the control group. The confidence limit for significance was 5%.
4. Results
4.1. Purification of Crude Venom by Gel Filtration Chromatography
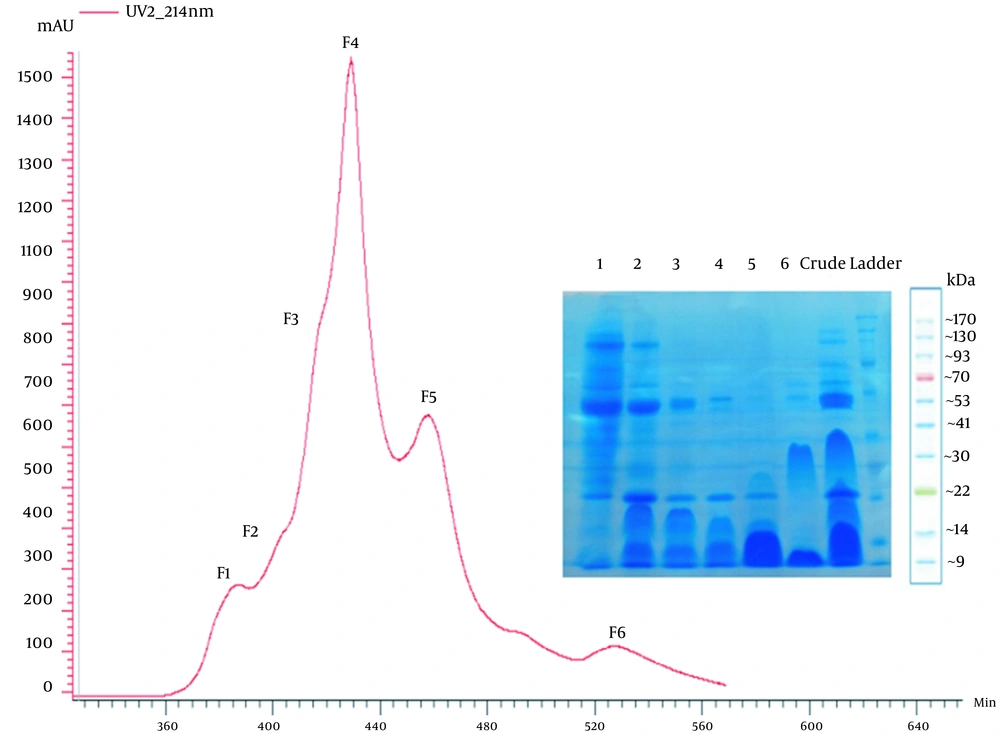
From gel filtration chromatography of the Caspian Cobra crude venom, six fractions were obtained (F1-F6) Figure 1.
4.2. MTT Assay
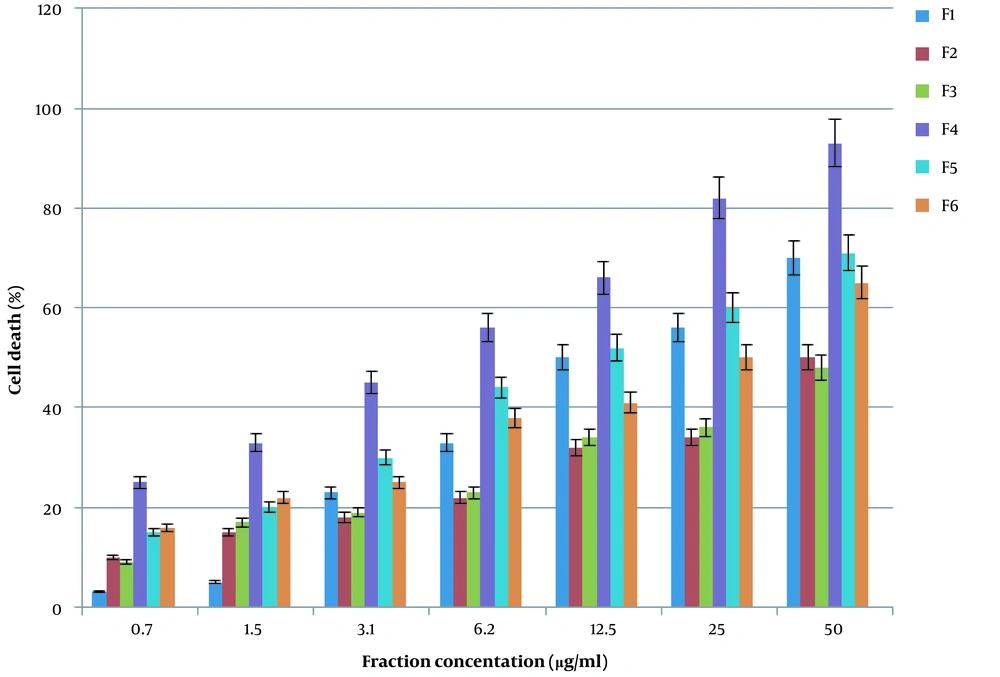
The colon cancer cells were treated with different concentrations of gel filtration-derived fractions (F1-F6) for 24 h. The MTT assay showed that F4 inhibits cell proliferation (90%), as shown in Figure 2.
4.3. Purification of F4 by Anion-Exchange Chromatography
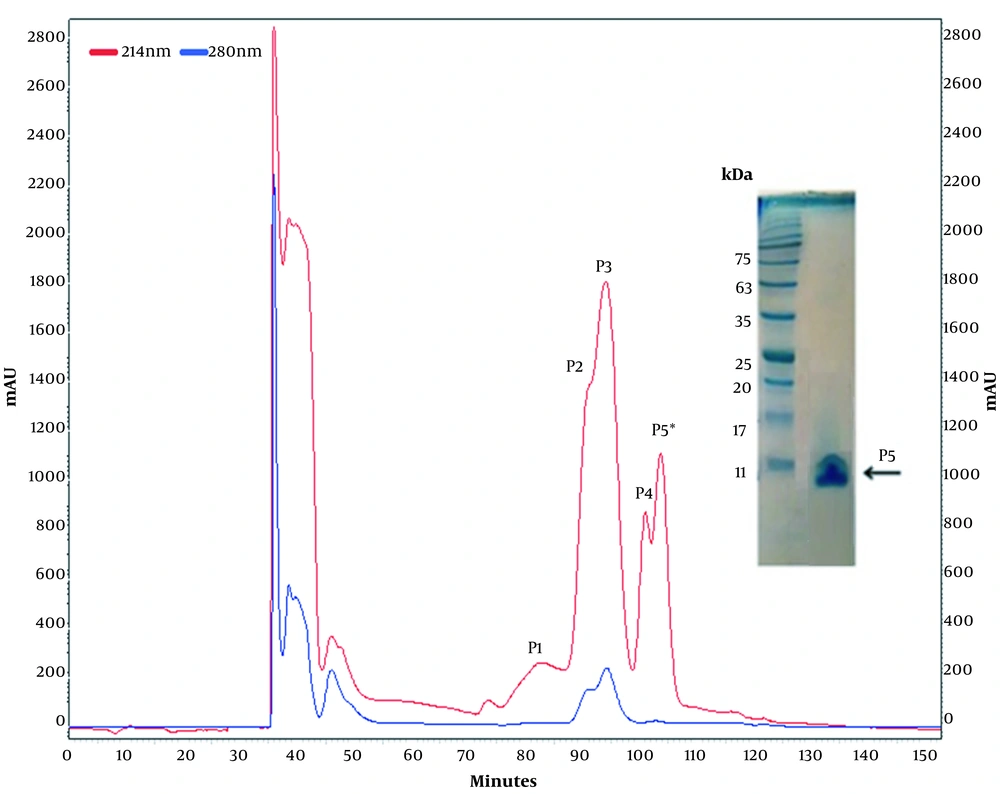
The most toxic fraction was obtained from gel filtration (F4), applied to anion-exchange chromatography (Figure 3). Peak 5 had the highest anti-cancer activity and was selected for further biological activity assays.
4.4. Determination of the Toxicity of Ion Exchange-derived Fractions on Cancer Cell
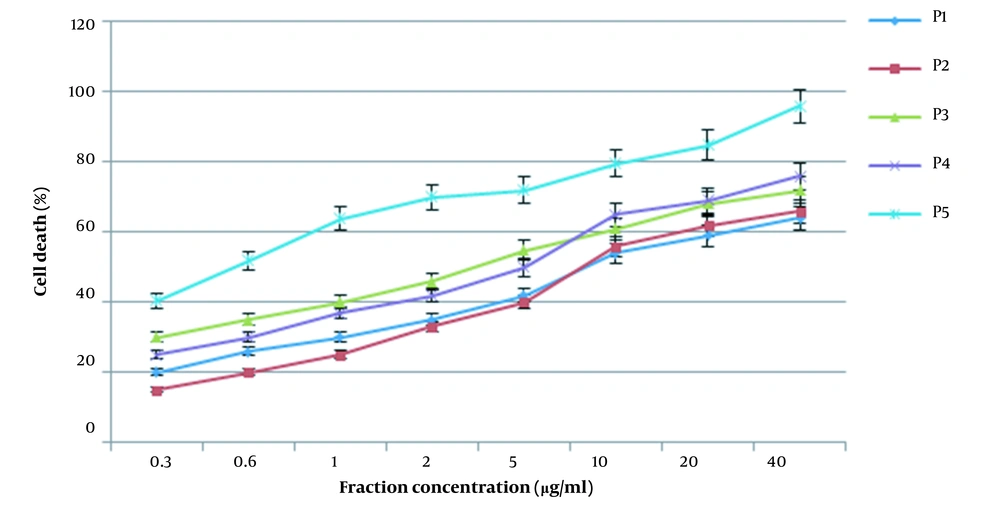
The cells were treated with different concentrations of the fractions (P1-P5) for 24 h. At the end of the incubation time, viability was determined by the MTT assay. As seen in Figure 4, the highest mortality rate belongs to P5.
Dose-response cell viability curves of IEX fraction in SW480 cells. The cells were treated with different concentrations of IEX fractions for 24 h, and at the end of the incubation time, cell viability was determined by the MTT (3-(4,5-dimethylthiazol-2-yl)-2,5-diphenyltetrazolium bromide) reduction assay.
4.5. Partial Characterization of Oxilipin
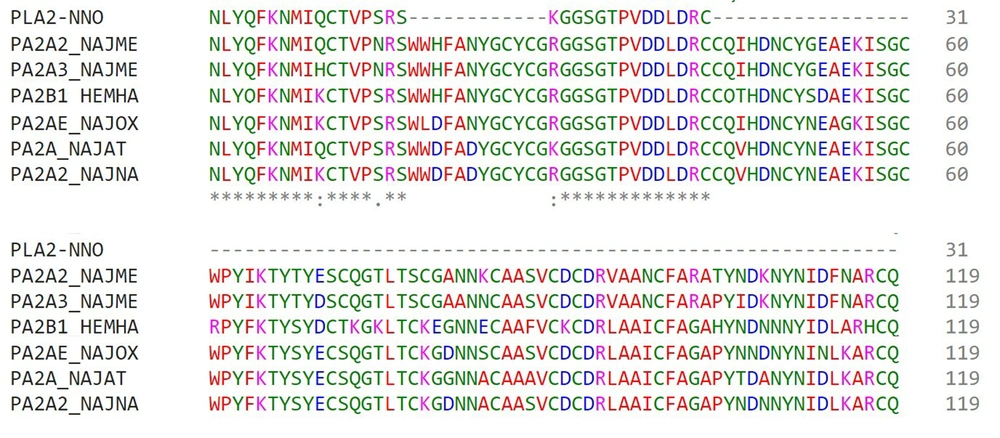
The molecular mass of Oxilipin determined by LC-MS was found to be 11 kDa. MS/MS spectra of Oxilipin were searched against the NCBI nr protein databases using the Mascot database search engine. The list of toxins having homology with Oxilipin is detailed below: (Figure 5).
Sequence multiple alignments of Oxilipin. Multiple alignments of the peptide fragments of Oxilipin against complete deduced amino acid sequences of similar proteins from the Cobra genus were performed using the CLUSTALW program. Bold letters indicate identical amino acid residues. PA2A2-NAJME (Ac.No. P00600, Acidic phospholipase A2 DE-II, Naja melanoleuca), PA2A3-NAJME (Ac. No. P00601, Acidic phospholipase A2, Naja melanoleuca), PA2B1-HEMHA (Ac.No. P00595, Hemachatus haemachatus, Basic phospholipase A2), PA2AE-NAJOX (Ac. No. P25498, Acidic phospholipase A2, Naja oxiana), PA2A-NAJAT (Ac. No. A4FS04, Acidic phospholipase A2 natratoxin, Naja atra), PA2A2-NAJNA (Ac. No. P15445, Acidic phospholipase A2, Naja naja).
4.6. Morphological Analysis
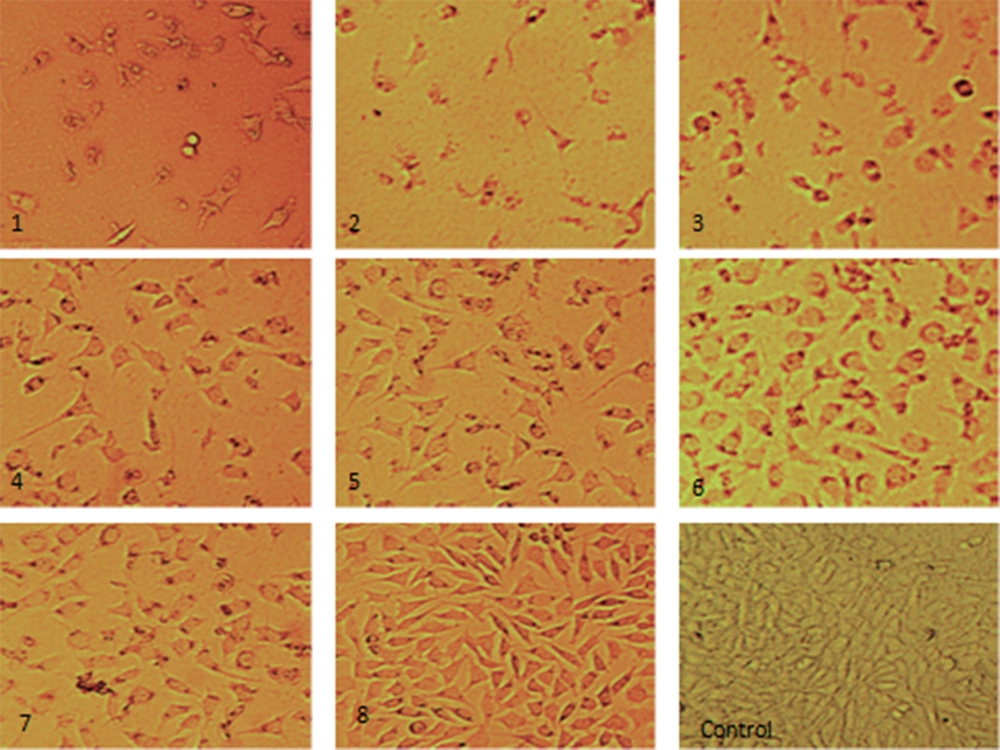
In order to assess the effect of Oxilipin on cell morphology, the treated cells were observed by inverted light microscopy. Rounding, cytoplasmic blebbing, and irregularity in shape were considered significant changes compared to control cells (Figure 6). A significant decrease in cell count was seen by increasing Oxilipin concentration and time of exposure.
4.7. PI Staining
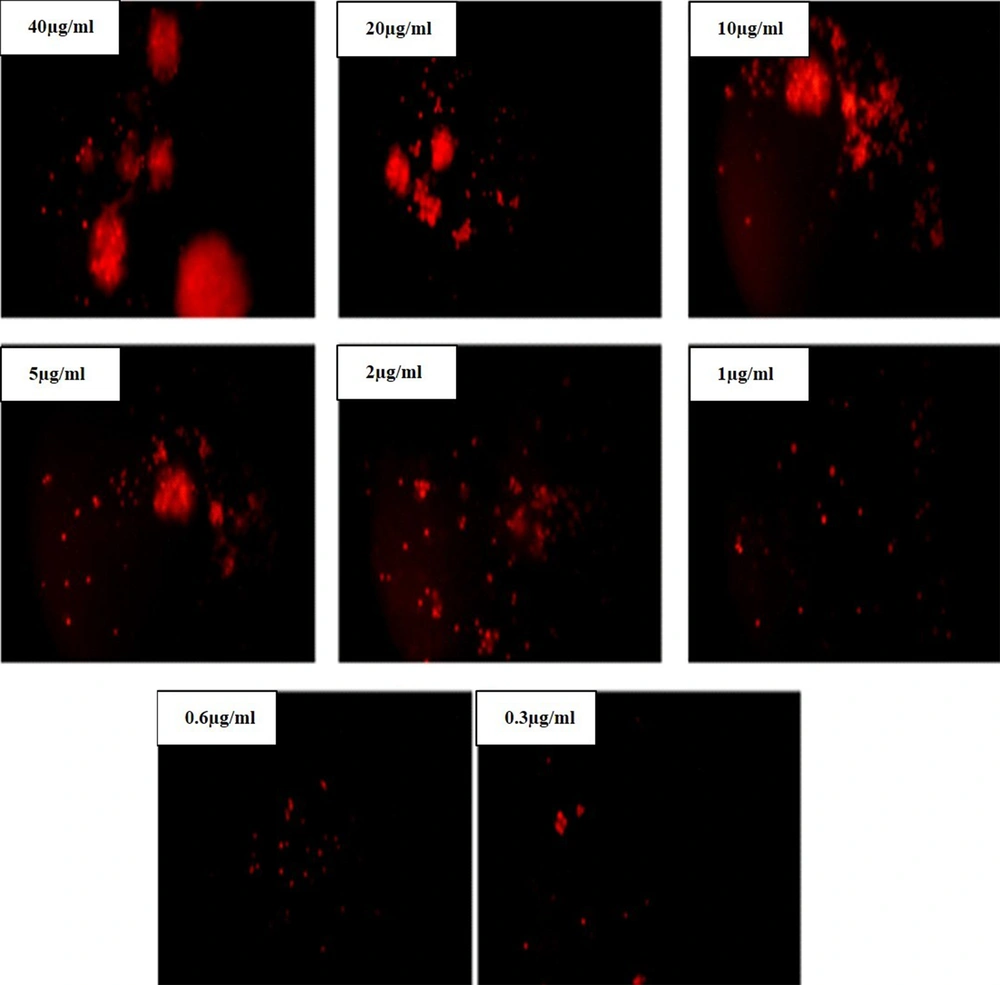
Using fluorescence microscopy, 200 cells were counted arbitrarily and compared to the untreated negative control. The results revealed that Oxilipin induced morphological alterations that relate to apoptosis in a dose-dependent manner.
In the fluorescent microscope images, the highest intensity in the color indicates the death of the majority of cancer cells due to exposure to Oxilipin (Figure 7).
4.8. Toxicity Evaluation of Oxilipin on HEK-293 Cells
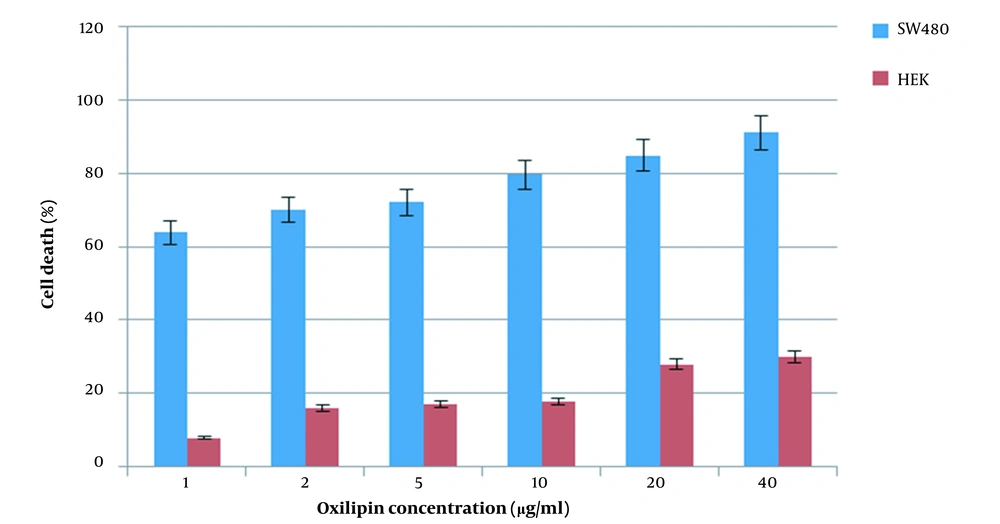
After treatment of cancerous and normal cells with Oxilipin for 24 h, it was found that the toxicity of Oxilipin on HEK-293 cells at one µg/ml was eight times lower than that of cancer cells under the same conditions and incubation time (Figure 8).
4.9. Hemolysis Assay
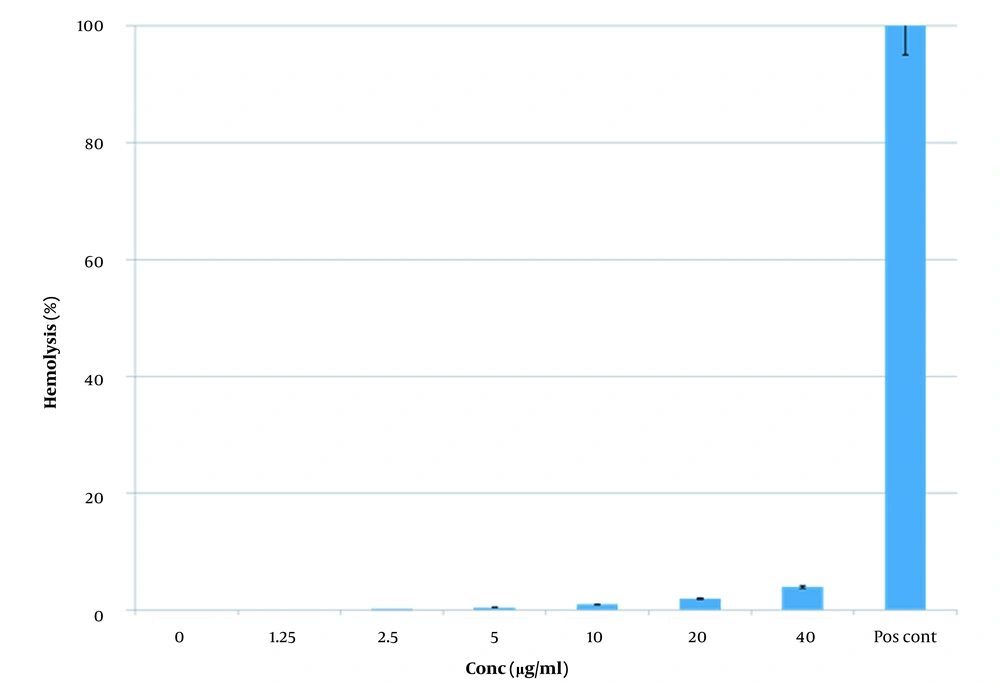
Comparing the results between the test and control group showed no macroscopic hemolysis. Spectrophotometry measures showed no hemolysis, too (Figure 9).
4.10. Lactate Dehydrogenase Release (LDH) Assay
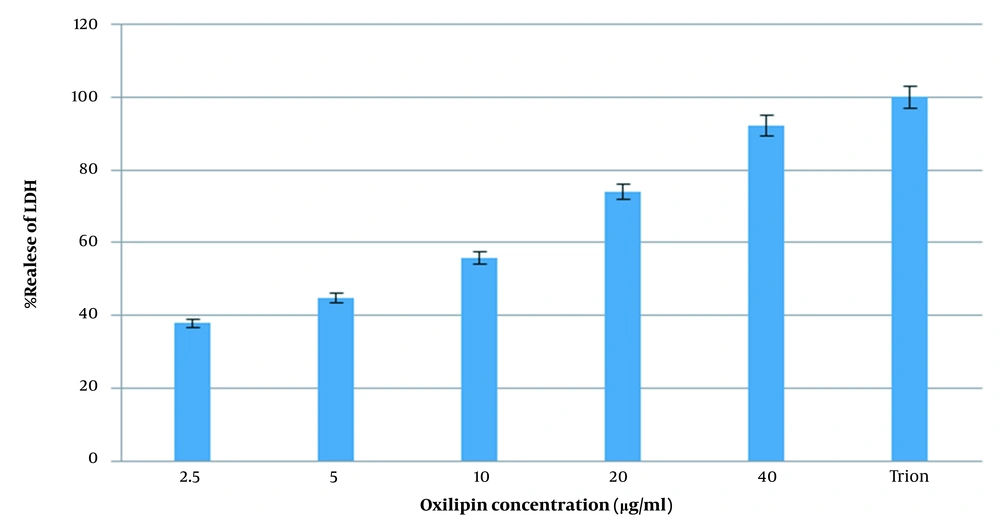
For the study of the lytic behavior of Oxilipin, the cancer cells were treated with different concentrations of the protein. Results are presented in Figure 10. A dose-dependent increase in LDH release was seen in treated cells. The maximum release was seen at 40 µg/ml. This increase was significantly higher than the negative control group (untreated cells) and lower than the positive control group (Triton-exposed cells) (P-Value ≤ 0.05).
The evaluation of LDH leakage in SW480 cells. The cells were treated with different concentrations of Oxilipin for 24 h. At the end of the incubation period, the LDH assay was performed to assess the LDH leakage. A dose-dependent increase in LDH release was seen in treated cells. The maximum release was seen at 40 µg/ml.
5. Discussion
Snake venom is a mixture of enzymes, peptides, carbohydrates, minerals, and low molecular weight proteins with diverse biological activities (14, 15). Snake venom components can be used for cancer treatment, arthritis, thrombosis, multiple sclerosis, pain, musculoskeletal disorders, and cardiovascular diseases (16, 17). The compounds found in snake venom tend to degrade cancerous cells (18).
In the present study, we identified a new PLA2-like protein with 11 kDa by using gel filtration and ion-exchange chromatography (IEX) and named it Oxilipin. Homology analyses using blastp and multiple alignments showed that Oxilipin has considerable similarity with other cytotoxins, i.e., in the venom of other cobra snakes.
The gel filtration chromatography of cobra venom showed six fractions, from which fraction 4 (F4) had the greatest cytotoxicity effect on colon cancer cells when applied to MTT assay. It showed that 50 µg/ml of F4 caused 90% cytotoxicity in cancer cells. Other fractions had a minor effect on cancer cells compared to F4 (P ≤ 0.05). Further purification of fraction four was performed by anion exchange chromatography, and five peaks were obtained. Among the obtained peaks, peak 5 (P5) had the most deleterious effect on colon cancer cells. The 40 µg/ml concentration of Oxilipin showed a 90 % cytotoxicity effect on SW480 colon cancer cells.
The results were consistent with the previous studies on CTX-I and CTX-II toxins from the venom of Naja naja oxiana (12). It was reported that cardiotoxin-III, a basic polypeptide with 60 amino acid residues present in Naja naja atra venom, possesses anti-cancer activity on K562 and HL-60 cells (19, 20). Two cytotoxins (drCT-I and drCT-II) that were purified from the Indian Viper (Daboia russellii russellii) venom showed potent anti-cancer activity in vivo and in vitro (21). Zakraoui proposed that Lebein from the Macrovipera lebetina venom can inhibit cell proliferation and angiogenesis by blocking the cell cycle, stimulating apoptosis, and inhibiting expression (22). Ebrahim et al. showed that the crude venom of Naja naja oxiana could induce apoptosis on HepG2, MCF7, and DU145 cancer cell lines and has the lowest effect on normal cells, MDCK. They showed that treatment of HepG2 cells with snake venom toxin (SVT) at concentrations below 15 µg/ml induces more apoptotic cells than necrotic death (23).
Since this study aimed to achieve proteins with the lowest toxicity effect on normal cells, an MTT assay was performed the determination of the toxicity of Oxilipin in the same conditions as cancer cells, and it was observed that Oxilipin had the least toxic effect on normal cells. A hemolysis assay was performed to investigate the toxicity of Oxilipin on red blood cells. It was observed that Oxilipin produced no hemolytic effects on red blood cells. Given that Oxilipin had low toxicity to normal cells and the absence of any hemolytic effect on red blood cells, it can be hypothesized that Oxilipin has the potential for the treatment of cancer.
LDH is an enzyme that is relatively stable and is widely used to evaluate the percentage of tissue damage and cell toxicity (24). Oxilipin can stimulate the release of LDH in SW480 colon cancer, and the result indicates the cytotoxic effect of Oxilipin on colon cancer cells. We found that 0.3 µg/ml of Oxilipin can induce cytotoxic effects on colon cancer cells. The result is consistent with the results obtained by CTX-I and CTX-II done by Ebrahim et al. from N. oxiana venom (12), and the difference is that the effective concentration used in our studies is much less than the amount expressed in the latter one.
Analysis of the results showed the candidate dose at the concentration of 1 µg/ml in which the toxicity of Oxilipin on cancer cells was 8-fold more than normal cells.
The results obtained from the PI staining assay indicated the induction of apoptosis by Oxilipin in colon cancer SW480 cells.
5.1. Conclusions
The Oxilipin molecule had significant anti-cancer activity on colon cancer with minimum effect on normal cells. Regarding the slight toxicity of Oxilipin on normal cells, it can be suggested as a drug lead in an animal model of colon cancer.

