1. Background
Cancer is one of the significant challenges in today's world. American Institute for Cancer Research (AICR) has reported that the most prevalent types of cancer are lung cancer (the most widespread in men) and breast cancer (the second most common type and the most frequent in women) (1, 2). Conventional anti-cancer chemotherapies mainly cause adverse side effects like immunosuppression and a significant increase in drug resistance (3-7). In addition, the consequences of some types of cancer lower the quality of life (8-10). Therefore, attempts to identify new targets and novel medicines have continued (11).
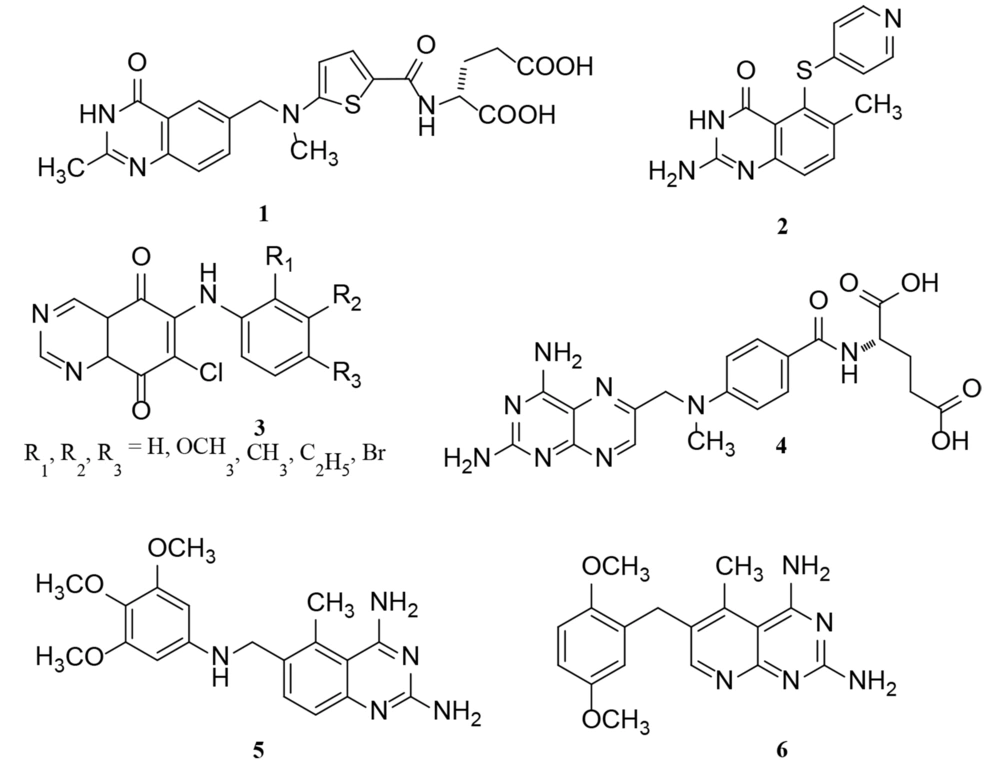
Studies have shown that the signaling of epidermal growth factor receptor (EGFR) possesses an influential role in the progression of various types of tumors, such as epidermal cancers as prevalent types of cancer (12, 13); hence, the inhibition of EGFR could be considered a promising target for cancer therapy (14-20). Quinazoline scaffold is one of the main categories of heterocycles with diverse biological activities in medicinal chemistry (21). Previous studies have shown that quinazolines could inhibit EGFR tyrosine kinase overexpression by restraining autophosphorylation in EGFR and EGF-stimulated signal transduction (22, 23). Also, this scaffold shows antitumor activity by restraining the DNA repair enzyme system (23-25). As shown in Figure 1, there are some clinical medicines as antitumor agents with quinazoline or bioisosteres of the quinazoline ring, demonstrating the role of quinazoline in cancer therapy (23, 26).
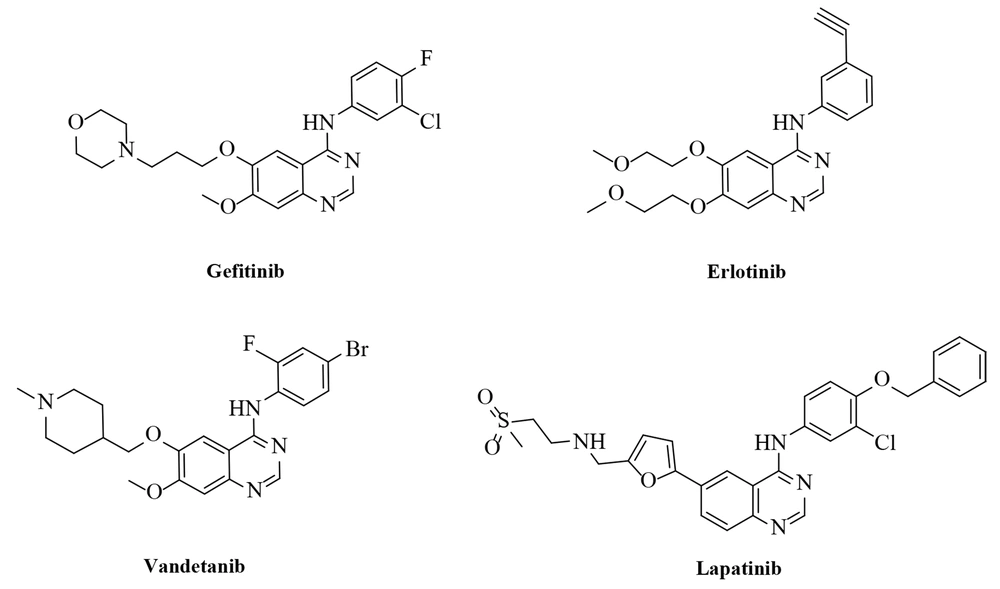
In addition, there are many EGFR inhibitors as anti-cancer agents in the market, such as Gefitinib (IressaTM), Erlotinib (TarcevaTM), lapatinib (TykerbTM, also known as GW-572016), and vandetanib (ZactimaTM) with quinazoline scaffold (Figure 2) (27-30). In some studies, in silico methods were applied to obtain more details about the binding mode of an inhibitor to the EGFR- tyrosine kinase (TK) enzyme at the atomic level (31-33).
2. Objectives
In this study, a novel series of compounds with quinazoline ring were designed, synthesized, and in-vitro evaluated for the antitumor activity against three different cell lines: MCF-7 (breast cancer), HT-29 (colon cancer), and A-549 (lung cancer). The compounds' cytotoxicity mechanism was investigated using the EGFR-TK kit enzyme. In addition, molecular docking and molecular dynamics simulations were applied to obtain molecular details about EGFR-TK inhibitors' interactions.
3. Methods
3.1. General
All the purified chemicals and solvents in this research were purchased from Aldrich, Acros, and Merck companies. Melting points were taken by Thomas-Hoover capillary instrument. Infrared spectra were recorded in the ʋmax (cm-1) scale by Cary 630 FTIR spectrometer using KBr pellets for solid samples. NMR spectra were recorded in ppm (δ) scale and taken by Bruker DRX-500 Avance using trimethylsilane (TMS) as the standard internal reference and CDCl3 and DMSO as solvents. Mass spectra measurements were recorded by Finnigan-MAT-8430EI-MS mass spectrometer at 70 eV in m/z (rel. %).
3.2. General Procedure for the Synthesis of Compounds (10a - 10p)
Phenyl isocyanide (4.0 mmol), CuI (10 mol%), Cs2CO3 (2 mmol), L-proline (20 mol%), and acetonitrile (2 mL) were added to the mixture of para-nitro aniline 1 (3.0 mmol) and trichloroacetonitrile 2 (3.0 mmol) and stirred for 5 h to obtain compound 5. Then, ammonia 6 (4.50 mmol) was added to the mixture and stirred for 3 h. To increase the yield of the reaction, the mixture was centrifuged, and the solid precipitant was removed; then, the excess ammonia and the formed phosphine oxide were washed by adding ammonium chloride aqueous solution (2 mL) and dichloromethane (2 mL). To reduce the nitro group of compound 7, tin chloride (6.0 mmol) (SnCl2.H2O) was added to an ultrasonic apparatus with 60 Watt power at 30°C for 1 h. The solution of benzyl halides (or benzoyl halides) 9 (3.50 mmol) in acetonitrile (2 mL) was added to the mixture and stirred for 30 min. Finally, the mixture was centrifuged again, the solid was removed, and the mixture was washed with ammonium chloride solution (2 mL) and dichloromethane (2 mL). The aqueous phase was removed, and n-hexane and diethyl ether were added slowly to the organic phase, in sequence. In the end, the mixture was washed with the least amount of acetonitrile in the refrigerator to precipitate.
3.2.1. N6-benzyl-N4-phenylquinazoline-2,4,6-triamine (10a)
White powder; Yield: 80%; m.p.: 207 - 210°C; IR (KBr): ν (cm-1) 3360 (NH); mass m/z (%): 341.1 (M+, 11.4), 91.0 (64.3), 250.1 (60.7), 264.1 (28.6), 325.1 (27.1); 500 MHz 1H NMR (CDCl3): δ 4.77 (s, 2H, CH2), δ 5.68 (s, 1H, NH) δ 5.95 (s, 1H, NH), δ 6.2 (s, 2H, NH2), δ 7.9 (d, 1H, J = 5.07 Hz, H8-quinazoline), δ 7.43 (s, 1H, H5-quinazoline), δ 7.4 (d, 1H, J = 6.25 Hz, H7-quinazoline), δ 7.3 (t, 2H, J = 8.5 Hz, H3 & H5-benzyl), δ 7.14 - 7.18 (m, 6H, H4 & H2& H6-benzyl, H4& H3 & H5-phenyl), δ 7.1 (d, 2H, J = 9.38 Hz, H2 & H6-phenyl); 125 MHz 13C NMR(CDCl3): 48.3, 77.5, 78.3, 128.3 (2C), 129.3 (2C), 130.0 (2C), 130.7 (2C), 132.5, 133.3, 134.1, 135.0, 139.1, 140.0, 142.5, 148.3, 164.2, 168.1; Anal. Calcd for C21H19N5: C, 73.88; H, 5.61; N, 20.51. Found: C, 73.74; H, 5.59; N, 20.59.
3.2.2. N6-(4-bromobenzyl)-N4-phenylquinazoline-2,4,6-triamine (10b)
Orange powder; Yield: 65%; m.p.: 185 - 188°C; IR (KBr): ν (cm-1) 3432 (NH); mass m/z (%): 419.1 (M+, 6.7), 421.1 (M+ + 2, 6.7), 154.0 (38.7), 251.1 (17.4), 265.1 (27.4); 500MHz 1H NMR (DMSO): δ 4.6 (s, 2H, CH2), δ 5. 83 (s, 1H, NH) δ 6.08 (s, 1H, NH), δ 6.3 (s, 2H, NH2), δ 8.0 (d, 1H, J = 5.0 Hz, H8-quinazoline), δ 7.78 - 7.87 (m, 4H, H5 & H7-quinazoline, H3 & H5-benzyl), δ 7.6 (t, 1H, J = 3.75 Hz, H4-phenyl,), δ 7.3 - 7.4 (m, 4H, H2 & H6-benzyl, H3 & H5-phenyl), δ 7.1 (d, 2H, J = 5.0 Hz, H2 & H6-phenyl,); 125 MHz 13C NMR (DMSO): 46.3, 77.5, 78.3, 129.5, 130.0, 130.8 (2C), 133.3 (2C), 134.8 (2C), 135.0 (2C), 136.1, 140.0, 142.5, 143.3, 146.8, 150.8, 160.0, 164.2; Anal. Calcd for C21H18 BrN5: C, 60.01; H, 4.32; N, 16.66. Found: C, 59.81; H, 4.31; N, 16.71.
3.2.3. N6-(4-chlorobenzyl)-N4-phenylquinazoline-2,4,6-triamine (10c)
White powder; Yield: 85%; m.p.: decompose at 280 - 285°C; IR (KBr): ν (cm-1) 3421 (NH); mass m/z (%): 375.1 (M+, 14.8), 377.1 (M+ +2, 5.1), 111.1 (64.4), 77.1 (100), 297.0 (46.6); 500 MHz 1H NMR (CDCl3): δ 4.36 (s, 2H, CH2), δ 5.06 (s, 1H, NH), δ 5.53 (s, 1H, NH), δ 6.0 (s, 2H, NH2), δ 7.88-7.92 (m, 4H, H3 & H5-benzyl, H5 & H8-quinazoline), δ 7.48 (d, 1H, J 8.3 Hz, H7-quinazoline), δ 7.28 - 7.35 (m, 5H, H2 & H6-benzyl, H3 & H4 & H5-phenyl), δ 7.18 (d, 2H, J = 6.7 Hz, H2 & H6-phenyl); 125 MHz 13C NMR (CDCl3): 45.4, 77.5, 78.3, 123.3 (2C), 124.2 (2C), 125.8, 129.1, 130.0 (2C), 130.9 (2C), 132.9, 133.8, 135.9, 142.5, 143.3, 152.5, 162.0, 165.8; Anal. Calcd for C21H18 ClN5: C, 67.11; H, 4.83; N, 18.63. Found: C, 67.29; H, 4.81; N, 18.58.
3.2.4. N6-(4-methylbenzyl)-N4-phenylquinazoline-2,4,6-triamine (10d)
White crystal; Yield: 75%; m.p. 138 - 140°C; IR (KBr): ν (cm-1) 3347 (NH); mass m/z (%): 355.1 (M+, 38.9), 120.0 (48.5), 277.0 (37.9), 250.0 (32.0); 500 MHz 1H NMR (CDCl3): δ 3.58 (s, 3H, CH3), δ 4.6 (s, 2H, CH2), δ 5. 76 (s, 1H, NH), δ 6.1 (s, 1H, NH), δ 6.4 (s, 2H, NH2), δ 8.13 (d, 1H, J = 8.0 Hz, H8-quinazoline), δ 7.45 - 7.53 (m, 6H, H2 & H6-benzyl, H3 & H5-phenyl, H5 & H7-quinazoline), δ 7.3 - 7.35 (m, 5H, H2 & H6 & H4-phenyl, H3 & H5-benzyl); 125 MHz 13C NMR (CDCl3): 44.2, 55.2, 77.5, 77.7, 126.8 (2C), 127.5, 128.3, 129.1 (2C), 130.0, 131.0 (2C), 132.9 (2C), 140.0, 145.8, 148.0, 151.0, 153.3, 161.0, 165.0; Anal. Calcd for C22H21 N5: C, 74.34; H, 5.96; N, 19.70. Found: C, 74.15; H, 5.98; N, 19.78.
3.2.5. N6-(4-methoxybenzyl)-N4-phenylquinazoline-2,4,6-triamine (10e)
White crystal; Yield: 77%; m.p. 103 - 108°C; IR (KBr): ν (cm-1) 3400 (NH); mass m/z (%): 371.1 (M+, 21.9), 107.0 (100), 235.0 (34.9), 295.0 (46.5), 250.0 (20.2); 500 MHz 1H NMR (DMSO): δ 2.1 (s, 3H, OCH3), δ 4.45 (s, 2H, CH2), δ 5. 1 (s, 1H, NH), δ 5.7 (s, 1H, NH), δ 6.3 (s, 2H, NH2), δ 8.0 (d, 1H, J = 8.3 Hz, H8-quinazoline), δ 7.86 - 7.91 (m, 4H, H5 & H7-quinazoline, H3 & H5-benzyl), δ 7.7 (t, 1H, J = 8.0 Hz, H4-phenyl), δ 7.45 (t, 2H, J = 8.5 Hz, H3 & H5-phenyl), δ 7.45 (d, 2H, J = 8.0 Hz, H2 & H6-benzyl), δ 7.3 (d, 2H, J = 8.5 Hz, H2 & H6-phenyl); 125 MHz 13C NMR (DMSO): 24.0, 44.0, 77.5, 77.8, 127.5 (2C), 128.3, 129.2 (2C), 130.8, 131.3 (2C), 132.5, 133.8 (2C), 134.6, 135.5, 144.5, 147.5, 152.5, 162.5, 167.5; Anal. Calcd for C22H21 N5O: C, 71.14; H, 5.70; N, 18.85. Found: C, 70.95; H, 5.68; N, 18.92.
3.2.6. N6-(4-nitrobenzyl)-N4-phenylquinazoline-2,4,6-triamine (10f)
Yellow crystal; Yield: 60%; m.p. 98 - 102°C; IR (KBr): ν (cm-1) 3310 (NH); mass m/z (%): 386.1 (M+, 26.7), 136.0 (73.3), 308.1 (56.0), 369.1 (30.7); 500 MHz 1H NMR (DMSO): δ 4.6 (s, 2H, CH2), δ 5. 3 (s, 1H, NH), δ 5.65 (s, 1H, NH), δ 6.1 (s, 2H, NH2), δ 8.0 (d, 1H, J = 8.3 Hz, H8-quinazoline), δ 7.58 - 7.63 (m, 4H, H2 & H6 & H3 & H5-benzyl), δ 7.32 - 7.4 (m, 5H, H5 & H7-quinazoline, H3 & H5 & H4-phenyl), δ 7.12 (d, 2H, J = 8.3 Hz, H2 & H6-phenyl); 125 MHz 13C NMR (CDCl3): 44.1, 77.5, 77.8, 129.3 (2C), 130.0, 131.0, 131.6, 132.7 (2C), 134.0 (2C), 134.9, 139.9 (2C), 142.6, 147.0, 149.3, 152.0, 161.5, 162.3; Anal. Calcd for C21H18 N6O2: C, 65.27; H, 4.70; N, 21.75. Found: C, 65.40; H, 4.68; N, 21.68.
3.2.7. N6-benzyl-N4-p-methylphenyl quinazoline-2,4,6-triamine (10g)
White crystal; Yield: 67%; m.p. 171 - 172 °C; IR (KBr): ν (cm-1) 3473 (NH); mass m/z (%): 354.1 (M+-1, 4.6), 77.1 (100), 339.2 (13.1), 249.1 (17.7), 264.1 (29.2); 500 MHz 1H NMR (DMSO): δ 3.75 (s, 3H, CH3), δ 4.3 (s, 2H, CH2), δ 4.83 (s, 1H, NH), δ 5.3 (s, 1H, NH), δ 5.9 (s, 2H, NH2), δ 7.9 (d, 1H, J = 8.0 Hz, H8-quinazoline), δ 7.71 - 7.76 (m, 3H, H5-quinazoline, H2 & H6-benzyl), δ 7.62 (t, 2H, J = 8.0 Hz, H3 & H5-benzyl), δ 7.3 - 7.35 (m, 3H, H3 & H5-phenyl, H7-quinazoline), δ 7.25 (t, 1H, J = 8.0 Hz, H4-benzyl), δ 7.2 (d, 2H, J = 8.0 Hz, H2 & H6-phenyl); 125 MHz 13C NMR (CDCl3): 45.8, 57.0, 77.5, 78.3, 127.3, 128.3, 129.1 (2C), 130.0, 130.8, 131.6 (2C), 132.5, 133.3, 134.1, 135.0, 136.0, 136.9, 140.0, 155.0, 155.8, 160.0; Anal. Calcd for C22H21N5: C, 74.34; H, 5.96; N, 19.70. Found: C, 74.48; H, 5.94; N, 19.62.
3.2.8. N6-benzyl-N4-(4-methoxyphenyl) quinazoline-2,4,6-triamine (10h)
White crystal; Yield: 60%; m.p. 171 - 173°C; IR (KBr): ν (cm-1) 3335 (NH); mass m/z (%): 372.1 (M+ +1, 33.3), 91.1 (90), 280.1 (66.7), 293.1 (81.7); 500 MHz 1H NMR (DMSO): δ 2.3 (s, 3H, OCH3), δ 4.3 (s, 2H, CH2), δ 4.9 (s, 1H, NH), δ 5.3 (s, 1H, NH), δ 5.86 (s, 2H, NH2), δ 8.0 (d, 2H, J = 8.6 Hz, H2 & H6-benzyl), δ 7.6 - 7.65 (m, 5H, H5 & H7 & H8-quinazoline, H3 & H5-phenyl), δ 7.35 (t, 2H, J = 7.1 Hz, H3 & H5-benzyl), δ 7.26 (t, 1H, J = 7.1 Hz, H4-benzyl), δ 7.2 (d, 2H, J = 8.9 Hz, H2 & H6-phenyl); 125 MHz 13C NMR (CDCl3): 27.2, 48.2, 77.4, 77.8, 125.3, 125.5, 127.5 (2C), 127.8 (2C), 128.9 (2C), 129.9, 130.2 (2C), 131.8, 135.8, 142.8, 144.9, 146.1, 155.9, 163.0; Anal. Calcd for C22H21N5O: C, 71.14; H, 5.70; N, 18.85. Found: C, 71.08; H, 5.68; N, 18.91.
3.2.9. N6-benzyl-N4-(4-chlorophenyl) quinazoline-2,4,6-triamine (10i)
Brownish powder; Yield: 65%; m.p. decompose at 250 - 255°C; IR (KBr): ν (cm-1) 3414 (NH); mass m/z (%): 374.9 (M+, 41.7), 376.9 (M+ +2, 13.9), 270.0 (86.1), 359.0 (27.8); 500 MHz 1H NMR (DMSO): δ 4.3 (s, 2H, CH2), δ 5. 0 (s, 1H, NH), δ 5.54 (s, 1H, NH), δ 5.8 (s, 2H, NH2), δ 7.9 (d, 1H, J = 7.1 Hz, H8-quinazoline), δ 7.7 - 7.75 (m, 4H, H5 & H7-quinazoline, H2 & H6-benzyl), δ 7.6 (d, 2H, J = 7.1 Hz, H3 & H5-phenyl), δ 7.32 (t, 2H, J = 7.1 Hz, H3 & H5-benzyl), δ 7.27 (triplet, 1H, J = 7.1 Hz, H4-benzyl), 7.2 (d, 2H, J = 10.1 Hz, H2 & H6-phenyl); 125 MHz 13C NMR (CDCl3): 44.1, 77.5, 78.3, 125.7, 127.0, 128.1 (2C), 129.3 (2C), 130.0, 131.2 (2C), 132.5 (2C), 133.1, 135.0, 136.2, 137.0, 140.0, 153.1, 156.9; Anal. Calcd for C21H18 ClN5: C, 67.11; H, 4.83; N, 18.63. Found: C, 67.05; H, 4.81; N, 18.70.
3.2.10. N6-benzyl-N4-(4-bromophenyl) quinazoline-2,4,6-triamine (10j)
White powder; Yield: 60%; m.p. decompose at 230 - 235°C; IR (KBr): ν (cm-1) 3473 (NH); mass m/z (%): 420.2 (M++1, 11.8), 342.1 (23.5), 402.2 (35.3), 264.1 (47.0); 500 MHz 1H NMR (DMSO): δ 4.3 (s, 2H, CH2), δ 5.0 (s, 1H, NH), δ 5.35 (s, 1H, NH), δ 6.1 (s, 2H, NH2), δ 7.86 - 7.95 (m, 4H, H4-benzyl, H8-quinazoline, H3& H5-phenyl), δ 7.5 (d, 1H, J = 8.1 Hz, H7-quinazoline), δ 7.28 - 7.34 (m, 3H, H5-quinazoline, H3 & H5-benzyl), 7.1 - 7.15 (m, 4H, H2 & H6-phenyl, H2 & H6-benzyl); 125 MHz 13C NMR (CDCl3): 46.4, 75.0, 75.7, 129.3 (2C), 130.0 (2C), 130.7 (2C), 131.4, 132.1 (2C), 132.8, 133.7, 135.1, 137.1, 140.0, 141.5, 148.6, 158.5, 159.9; Anal. Calcd for C21H18BrN5: C, 60.01; H, 4.32; N, 16.66. Found: C, 60.16; H, 4.30; N, 16.59.
3.2.11. N6-benzyl-N4-(4-nitrophenyl) quinazoline-2,4,6-triamine (10k)
Red crystal; Yield: 73%; m.p. 201 - 203°C; IR (KBr): ν (cm-1) 3343 (NH); mass m/z (%): 386.1 (M+, 36.7), 106.0 (83.3), 280.0 (100), 371.1 (41.7); 500 MHz 1H NMR (DMSO): δ 4.43 (s, 2H, CH2), δ 5. 3 (s, 1H, NH), δ 5.7 (s, 1H, NH), δ 6.3 (s, 2H, NH2), δ 7.9 (d, 1H, J = 7.5 Hz, H8-quinazoline), δ 7.5 (d, 2H, J = 8.1 Hz, H3 & H5-phenyl), δ 7.3 - 7.38 (m, 5H, H4-benzyl, H2 & H6-benzyl, H3 & H5-benzyl), δ 7.1 - 7.18 (m, 4H, H5 & H7-quinazoline, H2 & H6-phenyl); 125 MHz 13C NMR (CDCl3): 44.8, 75.0, 75.8, 130.0 (2C), 130.8 (2C), 131.3, 131.8 (2C), 132.3, 132.9 (2C), 134.5, 135.0, 137.4, 140.0, 141.0, 147.4, 158.2, 160.0; Anal. Calcd for C21H18N6O2: C, 65.27; H, 4.70; N, 21.75. Found: C, 65.18; H, 4.69; N, 21.83.
3.2.12. N6-benzyl-N4-(4-fluorophenyl) quinazoline-2,4,6-triamine (10l)
Beige powder; Yield: 50%; m.p. decompose at 280 - 285°C; IR (KBr): ν (cm-1) 3485 (NH); mass m/z (%): 359.1 (M+, 5.0), 282.0 (48.0), 77.1 (35.0), 343.1 (20.0), 264.1 (23.0); 500 MHz 1H NMR (CDCl3): δ 4.5 (s, 2H, CH2), δ 6.0 (s, 1H, NH), δ 6.4 (s, 1H, NH), δ 6.7 (s, 2H, NH2), δ 7.9 (d, 2H, J = 5.0 Hz, H3 & H5-phenyl), δ 7.41 (s, 1H, H5-quinazoline), δ 7.39 (d, 2H, J = 8.6 Hz, H2 & H6-benzyl), 7.15 - 7.2 (m, 5H, H4 & H3 & H5-benzyl, H7 & H8-quinazoline), δ 7.07 (d, 2H, J = 8.6 Hz, H2 & H6-phenyl); 125 MHz 13C NMR (CDCl3): 44.9, 77.5, 78.3, 128.3 (2C), 129.1 (2C), 129.8 (2C), 131.8 (2C), 133.8, 134.6, 135.4, 136.2, 138.8, 140.0, 142.7, 148.4, 160.0, 161.7; Anal. Calcd for C21H18FN5: C, 70.18; H, 5.05; N, 19.49. Found: C, 69.98; H, 5.02; N, 19.56.
3.2.13. N-(2-amino-4-(phenylamino) quinazolin-6-yl)-4-chlorobenzamide (10m)
Dark gray powder; Yield: 55%; m.p. decompose at 270 - 273°C; IR (KBr): ν (cm-1) 3317 (NH), 1643 (CO); mass m/z (%): 389.1 (M+, 23.0), 391.1 (M+ +2, 8.0), 235.0 (28.7), 77.1 (74.7), 312.1 (34.5); 500 MHz 1H NMR (DMSO): δ 5.9 (s, 1H, NH), δ 6.4 (s, 2H, NH2), δ 9.35 (s, 1H, NH), δ 8.0 - 8.05 (m, 3H, H5 & H7 & H8-quinazoline), δ 7.58 - 7.64 (m, 4H, H2& H6 & H3 & H5-benzoyl), δ 7.32 (t, 2H, J = 8.5 Hz, H3 & H5-phenyl), δ 7.27 (t, 1H, J = 8.5 Hz, H4-phenyl), δ 7.2 (d, 2H, J = 8.3 Hz, H2 & H6-phenyl); 125 MHz 13C NMR (CDCl3): 77.4, 78.1, 126.8 (2C), 128.2 (2C), 129.6, 131.0 (2C), 131.7, 132.4(2C), 133.1, 133.8, 136.0, 141.8, 145.0, 147.9, 160.0, 163.6, 170.0; Anal. Calcd for C21H16ClN5O: C, 64.70; H, 4.14; N, 17.96. Found: C, 64.86; H, 4.13; N, 17.89.
3.2.14. N-(2-amino-4-(phenylamino) quinazolin-6-yl)-4-methylbenzamide (10n)
Yellowish crystal; Yield: 72%; m.p. 178 - 180°C; IR (KBr): ν (cm-1) 3417 (NH), 1681 (CO); mass m/z (%): 368.0 (M+ -1, 53.8), 235.0 (69.2), 277.0 (56.9), 353.1 (38.5), 292.0 (61.5); 500 MHz 1H NMR (CDCl3): δ 2.1 (s, 3H, CH3), δ 6.6 (s, H, NH), δ 6.9 (s, 2H, NH2), δ 9.0 (s, 1H, NH), δ 7.48 - 7.56 (m, 5H, H8 & H5 & H7-quinazoline, H2 & H6-benzoyl), δ 7.38 - 7.43 (m, 5H, H4 & H3 & H5-phenyl, H3 & H5-benzoyl), δ 7.25 (d, 2H, J = 8.3 Hz, H2 & H6-phenyl); 125 MHz 13C NMR (CDCl3): 26.5, 76.7, 77.5, 127.0 (2C), 127.9 (2C), 130.0 (2C), 130.8, 131.6 (2C), 132.4, 134.9, 137.4, 139.0, 142.5, 143.5, 145.0, 158.6, 161.0, 171.0; Anal. Calcd for C22H19N5O: C, 71.53; H, 5.18; N, 18.96. Found: C, 71.65; H, 5.16; N, 18.89.
3.2.15. N-(2-amino-4-(phenylamino) quinazolin-6-yl)-4-nitrobenzamide (10o)
Yellowish crystal; Yield: 60%; m.p. 250 - 254°C; IR (KBr): ν (cm-1) 3373 (NH), 1681 (CO); mass m/z (%): 401.0 (M+ +1, 42.9), 354.0 (85.7), 77.0 (100), 323.0 (80.0), 384.0 (77.1); 500 MHz 1H NMR (DMSO): δ 5.87 (s, H, NH), δ 6.3 (s, 2H, NH2), δ 9.3 (s, 1H, NH), δ 8.0 - 8.05 (m, 3H, H5-quinazoline, H3 & H5-benzoyl), δ 7.6 - 7.65 (m, 4H, H7& H8-quinazoline, H2 & H6-benzoyl), δ 7.32 (t, 2H, J = 8.5 Hz, H3 & H5-phenyl), δ 7.15 - 7.24 (m, 3H, H4 & H2 & H6-phenyl); 125 MHz 13C NMR (CDCl3): 77.1, 77.8, 127.1 (2C), 128.5 (2C), 129.9, 131.3, 132.0, 132.7 (2C), 133.4 (2C), 134.8, 136.0, 142.1, 145.0, 148.6, 160.2, 163.6, 170.0; Anal. Calcd for C21H16N6O3: C, 63.00; H, 4.03; N, 20.99. Found: C, 62.87; H, 4.05; N, 21.07.
3.2.16. N-(2-amino-4-(phenylamino) quinazolin-6-yl)-4-fluorobenzamide (10p)
Gray crystal; Yield: 67%; m.p. decompose at 250 - 253°C; IR (KBr): ν (cm-1) 3339 (NH), 1647 (CO); mass m/z (%): 372.1 (M+ -1, 56.8), 235.0 (51.7), 357.1 (100), 296.0 (37.8); 500 MHz 1H NMR (CDCl3): δ 6.5 (s, H, NH), δ 6.8 (s, 2H, NH2), δ 8.8 (s, 1H, NH), δ 7.9 (d, 2H, J = 7.1 Hz, H2 & H6-benzoyl), δ 7.48 - 7.55 (m, 3H, H5 & H7 & H8-quinazoline), δ 7.4 (d, 2H, J = 7.1 Hz, H3 & H5-benzoyl), δ 7.32 - 7.38 (m, 5H, H2 & H6 & H3 & H5 & H4-phenyl); 125MHz 13C NMR (CDCl3): 77.1, 77.8, 127.1, 127.9 (2C), 129.3 (2C), 131.0 (2C), 131.7, 132.5 (2C), 133.4, 135.0, 137.0, 142.1, 143.1, 148.9, 160.0, 161.4, 170.5; Anal. Calcd for C21H16FN5O: C, 67.55; H, 4.32; N, 18.76. Found: C, 67.49; H, 4.35; N, 18.83.
3.3. Molecular Docking and Molecular Dynamics Simulation
AutoDock Vina 1.1.2 program (34) was used for docking studies to obtain information about binding modes of the new quinazoline-2, 4, 6-triamine derivatives in the active site of EGFR-TK. The 3D structure of ligands was sketched using online 3D structure generation, CORINA (35) (www.mn-am.com/online_demos/corina_demo_interactive). Then, the energy of the ligands was minimized through the MM+ method using HyperChem software (36), and the format of the ligands was converted to PDBQT using AutoDock Tools 1.5.6 (37). The initial coordinates of the EGFR-TK enzyme were taken from Protein Data Bank (PDB ID: 1M17), which is in complex with an inhibitor (erlotinib). The polar hydrogens and Kollman united partial atom charge (38) were considered for the enzyme. Also, Gasteiger charges (39) were assigned to the ligand molecules, and rotatable bonds were identified. Then, a grid box of 20-20-20 points with a grid spacing value of 1 Å around the protein's active site was constructed. Finally, the best binding mode of the ligands in the binding pocket of EGFR-YK was defined based on the estimated binding energies. The formation of important hydrogen bonds was another criterion for this selection. Pymol (The PyMOL Molecular Graphics System, Version 1.2r3pre, Schrödinger, LLC.) (40) was used to visualize the docking outputs and create molecular graphics images.
Docking outputs (enzyme-ligand complex) were selected as input for MD simulation. In this study, the MD simulation of the complex of erlotinib, 10e, 10d, and EGFR-TK and free EGFR-TK was performed (4 MD simulations). All MD simulations were carried out using the Gromacs 2019 (41) with the Amber 99SB-ILDN force field (42) for the EGFR-TK enzyme and the gaff force field (43) for the ligands. An antechamber module from the AmberTools 14 suite (44) was used, and AM1-BCC charges (45) were assigned to the ligand molecules. All complexes were placed in a periodic rectangular box and filled with TIP3P water molecules (46). The Cl- counterions were added to maintain the electroneutrality of the systems. The particle mesh Ewald (PME) method (47) was applied to treat the long-range electrostatic interactions. Periodic boundary conditions (PBC) in all three directions and the cutoff distance value of 12 Å for nonbonded interactions were used. LINCS algorithm (48) was applied to constrain all bonds involving hydrogen atoms.
After initial preparation, energy minimization was performed using two methods: Steepest descent and conjugate gradient, 20,000 steps each, to remove bad contacts. In both energy minimization steps, position restraints of 1,000 kJ mol-1 nm-2 on all atoms of the enzyme and ligands were considered. Afterward, two 500 ps equilibration steps, without position restraint, were carried out at NVT and NPT ensembles at 300 K and 1 atm. Finally, a production run was carried out for 100 ns under constant temperature and pressure conditions. The time-step for all MD simulations was set to 2 fs. A V-rescale thermostat (49) and Parrinello-Rahman barostat (50) were used to keep the temperature and pressure constant during the simulation steps, respectively. The atomic coordinates were saved every 20 ps for analysis.
The MM-PBSA method was applied to estimate the binding free energy between EGFR-TK and the ligands (51). This method has been effectively and generally utilized to predict the binding affinity for protein-ligand complexes (52, 53). In this study, g_mmpbsa tools (54) were used. Based on root mean square deviation (RMSD) results, the last 60 ns of the MD trajectories were selected to estimate the binding free energies. In the MM-PBSA method, the binding free energy (∆Gbinding) between a protein (receptor) and a ligand was calculated as follows:
∆Gbinding = Gcomplex - (Greceptor + Gligand)
Each of these free energies can be broken down into the following terms:
Gi = EMM + Gsol - TS
i can be the complex, receptor, or ligand.
EMM = Eint + Eele + EvdW
Gsol = Gpol + Gnonpol
Where EMM is the gas-phase interaction energy between the protein and the ligand calculated by summing contributions from the internal energies, Eint (including bond, angle, and torsional angle energies), electrostatic, Eele, and van der Waals, EvdW, interaction energies. The solvation-free energy, Gsol, is measured by summing contributions from the polar- free energy, Gpol, and the non-polar-free energy, Gnonpol. T is the absolute temperature, and S is the solute entropy in this equation.
The total ∆Gbinding values were decomposed per residue with the MM-PBSA approach in all simulated systems to obtain the key residues.
3.4. Biological Evaluation
3.4.1. In-vitro Inhibition Studies of Epidermal Growth Factor Receptor Tyrosine Kinase
The inhibitory activity of all compounds in 100 nM concentration and IC50 of the compounds 10d and 10e, which were the best compounds from cell culture studies, were evaluated through EGFR Kinase Assay Kit Catalog # 40321 Kinase-Glo Luminescence kinase assay kit Catalog # v607. In this step, all compounds and erlotinib as the reference EGFR-TK inhibitor were dissolved in DMSO. The concentrations of 100 μM, 10 μM, 1μM, 100 nM, and 10 nM were applied to determine IC50. The reaction plate was prepared by adding the EGFR tyrosine kinase assay buffer, ATP (500 μM), 50x PTK substrate water, and dissolved compounds. The reactions were started by the addition of 20 μL diluted EGFR enzyme (1 ng/μL) and incubated at 30°C for 40 min, followed by adding 50 μL Kinase-Glo Max reagent to each well and incubation at room temperature for 15 min. A microplate reader measured the luminescence.
3.4.2. In-vitro Antitumor Evaluation
Antitumor activity was evaluated against three diverse cell lines of breast cancer (MCF-7), colorectal (HT-29), and lung (A-549), and the results were compared with fibroblast normal cell line (HDF). The MTT assay is a standard way to evaluate the inhibitory effect of the compounds. This colorimetric method is designed based on changing the yellow color of tetrazolium bromide (MTT) to purple due to changing mitochondrial succinate dehydrogenase to formazan derivative in viable cells. The culture mixture of cell lines MCF-7 and HT-29 is 85% RPMI with 10% fetal bovine serum (FBS), while the medium for A-549 is 85% DMEM and 10% FBS. Also, the antibiotics applied for the medium were penicillin and streptomycin in an amount of 100 units/mL. The cultured medium was kept at 37°C in a 5% CO2 incubator. The cells were implanted at a density of 1.0 ×10⁴ cells/well in a 96-well plate and maintained at 37°C under 5% CO2. After passing incubation for 24 h, the cells were handled with definite concentrations of synthesized compounds and incubated for 48 h. After incubation, 100 μL MTT solution 1 mg/mL was added and incubated again for 4 h. Then, 100 μL stabilizer solution containing SDS was added into each well and incubated for 2 h. Finally, the relative cell viability was calculated based on colorimetric assay by a plate reader instrument (EXL 800, USA), and absorbance was recorded at the wavelength of 570 nm.
4. Results and Discussion
4.1. Chemistry
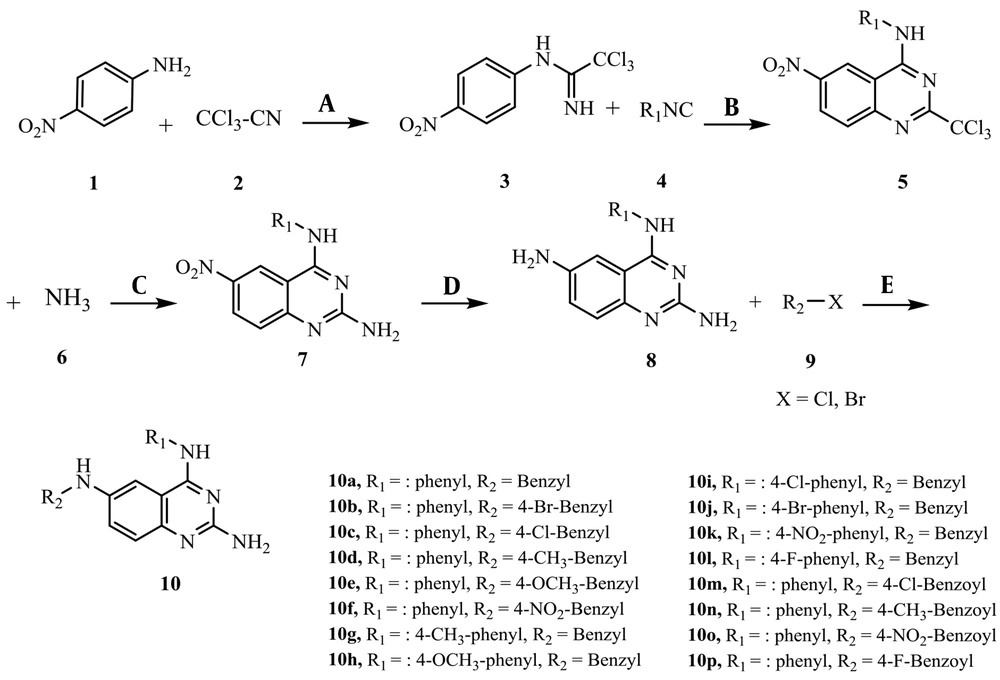
Figure 3 illustrates the synthesis of the novel compounds through tandem reactions. Para nitro aniline (1) and trichloroacetonitrile (2) were used as starting materials to produce the intermediate (3). Quinazoline-2, 4-diamine (7) was closed by the reaction of intermediate (3) and isocyanides (4) in the presence of CuI, Cs2CO3, and L-proline following the treatment with ammonia. Final products (10a - 10p) were achieved by reducing the nitro group of intermediate (7) and subsequent reaction with various benzoyl and benzyl halides. The structure of the synthesized compounds was verified utilizing IR, MS, elemental analyses, and 1H, 13C NMR spectra (55).
4.2. Biological Results
4.2.1. In-vitro Inhibition Studies of Epidermal Growth Factor Receptor Tyrosine Kinase
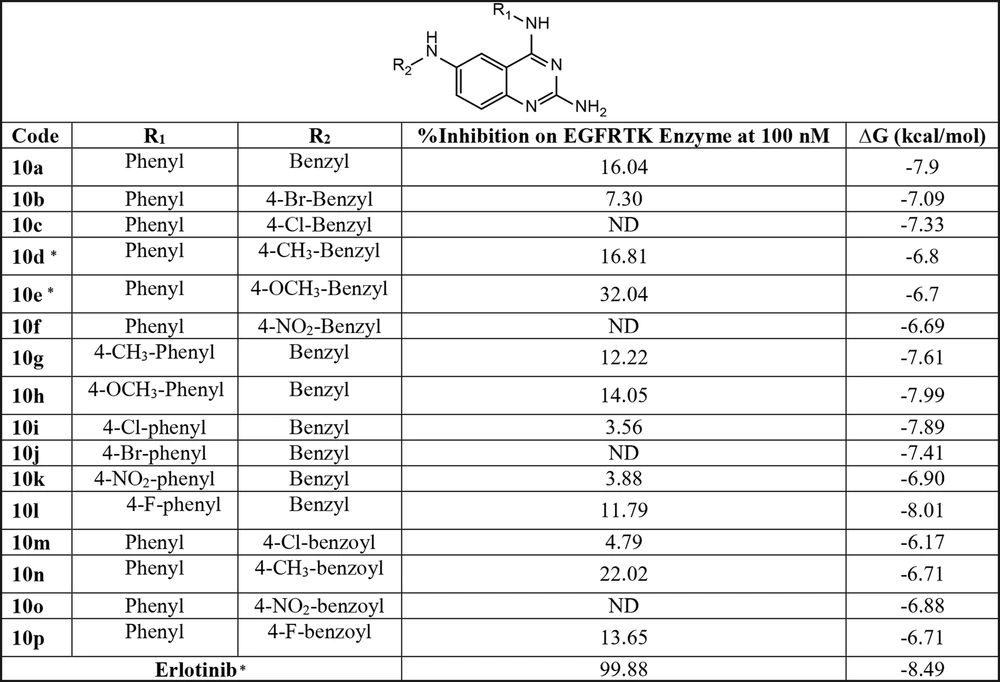
The inhibitory activity of all compounds and erlotinib, a positive control, against EGFRTK at 100 nM is presented in Figure 4. Generally, compounds with no substituent at the para-position of the phenyl ring in R1 showed better inhibitory activity than the others. In addition, the analogs with the benzyl ring-bearing electron-donating group at the R2 position exhibited satisfactory inhibitory activity compared to the benzyl ring with the electron-withdrawing group. Finally, the compounds with proper EGFERTK inhibitory effects were selected for antitumor activity evaluation, and the best compounds 10d and 10e in cell culture studies were chosen to determine the IC50 for EGFR-TK enzyme inhibition. Both compounds showed inhibitory activity against EGFR-TK in the µmolar range with IC50 values of 45.5 μM and 3.53 μM, respectively. These results confirm that inhibiting the EGFR-TK enzyme could mediate the cytotoxicity effects of these compounds.
4.2.2. In-vitro Antitumor Evaluation
The antitumor activity of the synthesized compounds selected based on the inhibitory effect on the EGFR enzyme kit (Figure 4) was evaluated against three cell lines of human breast cancer (MCF-7), colon cancer (HT-29), lung cancer (A-549) cell lines, using standard MTT assay. The cytotoxic activities of our tested compounds were expressed as IC50 values (the dose that reduces survival to 50%). During this process, erlotinib and Doxorubicin were considered reference drugs. These compounds indicated cytotoxic activity toward MCF-7, HT-29, and A-549 cell lines with IC50 values of 18.19 ± 2.6 µM, 28.07 ± 0.69 µM, 73.3 ± 1.5 µM and IC50s of 4.07±0.38 µM, 56.3 ± 0.9 µM, and 4.3 ± 0.3 µM, respectively. Compound 10e showed cytotoxic effects on MCF-7 breast, HT-29 colon cancer, and A549 lung cancer cell lines with IC50s of 63.5 ± 1.39 µM, 13.48 ± 1.89 µM, and 15.0 ± 0.9 µM, respectively. Also, compound 10d exhibited selective potency against the A-549 lung cancer cell line with IC50 = 0.126 ± 0.019 µM (Table 1). In addition, all the tested compounds showed the least activity against normal fibroblast cells (HDF). In general, the compounds bearing the benzyl group at the R2 position had better cytotoxicity than the corresponding analogs with the benzoyl group. It seems that the compounds with electron-donating substitution on the benzyl ring (10d and 10e) demonstrated good cytotoxic activity against the A-549 cell line.
| Code | IC50 (μM) ± SD | |||
|---|---|---|---|---|
| MCF-7 | HT-29 | A-549 | HDF | |
| 10a | ≥ 100 | ≥ 100 | ≥ 100 | ≥ 100 |
| 10d | ≥ 100 | ≥ 100 | 0.126 ± 0.019 | ≥ 100 |
| 10e | 63.5 ± 1.39 | 13.48 ± 1.89 | 15.00 ± 0.9 | ≥ 100 |
| 10g | ≥ 100 | ≥ 100 | ≥ 100 | ≥ 100 |
| 10h | ≥ 100 | ≥ 100 | ≥ 100 | ≥ 100 |
| 10l | ≥ 100 | ≥ 100 | ≥ 100 | ≥ 100 |
| 10n | ≥ 100 | ≥ 100 | ≥ 100 | ≥ 100 |
| 10p | ≥ 100 | ≥ 100 | ≥ 100 | ≥ 100 |
| Doxorubicin | 4.07 ± 0.38 | 56.3 ± 0.9 | 4.3 ± 0.3 | ≥ 100 |
| Erlotinib | 18.19 ± 2.6 | 28.07 ± 0.69 | 73.3 ± 1.5 | ≥ 100 |
4.3. Molecular Docking and Molecular Dynamics Simulation
Figure 4 shows the interaction energies of each compound to the active site pocket of EGFR-TK. Generally, the compounds with benzyl moiety in R2 position showed better affinity than the compounds with the benzoyl group in this position. It seems that the structures with the benzyl group bearing lipophilic substituent in the R2 position had a comparable affinity to erlotinib.
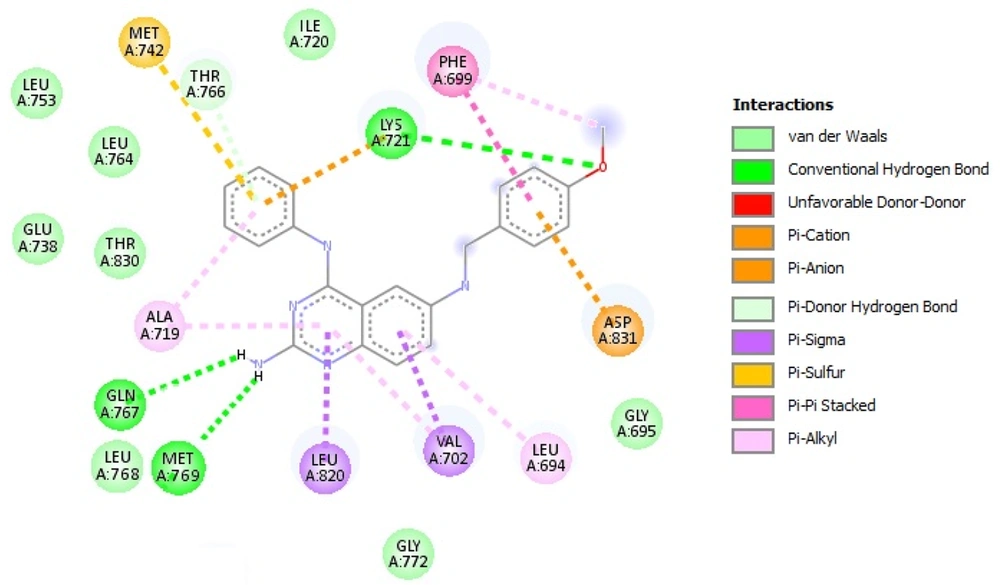
After molecular docking, the ligand pose with the highest binding affinity was selected as the best binding mode of ligands in the EGFR-TK binding site. A molecular docking study on compound 10e, illustrated in Figure 5, showed an appropriate binding pose with an epidermal growth factor receptor active site. The most critical amino acid in the active site is Met 769. This residue contributes to the hydrogen bond formation with the amine group attached to the quinazoline ring of compound 10e. Also, Π-Π stacking interaction could form between the phenyl ring of Phe 699 and the benzyl ring of the benzyl group. Residues such as Ala 719, Leu 753, Leu 764, and Leu 768 participate in van der Waals interactions. The details of these interactions, obtained from the LIGPLOT program, including the distances, are shown in Table 2. Docking results show that compounds 10e and 10d are oriented in such a way that they form a hydrogen bond with Met 769. Also, this vital hydrogen bond exists in the EGFR-TK-erlotinib complex in the original PDB file.
| Atom Name | Res Name | Res No. | Atom Name | Res Name | Distance (Å) |
|---|---|---|---|---|---|
| Hydrogen Bond | |||||
| N | Met | 769 | N11 | MOL | 2.90 |
| Π-Π Stacking | |||||
| CB | Phe | 699 | C28 | MOL | 3.85 |
| CG | Phe | 699 | O27 | MOL | 3.61 |
| CD1 | Phe | 699 | C25 | MOL | 3.86 |
| CD2 | Phe | 699 | C24 | MOL | 3.84 |
| CE1 | Phe | 699 | C26 | MOL | 3.59 |
| CE2 | Phe | 699 | C25 | MOL | 3.77 |
| CZ | Phe | 699 | C23 | MOL | 3.75 |
| Van der Waals | |||||
| CB | Leu | 764 | C18 | MOL | 3.73 |
| CD1 | Leu | 764 | C8 | MOL | 3.71 |
| CA | Leu | 768 | N11 | MOL | 3.59 |
| C | Leu | 768 | N11 | MOL | 3.68 |
| CB | Leu | 753 | C10 | MOL | 3.73 |
| CD1 | Leu | 753 | N9 | MOL | 3.40 |
| CD1 | Lue | 753 | C8 | MOL | 3.71 |
| CB | Ala | 719 | C17 | MOL | 3.35 |
| CB | Ala | 719 | C19 | MOL | 3.61 |
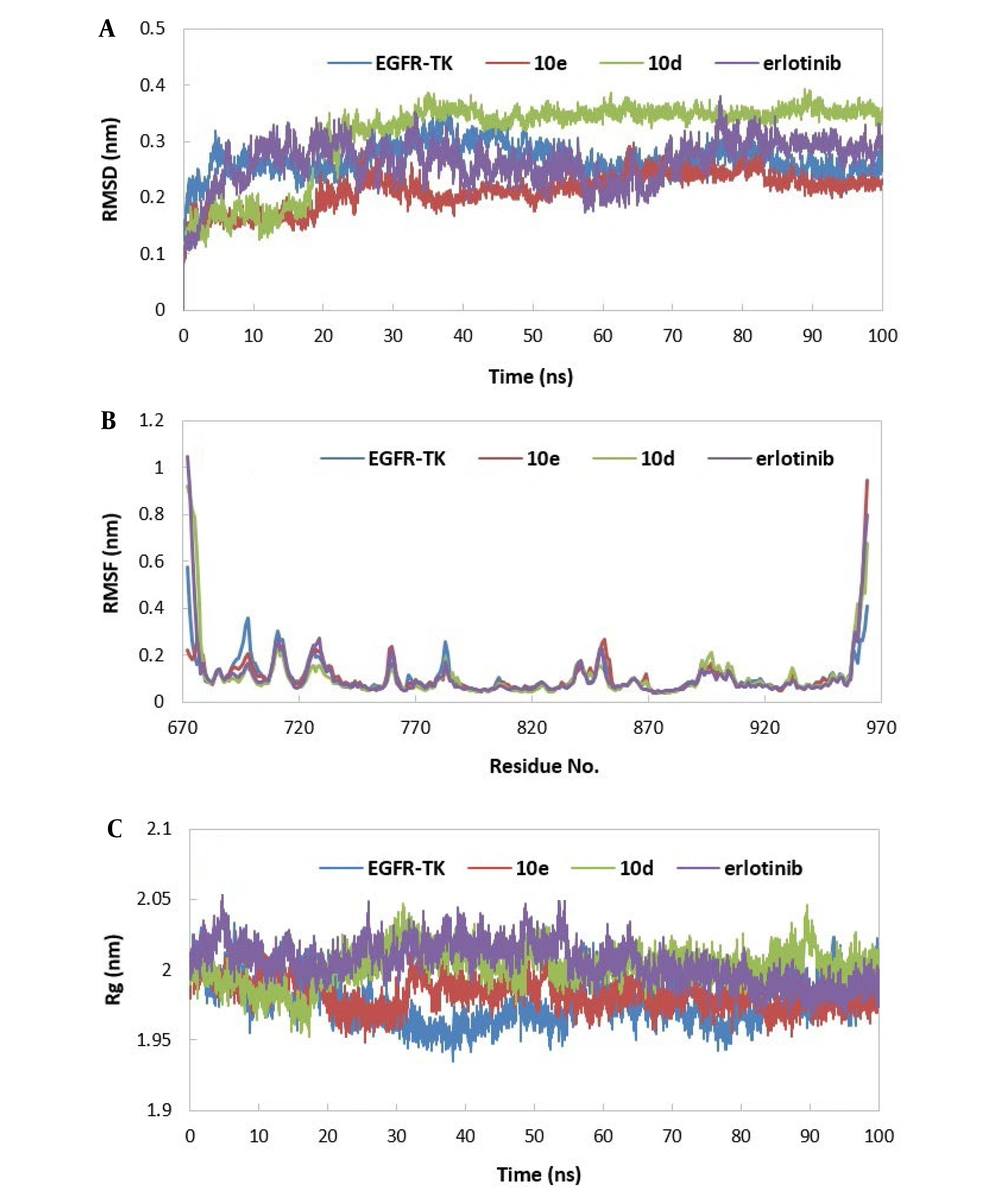
The stability of MD trajectories was evaluated using the RMSD estimation of alpha carbon atoms in the EGFR-TK enzyme. As shown in Figure 6A, the trajectories reach stability approximately after 35 ns. Small values of RMSDs for all simulated systems suggest that all of these structures are stable. The average RMSD values are as follows: EGFR-TK-10e (0.21 nm), EGFR-TK-10d (0.30 nm), EGFR-TK-erlotinib (0.25 nm), and free EGFR-TK (0.28 nm). These data reveal that compound 10e on the structural stability of the EGFR-TK enzyme is greater than erlotinib. The compound 10d does not have as much effect on enzyme stability as the other compounds. According to the RMSD values, the last 65 ns of the MD trajectories were selected for the ΔGbinding calculations.
A, the root mean square deviation (RMSD) of the alpha carbon atoms of free EGFR-TK and EGFR-TK in complex with inhibitors relative to the starting structures; B, the root mean square fluctuation (RMSF) of alpha carbon atoms of free EGFR-TK and EGFR-TK in complex with inhibitors; C, the radius of gyration (Rg) of free EGFR-TK and EGFR-TK in complex with inhibitors
To investigate the mobility and local fluctuations of the EGFR-TK enzyme during the simulation, the root means squared fluctuation (RMSF) of alpha carbon atoms was estimated for all simulated systems. With a glance at Figure 6B, it can be found that N-terminal and C-terminal regions have the most flexible residues with the highest RMSF values. It was found that the EGFR-TK shows less fluctuation in complex with compounds 10e, 10d, and erlotinib relative to free EGFR-TK. Also, in enzyme-ligand complexes, there are regions in which residues have less fluctuation. Further investigation showed that these residues interact with ligands (including residues 735 - 760, 765 - 780, 790 - 840, and 870 - 890). Met 769 is the best case that can be mentioned. This residue involves hydrogen bond interaction with studied ligands.
The radius of gyration (Rg) is another structural parameter evaluated in this study. It can be seen that the Rg value (Figure 6C) of EGFR-TK increases slightly upon the binding of ligands, indicating a less compact structure. It can be said that the binding of ligands did not considerably affect the enzyme's overall conformation.
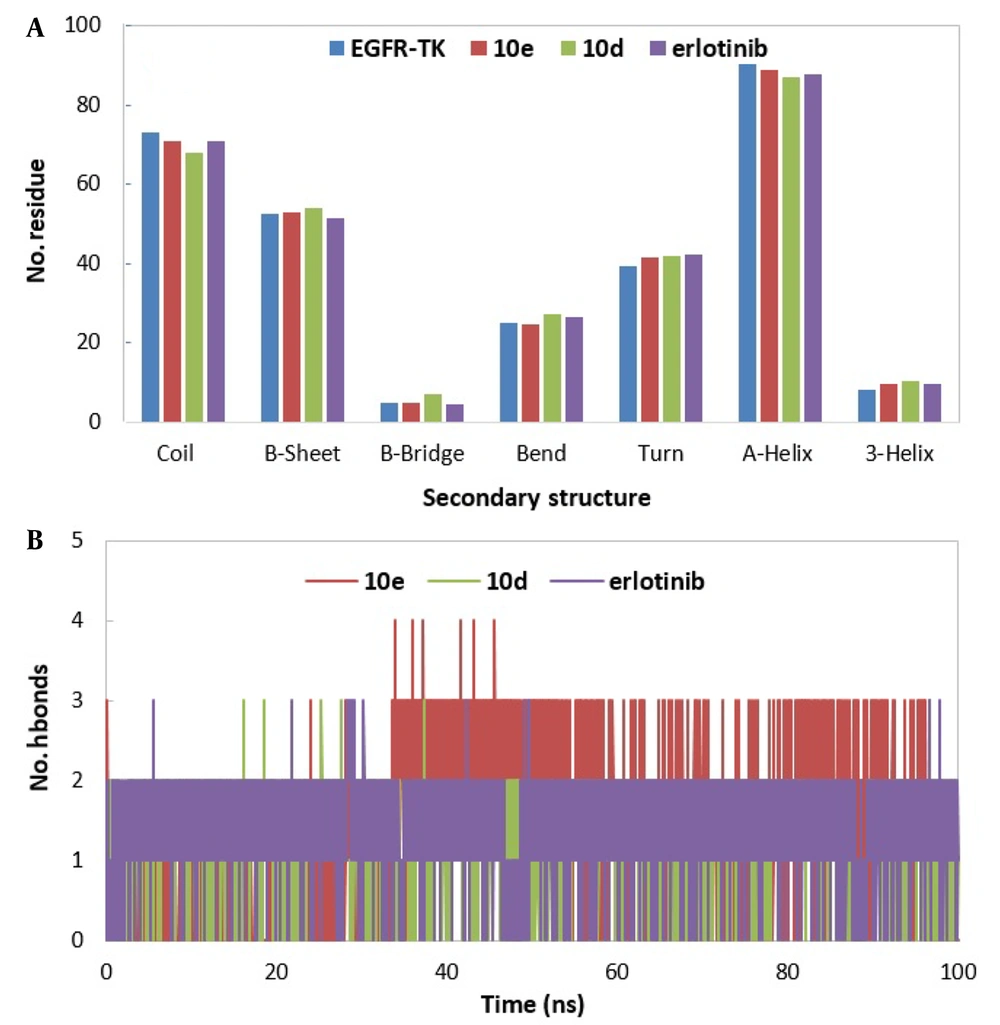
The secondary structure changes over simulation time were investigated using the DSSP (56) program. To this aim, the average number of residues adopting α-Helix, 310-Helix, β-Sheet, bridge, random coil, turn, and bend secondary structural element was estimated for free EGFR-TK and EGFR-TK in complex with ligands during the simulation time and plotted in Figure 7A. This figure shows that most residues participate in α-Helix, Random coil, and β-Sheet secondary structural elements. Also, there are slight changes in the secondary structural elements between free EGFR-TK and EGFR-TK in complexes with ligands. In most cases, in the presence of the ligands, the number of residues adopting α-Helix, β-Sheet, and random coil slightly decreases, and the number of residues adopting Turn and Bend secondary structural elements slightly increases. Another critical point that can be deduced is that the most significant change compared to protein is seen in the EGFR-TK-10d complex.
The number and occupancy of intermolecular hydrogen bonds between EGFR-TK and ligands (compounds 10e, 10d, and erlotinib) were calculated over the simulation time. The results are illustrated in Figure 6B and Table 3. As shown in this table, the highest existence of hydrogen bonds is related to EGFR-TK-10e and EGFR-TK-erlotinib complexes. Also, the number of hydrogen bonds in EGFR-TK-10e and EGFR-TK-erlotinib complexes is greater than that of the EGFR-TK-10d complex during the simulation time (Figure 7B). Another critical point that can be deduced is that Met 769 contributes to hydrogen bond formation in all three complexes with different existence percentages. The percentage of existence between Met 769 and compound 10d is less than that of 10e and erlotinib. These data are in good agreement with ∆Gbinding data, so those ligands with stronger hydrogen bonds with EGFR-TK (more %exist) show more affinity to EGFR-TK.
| Inhibitor and Donor | Acceptor | %Exist |
|---|---|---|
| 10e | ||
| MET769 | MOL965 a | 80.95 |
| MOL965 | MET769 | 45.56 |
| MOL965 | GLN767 | 36.57 |
| LYS721 | MOL965 | 27.45 |
| PHE699 | MOL965 | 20.14 |
| MOL965 | LEU694 | 15.04 |
| THR766 | MOL965 | 13.90 |
| ALA698 | MOL965 | 12.48 |
| 10d | ||
| MET769 | MOL965 | 61.54 |
| MOL965 | MET769 | 32.76 |
| THR766 | MOL965 | 25.22 |
| MOL965 | PRO675 | 11.90 |
| Erlotinib | ||
| MET769 | MOL965 | 76.52 |
| MET769 | MOL965 | 49.38 |
| LYS721 | MOL965 | 33.86 |
| MOL965 | GLN767 | 26.76 |
| MOL965 | SER696 | 19.48 |
| MOL965 | ALA698 | 13.55 |
a MOL965 is an inhibitor molecule.
To complete the structural analysis and assess the binding affinity of inhibitors to EGFR-TK enzyme, ΔGbinding values were estimated using the MM-PBSA method. According to the RMSD values and stability of MD trajectories, the last 65 ns of the MD trajectories were selected for the ΔGbinding calculations. All terms related to the ΔGbinding parameter (van der Waals, ΔEvdW, electrostatic, ΔEele, polar solvation, ΔGpolar, and non-polar solvation, ΔGnonpolar) are briefed in Table 4. With a glance at this table, it can be found that in all complexes, the major favorable contributors are the van der Waals and electrostatic terms, in sequence. In contrast, the polar solvation term opposes binding, and non-polar solvation has a less favorable contribution relative to the van der Waals and electrostatic terms. The contribution of van der Waals interactions to the ΔGbinding value is larger than that of electrostatic interactions for all simulated systems. The ΔGbinding values for simulated complexes are as follows: EGFR-TK-erlotinib (-136.93 kcal/mol), EGFR-TK-10e (-105.83 kcal/mol), and EGFR-TK-10d (-84.53 kcal/mol). In addition, the order of the ΔGbinding of these inhibitors is in good agreement with experimental IC50 values (complexes with more desirable binding free energy have less IC50 value).
| System | EGFR-TK-10e | EGFR-TK-10d | EGFR-TK-Erlotinib |
|---|---|---|---|
| ΔEvdW | -211.49 (12.12) a | -203.21 (11.94) | -227.91 (9.50) |
| ΔEele | -46.46 (12.32) | -50.97 (6.33) | -46.89 (9.16) |
| ΔGpolar | 172.96 (15.34) | 190.17 (15.77) | 159.34 (13.88) |
| ΔGnonpolar | -20.83 (0.89) | -20.52 (1.01) | -21.46 (0.96) |
| ΔGgasb | -257.95 | -254.18 | -274.81 |
| ΔGsolc | 152.12 | 169.65 | 137.88 |
| ΔGbindingd | -105.83 | -84.53 | -136.93 |
a The values in the parentheses are the standard errors of the mean.
b ΔGgas = ΔEvdW + ΔEele.
c ΔGsol = ΔEpolar + ΔEnonpolar.
d ΔGbinding = ΔEgas + ΔEsol.
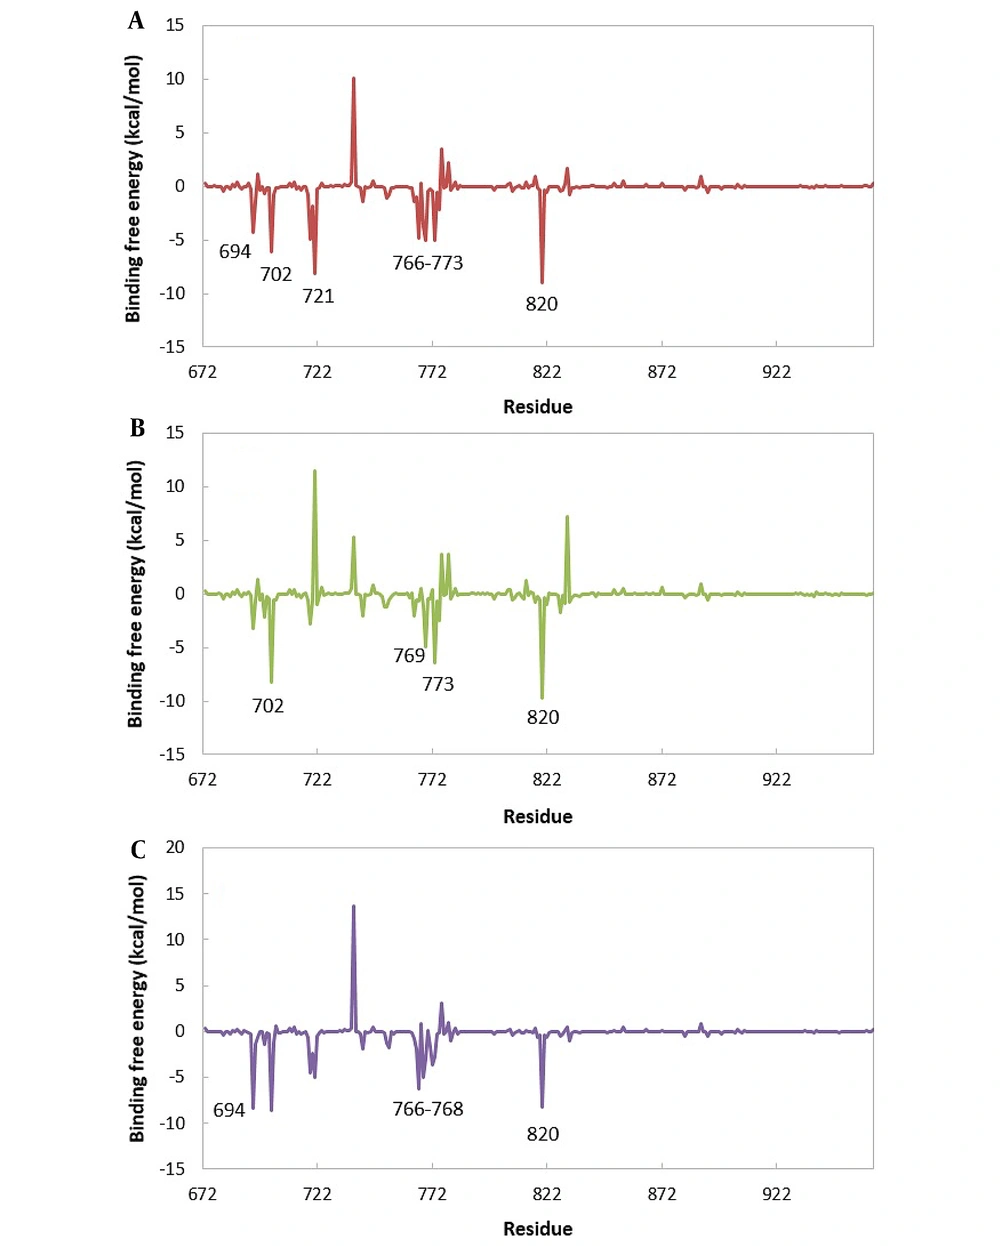
The total ∆Gbinding values were decomposed per residue using the MM-PBSA method to obtain detailed information about the contribution of critical residues in all complexes. The results are shown in Figure 8. The residues with the most favorable contributions to the ∆Gbinding are labeled in this figure. For most systems, the contribution of some residues (including 694, 702, 721,766 - 733, and 820) in ∆Gbinding values is more than that of other residues. Most of these residues are the ones that have the least amount of RMSF and participate in the formation of hydrogen bonds. It is worth noting that all complexes have a similar contribution pattern. This similarity is more significant between EGFR-TK-10e and EGFR-TK-erlotinib complexes.
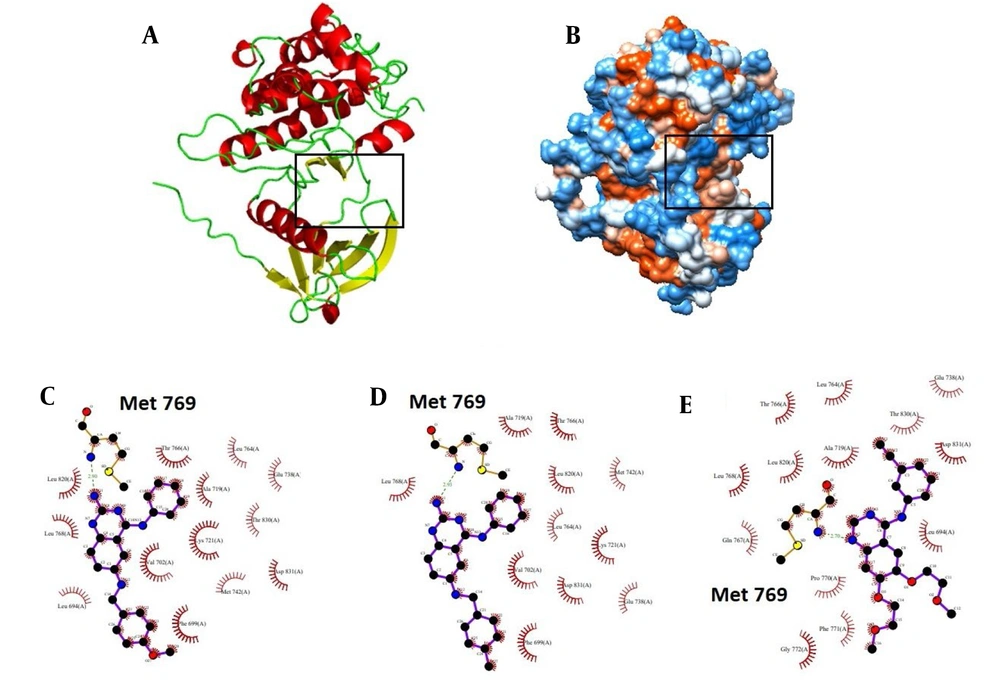
To obtain more details about EGFR-TK-inhibitor complexes, the LIGPLOT diagram of the interacted residues between EGFR-TK and 10e, 10d, and erlotinib is shown in Figure 9. The average structure of EGFR-TK inhibitors during the simulation was applied to this aim. This figure shows that Met 769 participates in hydrogen bond formation in all EGFR-TK-inhibitor complexes. This bond is one of the most important interactions in the stability of the EGFR-TK-inhibitor complex. Also, Leu 764, Thr 766, Ala 719, Glu 738, Lys 721, Leu 768, and Asp 831 contribute to hydrophobic interactions in all EGFR-TK inhibitor complexes.
A, the cartoon representation of EGFR-TK; B, the hydrophobicity surface of EGFR-TK (the binding site was shown using the black rectangle). LIGPLOT diagram of the interacted residues between EGFR-TK and C, 10e; D, 10d; and E, erlotinib. C, D and E, are related to the average structures of EGFR-TK inhibitors during the simulation. Hydrogen bonds are green dashed lines. Hydrophobic contacts with the ligand are presented by red semi-circles with radiating spokes.
4.4. Conclusions
In conclusion, a series of novel quinazoline-2,4,6-triamine derivatives with in-vitro antitumor activity were designed, synthesized, and biologically evaluated. Based on biological results, compound 10e showed broad-spectrum cytotoxicity on breast, colon, and lung cancerous cells with the least toxic effect on normal cells. Also, compound 10d showed selective cytotoxicity against cancerous lung cells (A-549). Furthermore, the data from inhibition studies of EGFR tyrosine kinase showed the mechanism of cytotoxicity of the compounds on cancerous cells. On the other side, computational studies confirmed that the amine group on the quinazoline ring had an essential role in improving cytotoxic effects toward the reference drug erlotinib with the same mechanism. Based on the in silico results (structural and thermodynamics analysis), Met 769 was a crucial residue in interaction with all inhibitors. The calculated ΔGbinding value of each inhibitor with EGFR-TK revealed the high contribution of the van der Waals and electrostatic interactions to the inhibitor-enzyme complex. Also, there was good consistency between calculated ΔGbinding and experimental IC50 values, and compound 10e was the most appropriate inhibitor in this study. In addition, RMSF, hydrogen bond, and ΔGbinding analysis had a good agreement.

