
1. Background
Cancer is recognized as a major cause of death and an important barrier to increasing life expectancy worldwide. In general, cancer incidence and mortality rates are rising rapidly worldwide (1-3). Today, systemic chemotherapy is commonly used to treat cancer; however, following systemic administration, drugs are non-specifically distributed in the body, affecting both cancerous and non-cancerous cells. As a result, a significant proportion of cancer patients develop severe complications and do not respond to conventional chemotherapy, or the disease recurs after treatment (4).
Intratumoral (IT) locoregional chemotherapy represents an attractive approach for maximizing local tumor concentration with minimal systemic toxicity. Increasing drug concentration at the desired location using a lower dose, reducing systemic drug exposure, and minimizing drug toxicity and adverse effects on healthy cells are the advantages of locoregional drug delivery (5). Despite the numerous benefits of IT injection, the relatively rapid withdrawal of most anti-cancer drugs from the tumor due to their small molecular size limits the effectiveness of this method of administration. The rapid clearance of anti-cancer drugs from the tumor and their entry into the bloodstream, while reducing their therapeutic effects, also increases the risk of damage to adjacent tissues (6). To address these limitations, recently, increasing attention has been directed to using slow-release biodegradable delivery systems for IT injection (7).
Since Bangham and Horne introduced the liposome carrier (8), numerous advances have been made in the production of liposomes. Multivesicular liposome (MVL), also known as DepoFoam, is a specific type of liposome that can be distinguished from other known conventional liposomes [i.e., unilamellar vesicle (ULV) and multilamellar vesicle (MLV)] by their structural and compositional characteristics (9). The ULV is composed of a bilayer membrane that surrounds a liquid area, and the structure of MLV is composed of multiple concentric multilayer membranes; nevertheless, the MVL structure consists of non-concentric lipid bilayers placed next to each other.
The MVL carrier is morphologically different that possesses a single external phospholipid (PL) bilayer and multiple internal liposomes, and due to the vesicular structure inside, these liposomes were named MVLs (9, 10). Their composition, similar to other liposomes, contains PLs and cholesterol (Chol) with neutral lipids (triglycerides), which play an essential role in producing its non-concentric structure. The combination of triglycerides, especially mono-unsaturated long carbon chain (14 - 18) or saturated short chain (10 - 12) triglycerides, is particularly efficient in slowing drug release (DR) (11). The physicochemical characteristics of MVLs, including slow-release rate, higher physical stability, and micron size, make them suitable for IT injection.
Doxorubicin hydrochloride (DOX) is an effective and widely used antitumor agent to treat a variety of cancers. However, the side effects of DOX, particularly its cardiovascular toxicity, pose a challenge to its clinical use.
2. Objectives
Considering the advantages of local IT injection, the potential of MVLs for local injection (especially higher stability and controlled release capability), and the known antitumor efficacy of DOX, the present study aimed to develop DOX-loaded MVLs (DOX-MVLs), as a biocompatible an efficient controlled-release carrier, intended to use for locoregional delivery in cancer treatment. To the best of our knowledge, no studies on the preparation of DOX-MVLs have yet been reported.
3. Methods
The DOX, chloroform, and methanol were obtained from Merck (Germany). Purified egg phosphatidylcholine (EPC), dipalmitoyl phosphocholine (DPPC), and distearoyl phosphocholine (DSPC) were supplied by Lipoid GmbH (Switzerland). Chol (purity > 99%), L-lysine free-base, triolein (TO), and dicetyl phosphate (DCP) were purchased from Sigma-Aldrich (Germany). Details of the materials were explained in the supplementary file.
3.1. Preparation of MVLs
The MVLs were prepared by a double emulsification (w/o/w) method (12). Briefly, the specified amounts of Chol, EPC, and TO were dissolved in 1 mL chloroform to make the lipid phase. The first aqueous solution was prepared by dissolving 1 mg/mL DOX in 7% sucrose. The prepared lipid phase (1 mL) was emulsified with an equal volume of the aqueous solution to make the first (water-in-oil) emulsion by mixing at 2,500 rpm for 15 minutes (IKA Shaker, VORTEX). The subsequent emulsification (1000 rpm for 1 minute) of the first water-in-oil emulsion was performed with the second aqueous solution containing 40 mM L-lysine in water to get the second emulsion (w/o/w). Finally, the free drug was isolated from the resulting MVLs by centrifugation at 600 × g for 5 minutes and washing the vesicles three times with a standard saline solution. The prepared MVLs were resuspended in an appropriate volume of the standard saline solution and stored at 4°C.
3.2. Experimental Design
To investigate the effect of different variables and to find an optimized MVL formulation, the experimental design method using a two-level full factorial design was employed. Design-Expert® software (version 7.0.0; State-Ease Inc., the USA) was used for this experiment (Appendix 1 in the Supplementary File).
Statistical analysis was carried out using analysis of variance (ANOVA) at a significance level of less than 0.05. Moreover, the regression coefficients of all variables and terms of interaction were determined.
3.3. Characterization of MVLs
3.3.1. Morphology and Size Measurements
The surface morphology of MVLs was observed using a light microscope. Particle size and size distribution were determined using the Malvern Mastersizer 2000.
3.3.2. Determination of Encapsulation Efficiency
To determine drug encapsulation efficiency (EE), the prepared MVLs (50 μL) were disrupted by adding methanol (1 to 10 v/v), and drug concentration was determined by UV-Vis spectroscopy at 480 nm (UV-mini 24 1240, Shimadzu, Japan). The EE% was calculated using the following equation:
3.3.3. In Vitro Release Studies
3.3.4. Fourier-Transform Infrared Spectroscopy
The Fourier-transform infrared spectroscopy (FTIR) sample analysis was performed in the attenuated total reflectance mode utilizing an Agilent instrument (Agilent Cary 360 FTIR, USA). Each recorded spectrum was an average of 64 scans with a resolution of 4 cm-1 over a spectral area of 400 to 4000 cm-1.
3.4. Biological Evaluation
3.4.1. Cytotoxicity Assay
The MTT (3-[4,5-dimethylthiazol-2-yl]-2,5 diphenyl tetrazolium bromide) assay evaluates viable cells to determine the cytotoxicity of drugs in various concentrations (15). The cytotoxicity of DepoDOX was investigated on a human fibroblast cell line, human breast cancer cell line (MCF-7), and murine breast cancer cell line (4T-1) obtained from Pasteur Institute Cell Bank of Iran (Tehran, Iran). Details of the cytotoxicity assay were described in the supplementary file.
3.4.2. Hemolysis Assay
3.5. Stability of MVLs
Fusion, aggregation, and drug leakage might influence the stability of MVLs during storage. Therefore, the physical stability of the optimum DOX-MVLs kept at 4°C was evaluated for 2 months. For this purpose, at scheduled time points (i.e., 7, 14, 28, and 60 days), samples of the stored MVLs were removed and monitored in terms of drug leakage, particle size, size distribution (span value), and zeta potential.
3.6. Statistical Analysis
All the experiments were conducted at least in triplicate. The obtained results were presented as mean ± standard deviation. Statistical analyses were carried out by ANOVA using SPSS software (version 17.0). A P-value less than 0.05 was considered statistically significant.
4. Results
4.1. Preliminary Studies and Characteristics of Prepared MVLs
Since the concentration and composition of lipids can affect the formation and properties of the vesicles, such as particle size, drug loading, and DR rate, preliminary studies were performed to initially evaluate the effect of the type of PL (i.e., EPC, DPPC, and DSPC) and Chol/PL molar ratio (i.e., 1.5 and 2.5). The amounts of the negatively charged PL, DCP, and neutral lipid (TO) were constant in all formulations. As shown in Table 1, the particle size and span values of the MVLs are within the ranges of 7.6 - 14.8 µm and 1.9 - 3.6, respectively, which suit well with the requirements of the study. The EE% was not statistically different in the preliminary formulations and varied from 68 to 73, indicating the relatively good ability of the MVLs for DOX encapsulation. The exception was DSPC 2.5 with EE% of 62, which was significantly lower than some other formulations (P < 0.01 and P < 0.05, compared to DPPC 1.5 and EPC 2.5, respectively).
Table 1.
Percentage of Drug Release from Preliminary Formulations at Different Times a
| Formulation | DR%* (h) | ||||
|---|---|---|---|---|---|
| 6 | 72 | 96 | 120 | 72 - 120 | |
| DSPC 1.5 | 37.18 ± 1.36 | 65.38 ± 1.83 | 67.25 ± 1.7 | 68.06 ± 1.98 | 2.68 ± 1.17 |
| DSPC 2.5 | 43.95 ± 3.11 | 67.35 ± 3.52 | 69.93 ± 3.52 | 70.59 ± 2.47 | 3.23 ± 2.51 |
| DPPC 1.5 | 32.72 ± 2.67 | 58.32 ± 2.2 | 60.23 ± 4.81 | 61.09 ± 7.11 | 2.76 ± 0.53 |
| DPPC 2.5 | 34.43 ± 1.85 | 53.95 ± 3.71 | 55.39 ± 3.71 | 57.23 ± 4.12 | 3.27 ± 0.59 |
| EPC 1.5 | 33.88 ± 2.03 | 58.01 ± 3.12 | 63.55 ± 2.92 | 67.88 ± 3.14 | 9.87 ± 1.26 |
| EPC 2.5 | 40.95 ± 1.29 | 62.24 ± 2.24 | 64.17 ± 2.24 | 65.61 ± 3.58 | 5.61 ± 0.73 |
Abbreviations: DR, drug release; DPPC, dipalmitoyl phosphocholine; DSPC, distearoyl phosphocholine; EPC, egg phosphatidylcholine.
a Values are expressed as mean ± SD (n = 3).
4.2. Experimental Design and Data Analysis
For a more precise evaluation of the formulation factors, the effects of three different parameters, including the Chol/EPC molar ratio, percentage of neutral lipid (TO%), and lipid-to-drug molar ratio (L/D), on EE% and DR% (Appendix 1) were evaluated using experimental design methodology. Table 2 shows the 12 experimental runs of the two-level full (23) .factorial design and their responses. In order to increase the predictability of the model, the experiments were conducted in random order. As shown in Table 2, the values of EE%, DR6h%, and DR72h% were within the ranges of 46.65 - 83.9, 10.33 - 30.53, and 31.39 - 79.05, respectively. The highest EE% was observed for F12 (≈ 84%), which had the lowest amount of both TO and Chol/EPC ratio. The formulations also showed differences in the DR rate (Figure 1, Table 2). During 72 hours, the lowest and highest release percentages were related to F8 and F1, with respective values of 31.39% and 73.93%. The ANOVA and model summary statistics, Pareto diagram, and perturbation diagram are presented in the supplementary file.
![In vitro release profiles of DOX from different experimentally designed MVL formulations in PBS (pH 7.4) [data represented as mean ± SD (n = 3)].](https://brieflands.com/journals/ijpr/articles/134190/figures/ijpr-134190-i001-F1-preview.webp "In vitro release profiles of DOX from different experimentally designed MVL formulations in PBS (pH 7.4) [data represented as mean ± SD (n = 3)].")
Figure 1.
In vitro release profiles of DOX from different experimentally designed MVL formulations in PBS (pH 7.4) [data represented as mean ± SD (n = 3)].
Table 2.
23 Full Factorial Design Matrix and Characteristics of Prepared Formulations a
| Run | A: Chol/EPC | B: TO | C: L/D | EE% | Size | Span | DR% (6 h) | DR% (72 h) |
|---|---|---|---|---|---|---|---|---|
| F1 | 2.00 | 15.00 | 10.00 | 79.11 ± 2.9 | 10.65 | 2.3 | 17.08 ± 0.45 | 73.93 ± 1.66 |
| F2 | 1.50 | 20.00 | 20.00 | 69.66 ± 1.27 | 8.12 | 1.56 | 15.4 ± 1.68 | 52.01 ± 0.57 |
| F3 | 2.00 | 25.00 | 30.00 | 58.30 ± 2.07 | 7.87 | 2.45 | 22.96 ± 3.12 | 47.76 ± 3.375 |
| F4 | 1.50 | 20.00 | 20.00 | 74.00 ± 3.11 | 12.11 | 3.63 | 12.62 ± 2.78 | 79.05 ± 3.37 |
| F5 | 2.00 | 15.00 | 30.00 | 72.59 ± 0.87 | 9.26 | 3.21 | 16.48 ± 1.92 | 63.04 ± 3.62 |
| F6 | 1.00 | 25.00 | 10.00 | 52.70 ± 1.17 | 14.32 | 2.87 | 16.49 ± 0.87 | 48.13 ± 2.57 |
| F7 | 1.50 | 20.00 | 20.00 | 72.20 ± 2.23 | 10.33 | 3.21 | 15.73 ± 3.16 | 44.06 ± 1.77 |
| F8 | 1.00 | 25.00 | 30.00 | 51.40 ± 3.19 | 13.8 | 2.87 | 10.87 ± 0.41 | 31.39 ± 2.64 |
| F9 | 1.00 | 15.00 | 30.00 | 46.65 ± 2.88 | 8.53 | 1.95 | 30.53 ± 0.56 | 65.16 ± 3.76 |
| F10 | 1.50 | 20.00 | 20.00 | 69.00 ± 3.45 | 9.65 | 1.36 | 14.46 ± 0.176 | 50.04 ± 1.46 |
| F11 | 2.00 | 25.00 | 10.00 | 47.05 ± 3.13 | 11.87 | 2.73 | 10.33 ± 3.65 | 65.82 ± 1.37 |
| F12 | 1.00 | 15.00 | 10.00 | 83.90 ± 0.51 | 9.81 | 2.23 | 21.75 ± 1.63 | 58.66 ± 2.51 |
Abbreviations: Chol/EPC, cholesterol-to-egg phosphatidylcholine ratio; TO, triolein; L/D, lipid-to-drug molar ratio; EE, encapsulation efficiency; DR, drug release.
a Values are expressed as mean ± SD (n = 3).
4.3. Selected Formulation for Further In Vitro and In Vivo Experiments
Based on the obtained results (Table 2), formulation F12 composed of EPC: Chol: TO: DCP (7.65: 7.65: 2.7: 1, molar ratio), which presented the highest EE and a reasonably controlled release profile was chosen as the most suitable formulation and investigated thoroughly in terms of in vitro and in vivo experiments. This formulation hereafter is referred to as DepoDOX.
4.4. Morphology, Zeta Potential, and FTIR Spectroscopy
As seen in the Supplementary File (Appendix 8), the MVLs morphology at × 400 and × 1000 magnification with an optical microscope was the spherical, honeycomb-like structure of tiny chambers, which is in agreement with previous reports (18). The average zeta potential value of DepoDOX was about -36.3 mV. The structural identification of DepoDOX was performed by FTIR analysis. The EPC, Chol, TO, DCP, DOX, drug-free MVL, and DepoDOX spectra are shown in the supplementary file.
4.5. Stability of DepoDOX in Storage Conditions
The stability results are available in the supplementary file.
4.6. Evaluation of Cytotoxicity Using the MTT Method
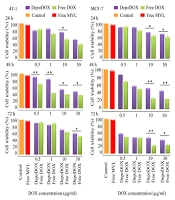
The cytotoxic activity of the selected formulation in comparison to the free drug was evaluated against 4T1, MCF7, and fibroblast cell lines, and the half maximal inhibitory concentration (IC50) results are shown in the Supplementary File (Appendix 4). Figure 2 illustrates the viability of the different cell lines. As shown, DepoDOX and DOX solution decreased MCF-7 and 4T1 cell viability in a concentration- and time-dependent manner, exposing a higher cytotoxic effect for free DOX as compared to the drug-loaded formulation. The empty MVLs were non-toxic to the cells, supporting the biocompatibility of the vesicles.
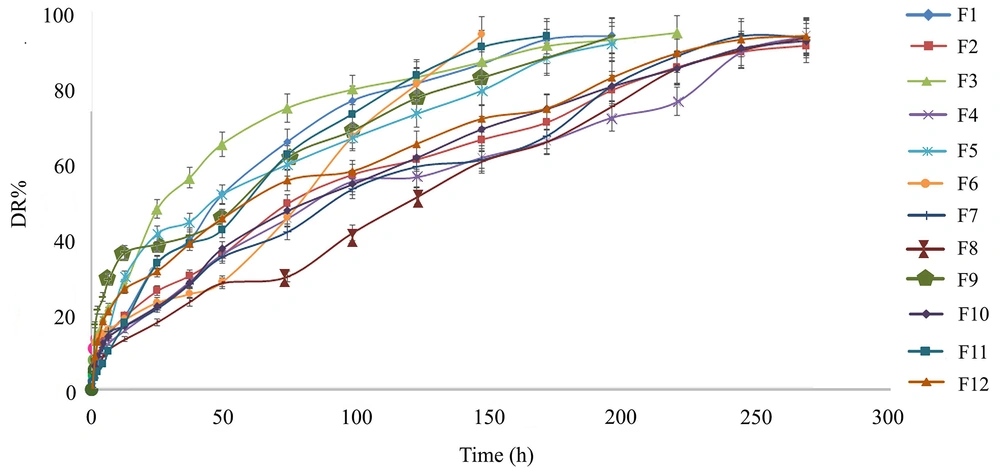
Figure 2.
Viability of different cell lines incubated with free DOX and DepoDOX at the same drug concentrations: At 24 h; 48 h and 72 h (n =3) (*P < 0.05; **P < 0.01).
4.7. Hemolysis Assay
To determine the hemocompatibility properties of MVLs, a hemolysis test was performed. The hemolysis index of DepoDOX was about 1.47%, indicating that the prepared formulation did not result in significant hemolysis. It should be noted that the samples with a hemolysis index of less than 10% are considered nonhemolytic (17).
5. Discussion
The DOX is one of the most effective agents in various anti-cancer therapies; nevertheless, its clinical application is limited due to dose-dependent side effects, such as cardiac and renal toxicity. To reduce the toxicity and maintain the antitumor effect of this potent drug, liposomal DOX formulation (Doxil/Caelyx) has been approved by the United States Food and Drug Administration for intravenous injection (19). Despite the reduction in side effects, reports indicate that the level of the drug in the tumor and, therefore, its antitumor efficacy are not greatly increased by the intravenous injection of the liposomal formulation. On the other hand, clinical studies have shown that prescribing higher doses of Doxil to increase the therapeutic effect of this formulation continues to cause cardiac toxicity (20). As an appropriate strategy to provide a higher drug concentration at the target tissue and minimize side effects, the field has been directed to the direct IT injection of anti-cancer drugs (21, 22). Despite the advantages of IT injection, the relatively rapid removal of small-molecule drugs, such as DOX, from the tumor tissue reduces the efficiency of this method.
The MVLs, due to their unique characteristics, including high drug loading, sustained release rate, and superior physical stability, could be a promising option to be employed for direct IT injection (10, 23, 24). Therefore, this study was planned to prepare DOX-MVLs with a high EE and controlled DR profile. The optimized formulation was then further investigated for particle size, morphology, structural properties, stability, and biocompatibility.
5.1. Preliminary Studies
Preliminary studies were conducted to assess the effects of the type of PL (i.e., EPC, DPPC, and DSPC) and the Chol/PL molar ratio (i.e., 1.5 and 2.5). The amounts of the negatively charged PL, DCP, and neutral lipid (TO) were constant in all formulations (Table 3). Adding a small amount of negatively charged PLs decreases the possibility of aggregation in particles during fabrication. Negatively charged PLs also enhance the interlamellar distance between MVL bilayers, resulting in a larger total captured volume (9, 25).
Table 3.
Physicochemical Properties of Doxorubicin Hydrochloride-Loaded Multivesicular Liposomes Developed in Preliminary Studies a
| Formulation | Lipid Composition | Mole Ratio (%) | EE% | Size (µm) | Span |
|---|---|---|---|---|---|
| DSPC 1.5 | DSPC:Chol:TO:DCP | 35:53:7:5 | 68 ± 2.1 | 7.6 | 1.9 |
| DSPC 2.5 | DSPC:Chol:TO:DCP | 25:63:7:5 | 62 ± 3.2 | 14.8 | 3.6 |
| DPPC 1.5 | DPPC:Chol:TO:DCP | 35:53:7:5 | 73 ± 4.6 | 14.1 | 2.38 |
| DPPC 2.5 | DPPC:Chol:TO:DCP | 25:63:7:5 | 70 ± 1.7 | 11.2 | 3.24 |
| EPC 1.5 | EPC:Chol:TO:DCP | 35:53:7:5 | 68 ± 4.1 | 10.7 | 1.99 |
| EPC 2.5 | EPC:Chol:TO:DCP | 25:63:7:5 | 71 ± 1.3 | 8.56 | 2.61 |
Abbreviations: Chol, cholesterol; DCP, dicetyl phosphate; DPPC, dipalmitoyl phosphocholine; DSPC, distearoyl phosphocholine; EE, encapsulation efficiency; EPC, egg phosphatidylcholine; L/D, lipid-to-drug molar ratio; TO, triolein.
a Values are presented as mean ± SD (n = 3).
All formulations showed a good ability to encapsulate the drug (Table 1). Statistical analyses showed no significant difference among the initial formulations in terms of EE%; the only exception was the comparison of EE% between DSPC 2.5 and DPPC 1.5, in which DSPC 2.5 presented significantly lower EE% than the other formulation (about 62% and 73%, respectively; P < 0.01). This might be ascribed to the physiochemical properties of the drug. The DOX, as a water-soluble amphipathic agent (26), is expected to accumulate more in the aqueous chambers of MVLs. However, it is well-accepted that amphipathic molecules can intercalate into the nonpolar chain region of bilayers in addition to accumulating in the aqueous phase (27). Therefore, in the composition of DSPC 2.5 formulation, which contains a more rigid PL, a higher percentage of Chol might compete with the drug molecules for space in the bilayer. The lack of a negative effect of higher Chol on EE% in the formulations of DPPC 2.5 and EPC 2.5 can probably be attributed to their lower rigidity than DSPC.
Figure 3 and Table 1 show the in vitro DR profiles and DR% in different time intervals for the preliminary formulations, respectively. When compared to the free DOX solution, a dramatic slowing down in the in vitro release rate was observed in all initial formulations. The release profiles from MVLs demonstrated a biphasic pattern (Appendix 5 in the Supplementary File), an initial phase (up to 6 hours), followed by a slower release rate, with 60 - 70% release within 120 hours.
![In vitro release profiles of DOX from the preliminary MVL formulations and free DOX solution in PBS (pH 7.4) [data presented as mean ± SD (n = 3)].](https://brieflands.com/journals/ijpr/articles/134190/figures/ijpr-134190-i003-F3-preview.webp "In vitro release profiles of DOX from the preliminary MVL formulations and free DOX solution in PBS (pH 7.4) [data presented as mean ± SD (n = 3)].")
Figure 3.
In vitro release profiles of DOX from the preliminary MVL formulations and free DOX solution in PBS (pH 7.4) [data presented as mean ± SD (n = 3)].
As mentioned before, MVL is differentiated from conventional liposomes (i.e., unilamellar and multilamellar liposomes) by its distinctive structure and composition. As shown in the Supplementary File (Appendix 7), each MVL comprises multiple nonconcentric chambers incorporated in a large vesicle surrounded by a bilayer membrane (11). Considering this structure, the initial relatively fast-release phase could be due to the drug molecules dispersed in the outer surrounding bilayer and those molecules located in the outermost chambers; however, the later slow-release phase is probably caused by drug diffusion from the inner vesicles.
Biphasic release profiles have also been reported for oxaliplatin-(28) and interferon alfa-(29) loaded MVLs. It should be noted that according to the results of the IT injections of slow-release systems, such as microspheres, the slow release of anti-cancer drugs is effective in controlling cancer cells over a long time; however, a rapid initial release results in better outcomes in the treatment process (7, 30). A general evaluation of the release results indicated that the Chol/PL ratio was effective in the release rate. The MVLs with a higher Chol/PL ratio (i.e., DSPC 2.5, DPPC 2.5, and EPC 2.5) showed a higher DR% over the first 6 hours, indicating faster initial DR, compared to similar formulations with a lower ratio (i.e., DSPC 1.5, DPPC 1.5, and EPC 1.5) (Figure 3 and Table 1). It has been reported that Chol at appropriate percentages has an essential role in stabilizing and controlling the permeability of lipid bilayers to small molecules; however, at higher amounts, it could destabilize the bilayers facilitating the DR rate (31).
The MVLs with a lower Chol/PL ratio demonstrated relatively similar initial (0 - 6 hours) release profiles; nevertheless, in the continuation and longer times, DSPC1.5 and DPPC 1.5 showed much slower release rates than EPC 1.5. As shown in Table 1, the DR% in the duration of 72 - 120 hours for DSPC 1.5, DPPC 1.5, and EPC 1.5 was 2.68%, 2.76%, and 9.87%, respectively. The prolonged release of the drug might not be appropriate in terms of the required therapeutic concentration; therefore, EPC was chosen for the further optimization of DOX-loaded MVLs.
5.2. Experimental Design
To attain the best possible EE% and DR profile, which are among the major characteristics of a drug carrier in achieving the desired therapeutic result, an experimental design was used to evaluate the precise effects of the independent variables. Based on the preliminary studies and literature review (11, 32-35), three formulation parameters, including Chol/EPC ratio, neutral lipid proportion (TO%), and L/D ratio, were considered the independent factors (Appendix 1). The EE% and release data (DR% at 6 hours, as initial rapid release, and DR% at 72 hours) of the prepared formulations were considered the response variables. The results were analyzed using ANOVA, and the statistical significance of each response coefficient was then determined using a Pareto chart. In a Pareto chart, the coefficients with a t-value of effect above the Bonferroni threshold are considered certainly significant; those between two thresholds are considered probably significant; those below the t-value threshold are statistically insignificant and should be excluded from the analysis (36). As causality cannot be inferred from observational data alone, a typical strategy is observing the system’s response to a collection of localized perturbations and reconstructing a directed interaction network from data (37). In perturbation plots, each response is depicted by changing only one parameter along its range while keeping all other parameters unchanged.
5.3. Effects of Variables on EE%
The EE is one of the important parameters in evaluating the suitability of drug carriers. A high percentage of EE reduces the injection volume, which is particularly important for local drug delivery. As summarized in Table 2, the EE% in the prepared formulations varied from 44.65% to 83.90%. After removing the non-significant variables, the quantitative effect of the variables and their interactions on the response EE% in terms of coded factors could be described by the following polynomial equation:
According to the ANOVA analysis, the model was significant for all the studied variables, with a model p-value of 0.0062 and an R2 value of 0.93. In addition, the curvature was statistically significant, and the lack of fit was not significant (P = 0.0187 and P = 0.583, respectively). According to the obtained equation, TO% and L/D ratio had a negative effect on EE%; between these two, TO had the greatest effect. These results are in line with previous reports.
Pareto charts were used for the better evaluation of the effect of variables. As it is visible in Appendix 6A, factors B (TO), C (L/D), AC, and BC all have a significant role in EE%; nevertheless, the effect of factor B (TO) is the greatest. The highest effect of TO on the EE value is also evident from the related perturbation diagram (Appendix 6A). Employing neutral lipids, such as TO, has an essential role in the formation of MVL structure (11). The TO acts as a stabilizing agent and hydrophobic filler in the spaces between vesicle junctions and is present in the encapsulated aqueous phase as oil dispersions (11, 38).
Since DOX is a water-soluble molecule, it is expected to be incorporated more in the internal aqueous space of the chambers. Accordingly, using a higher amount of TO might occupy the internal aqueous space and limits the loading of this water-soluble molecule. The negative correlation between the L/D ratio and EE% of DOX can be explained by the fact that as there are more lipids, more internal structures (vesicles) are generated in each MVL. As a result, with increasing lipid layers, the aqueous space inside the MVLs decreases, causing a reduction in the EE% of DOX.
5.4. Effects of Variables on DR Rate
The DR profiles of the prepared formulations (Figure 1) show a two-phase behavior. The initial rapid release phase might represent the release of molecules trapped in the aqueous phase surrounding the inner vesicles or accumulated in chambers that are closer to the outer environment of the liposomes, thereby moving a shorter path to the release medium. However, the second phase of release might involve the release of drug molecules trapped in the inner vesicles of the liposomes. Concerning the mechanism of DR from MVLs, it has been suggested that the permeation of the drug through the vesicle membranes (i.e., simple diffusion) is an important determinant. However, the surface erosion of the external vesicles, which has a role in the initial release of encapsulated molecules, and coalescence of internal vesicles, which is involved in the secondary slow release, have also been suggested as other mechanisms (11). Polynomial models between the responses (DR6h% and DR72h%) and independent variables were fitted using multiple linear regression (Equations 3 and 4 respectively).
The model p-values for DR6h% and DR72h% were 0.0021 and 0.0027, with R2 values of 0.98 and 0.97, respectively. According to equations 3 and 4, Pareto charts (Appendix 5), and perturbation plots (Appendix 6), the percentage of TO (variable B) was the most significant component, with a negative effect on the release rate. A similar trend has also been reported in previous studies (39, 40). The ratio of Chol/PL (variable A) showed a dual effect on the DR rate. Using a higher percentage of Chol slowed down the initial release phase of the drug; nevertheless, it accelerated the DR rate in the later slow phase.
5.5. Selected Formulation for Additional In Vitro Experiments
According to the experimental results (Table 2) and the software suggestion for optimum formulation with desirability equal to 1, formulation F12 (DepoDOX) with the highest EE% and an appropriate controlled release behavior was observed to be the most suitable formulation. In DepoDOX formulation, DR lasted 11 days (Figure 1). The release data (Table 2 and Figure 1) of the selected MVL showed a sustained release of the drug with about 21% and 50% within the first 6 and 72 hours, respectively. Although the obtained in vitro release profile might not be a precise predictor of the in vivo behavior, it provides a rational basis for performing further in vitro and in vivo studies. The median diameter (d 0.5) of DepoDOX was 9.81 μm with a span value of 2.23, confirming a relatively homogenous population for the vesicles.
Based on the results of the FTIR analysis (Appendix 8), it was demonstrated that the main bands in the spectrum of empty and loaded MVLs overlap and directly attribute to the properties of each of the individual components. It is also evident that DOX entrapment did not alter the distinct bands of MVLs, which confirms the absence of significant intermolecular interactions between DOX and liposomal components. Drug peaks were not observed in the DepoDOX spectrum, which might be due to the low L/D ratio in this formulation. A limited number of studies have been performed to investigate drug-carrier interactions via FTIR analysis for MVL carriers. In a study by Alavi et al. (41) on risperidone, similar results were obtained in the FTIR diagram. These results indicated that free drug peaks are eliminated, and the spectrum of the drug-loaded carrier is very similar to the empty carrier spectrum.
To evaluate the stability of the DepoDOX formulation under the storage conditions, the prepared formulation was kept at 4°C for 1 month. There were no noticeable changes in the values of EE%, particle size distribution, and zeta potential of the formulation (Appendix 7). It has been suggested that the non-concentric character of the lipid layer arrangement provides increased mechanical strength, greater stability, and extended DR duration for properly designed MVLs (11, 42).
The cytotoxicity of free DOX, blank MVL, and DepoDOX against MCF-7, 4T1, and fibroblast cells was evaluated. In the studied cell lines, the IC50 for DepoDOX was higher than free DOX (Appendix 4), which could be attributed to the slow release of DOX from the MVL vesicles (43). According to the results (Figures 2 and Appendix 9), by exposing the cells to a series of concentrations (i.e., 0.5, 1, 10, and 30 µg/mL) of DOX or DepoDOX for 24, 48, and 72 hours, it was shown that DOX cytotoxicity was dependent on both drug concentration and incubation time, indicating that the cytotoxicity of free and encapsulated DOX gradually increased but with a statistically significant difference. The evaluation of toxicity of the drug-free MVL, compared to standard saline (as control), showed that there was no statistically significant difference (P > 0.05), indicating that the MVL carrier had no toxicity to the cells.
Assessing the hemolytic potential of parenteral formulations is very important. The released hemoglobin can cause vascular irritation, phlebitis, anemia, jaundice, kernicterus, acute renal failure, and even death in certain cases (17). According to ISO 10993-4:2002, a test sample is defined as hemolytic if the hemolysis index is higher than 5% (16). Based on the hemolysis assay, DepoDOX revealed a hemolysis index of 1.47% which confirms the hemocompatibility of the prepared formulation. Nearly identical results have been reported by Alavi et al. for risperidone-loaded MVLs (41), supporting the biocompatibility of the investigated vesicles.
5.6. Conclusions
In the current study, an appropriate DOX-MVL formulation, DepoDOX, with suitable physicochemical characteristics, high physical stability, and sustained DR rate, was prepared for the locoregional delivery of DOX in cancer treatment. The obtained results can be considered promising preliminary data for the potential clinical application of DepoDOX for cancer treatment.


